Contents
Signal-to-noise power ratio in PM
To investigate noise behavior, we will take the AWGN channel as our starting point and calculate the sink SNR $ρ_v$ as a function of
- the frequency (bandwidth) $B_{\rm NF}$ of the cosine source signal,
- the transmit power $P_{\rm S}$,
- the channel transmission factor $α_{\rm K}$, and
- the (one-sided) noise power density $N_0$.
The principle procedure is described in detail in the section Investigations at the AWGN channel :
If the performance parameter
- $$\xi = \frac{\alpha_{\rm K}^2 \cdot P_{\rm S}}{N_0 \cdot B_{\rm NF}}$$
is sufficiently large, the follwoing approximatino is obtained for phase modulation with modulation index $η$ :
- $$\rho_{v } \approx {\eta^2}/{2} \cdot\xi \hspace{0.05cm}.$$
This means that for phase modulation, the sink SNR increases quadratically with increasing $η$ .
The exact calculation of $ρ_v$ is not very simple, and is also laborious. Here, we will only briefly describe the calculation steps:
- One approximates the white noise $n(t)$ for the bandwidth $B_{\rm HF}$ by a sum of sinusoidal interferences spaced by $f_{\rm St}$ (see second sketch in the following section).
- One calculates the S/N ratio after demodulation for each sinusoidal interference and sums the individual contributions,which are now all in the low-pass region $|f| < B_{\rm NF}$ .
- The above simple result is obtained after the boundary transition $f_{\rm St} → 0$. The sum then turns into an integral and this can be solved approximately.
Signal-to-noise power ratio in FM
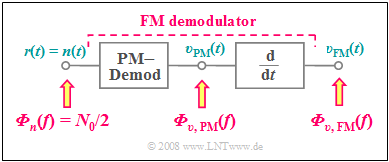
For calculation one uses the fact that the FM demodulator can be realized with a PM demodulator and a differentiator.
- The block diagram on the right refers only to the noise signals ⇒ $s(t) = 0$.
- Thus the received signal $r(t) = n(t)$, where we assume additive Gaussian white noise with center frequency $f_{\rm T}$ and bandwidth $B_{\rm HF}$ for $n(t)$ .
When calculating the noise power density after the FM demodulator, consider:
- The noise power density ${\it Φ}_{v,\hspace{0.05cm}{\rm PM}}(f)$ after the PM demodulator is in the low-pass range, has the (one-sided) bandwidth $B_{\rm NF}$ and is also "white"
(see left plot in the graph below). - The power density at the output of a linear system with frequency response $H(f)$ when the noise power density ${\it Φ}_{v,\hspace{0.05cm}{\rm PM}}(f)$ is applied to the input is generally:
- $${ \it \Phi}_{v {\rm , \hspace{0.05cm}FM} } (f) = { \it \Phi}_{v {\rm , \hspace{0.05cm}PM} } (f) \cdot |H(f)|^2 \hspace{0.05cm}.$$
- The differentiator is just such a linear system. Its frequency response $H(f)$ increases linearly with $f$ , and it is applied to the noise power density at the output of the FM demodulator (see the right plot in the lower graph):
- $${ \it \Phi}_{v {\rm , \hspace{0.05cm}FM} } (f) = {\rm const. } \cdot f^2 \cdot { \it \Phi}_{v {\rm , \hspace{0.05cm}PM} }(f) \hspace{0.05cm}.$$
$\rm Conclusion\text{:}$ Taking this result into account, one arrives at the following sink SNR (if the performance parameter $ξ$ is sufficiently large) after a longer calculation:
- $$\rho_{v } \approx \frac{3\cdot \eta^2}{2} \cdot \frac{\alpha_{\rm K}^2 \cdot P_{\rm S} }{N_0 \cdot B_{\rm NF} } = 3/2 \cdot{\eta^2} \cdot\xi \hspace{0.05cm}.$$
The graph illustrates:
- The noise power density ${\it Φ}_{v,\hspace{0.05cm}{\rm FM} }(f)$ is not white, unlike Gegensatz zu ${\it Φ}_{v,\hspace{0.05cm}{\rm PM} }(f)$ .
- Rather, ${\it Φ}_{v,\hspace{0.05cm}{\rm FM} }(f)$ increases quadratically towards the limits $(\pm B_{\rm NF} )$ .
- When $f = 0$ , ${\it Φ}_{v,\hspace{0.05cm}{\rm FM} }(f)$ has no noise components.
System comparison of AM, PM and FM with respect to noise
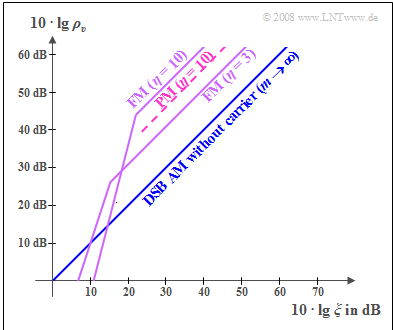
As explained in detail in the Investigations at the AWGN channel section and applied to amplitude modulation in the Sink SNR and the performance parameter section, we again consider the double-logarithmic plot of the sink SNR $ρ_v$ with the parameter
- $$\xi = \frac{\alpha_{\rm K}^2 \cdot P_{\rm S}}{N_0 \cdot B_{\rm NF}}.$$
These curves, which are to be understood qualitatively, are to be interpreted as follows:
- The comparison curve shows DSB–AM without a carrier ⇒ modulation depth $m → ∞$. Here, $ρ_v = ξ$ , and double-logarithmic representation also yields a $45^\circ$ degree straight line through the origin.
- The FM curve with $η = 3$ lies around $10 · \lg \ 13.5 ≈ 11.3 \ \rm dB$ above the AM curve. Visibly, the superior noise performance of frequency modulation can be explained by the fact that an additive noise component affects the position of the zero crossings less than it changes the amplitude values.
- If the effective noise is very large and thus the performance parameter very small $(10 · \lg \ ξ ≤ 15 \ \rm dB)$, angle modulation is not recommended. Due to the noise, zero crossings can then disappear completely, making their detection impossible. This is referred to as an "FM threshold effect".
- With regard to noise, the greatest possible modulation index should be aimed for with any type of angle modulation. Like this, the curve for $η = 10$ is about $10.4 \ \rm dB$ above the curve for $η = 3$. However, it must be taken into account that a larger $η$ also requires a larger bandwidth or - for a given channel bandwidth - causes stronger nonlinear distortions.
- For the same modulation index, phase modulation (PM) is always $10 \cdot \lg \ 3 ≈ 4.8 \ \rm dB$ worse than frequency modulation (FM). This is one of the reasons why analog phase modulation is of little importance in practice. In contrast, the 'Phase Shift Keying (PSK) variant is used more frequently than Frequency Shift Keying (FSK) in digital modulation because of other advantages.
- All curves given are quantitatively valid only for a harmonic oscillation (i.e. for only a single frequency). However, for a mix of frequencies - which is always present in practice - the curves apply at least qualitatively.
Preemphase und Deemphase
Ein wichtiges Ergebnis der letzten Abschnitte war, dass das Sinken–SNR bei FM entsprechend $\rho_{v } \approx 1.5 \cdot{\eta^2} \cdot\xi \hspace{0.05cm}$ in guter Näherung quadratisch vom Modulationsindex abhängt. Da aber bei Frequenzmodulation der Modulationsindex $η$ umgekehrt proportional zur Nachrichtenfrequenz $f_{\rm N}$ ist, hängt auch das Sinken–SNR von $f_{\rm N}$ ab.
Daraus ergeben sich folgende Konsequenzen:
- Besteht das Nachrichtensignal aus mehreren Frequenzen, so weisen die höheren Frequenzen nach einer FM–Modulation einen kleineren Modulationsindex $η$ auf als die niedrigeren Frequenzen.
- Das bedeutet auch: Die höheren Frequenzanteile $($mit kleinerem $η)$ sind dementsprechend stärker verrauscht als niedrigere Frequenzen, wenn nicht besondere Maßnahmen getroffen werden.
Eine solche Maßnahme ist beispielsweise eine Preemphase. Dabei werden höhere Frequenzen durch ein Hochpass–Filternetzwerk $H_{\rm PE}(f)$ angehoben und für diese der Modulationsindex $η$ erhöht.
Die sendeseitige Preemphase muss beim Empfänger durch ein Netzwerk $H_{\rm DE}(f) = 1/H_{\rm PE}(f)$ rückgängig gemacht werden. Dieses Absenken der höheren Frequenzen nennt man Deemphase.
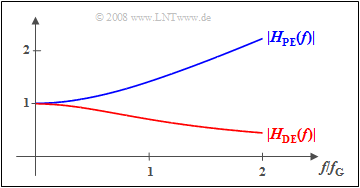
Die Grafik zeigt ein mögliches Beispiel für die Filterfunktionen von
- Preemphase (blau) ⇒ $|H_{{\rm PE} } (f)| = \sqrt{1 + \left({f}/{f_{\rm G}}\right)^2}\hspace{0.05cm},$
- Deemphase (rot) ⇒ $|H_{{\rm DE} } (f)| = |H_{{\rm PE} } (f)|^{-1} \hspace{0.05cm}.$
Aufgaben zum Kapitel
Aufgabe 3.10: Berechnung der Rauschleistungen
Aufgabe 3.10Z: Amplituden- und Winkelmodulation im Vergleich
Aufgabe 3.11: Preemphase und Deemphase


