Difference between revisions of "Modulation Methods/Phase Modulation (PM)"
| (8 intermediate revisions by 2 users not shown) | |||
| Line 8: | Line 8: | ||
== # OVERVIEW OF THE THIRD MAIN CHAPTER # == | == # OVERVIEW OF THE THIRD MAIN CHAPTER # == | ||
<br> | <br> | ||
| − | The third chapter describes »'''angle modulation'''« $\rm | + | The third chapter describes »'''angle modulation'''« $($short: "$\rm WM$" from German "Winkelmodulation"$)$. |
| − | * | + | |
| − | * | + | This is a generic term for |
| + | * »phase modulation« $\rm (PM)$, | ||
| + | |||
| + | * »frequency modulation« $\rm (FM)$. | ||
In detail, the chapter covers: | In detail, the chapter covers: | ||
| − | # | + | #The »similarities and differences« between phase and frequency modulation, |
#the »realization of the associated demodulators«, | #the »realization of the associated demodulators«, | ||
#the »signal characteristics and spectral functions« of angle-modulated signals and the influence of band limiting, | #the »signal characteristics and spectral functions« of angle-modulated signals and the influence of band limiting, | ||
| Line 38: | Line 41: | ||
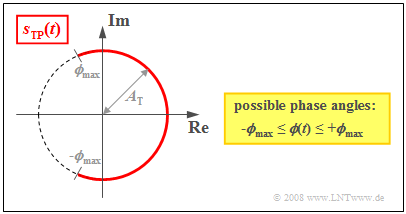
*The locus curve is an "arc" with radius $A_{\rm T}$. It follows that the envelope of an angle-modulated signal is always constant: | *The locus curve is an "arc" with radius $A_{\rm T}$. It follows that the envelope of an angle-modulated signal is always constant: | ||
:$$a(t) = |s_{\rm TP}(t)|= A_{\rm T}= {\rm const.}$$ | :$$a(t) = |s_{\rm TP}(t)|= A_{\rm T}= {\rm const.}$$ | ||
| − | *The equivalent low-pass signal in angle modulation is always complex and determined by a time-dependent "phase function" $ϕ(t)$ (in radians), which determines the zero | + | *The equivalent low-pass signal in angle modulation is always complex and determined by a time-dependent "phase function" $ϕ(t)$ (in radians), which determines the zero crossings of $s(t)$: |
:$$s_{\rm TP}(t)= A_{\rm T} \cdot {\rm e}^{\hspace{0.05cm}{\rm j}\hspace{0.05cm}\cdot \hspace{0.05cm}\phi(t)}\hspace{0.05cm}.$$ | :$$s_{\rm TP}(t)= A_{\rm T} \cdot {\rm e}^{\hspace{0.05cm}{\rm j}\hspace{0.05cm}\cdot \hspace{0.05cm}\phi(t)}\hspace{0.05cm}.$$ | ||
*For a symmetric source signal, $ϕ(t)$ can take on all values between $±ϕ_{\rm max}$, where $ϕ_{\rm max}$ indicates the »'''phase deviation'''«. The larger the phase deviation, the more intense the modulation. | *For a symmetric source signal, $ϕ(t)$ can take on all values between $±ϕ_{\rm max}$, where $ϕ_{\rm max}$ indicates the »'''phase deviation'''«. The larger the phase deviation, the more intense the modulation. | ||
| Line 49: | Line 52: | ||
*on the right, the transmitted signal $s(t)$ ⇒ blue waveforms, compared to the carrier signal $z(t)$ ⇒ red waveforms, | *on the right, the transmitted signal $s(t)$ ⇒ blue waveforms, compared to the carrier signal $z(t)$ ⇒ red waveforms, | ||
*on the left, the equivalent low-pass signal $s_{\rm TP}(t)$ in the complex plane. | *on the left, the equivalent low-pass signal $s_{\rm TP}(t)$ in the complex plane. | ||
| − | [[File: | + | [[File:EN Mod T 3 1 S1b v3.png|right|frame|Physical signal and equivalent low-pass signal for angle and amplitude modulation]] |
| Line 56: | Line 59: | ||
The upper graph applies in the case of angle modulation $\rm (WM)$: | The upper graph applies in the case of angle modulation $\rm (WM)$: | ||
*The equivalent low-pass signal $s_{\rm TP}(t) = A_{\rm T} · {\rm e}^{ \hspace{0.05cm}{\rm j}\hspace{0.05cm}· \hspace{0.05cm}ϕ(t)}$ describes an arc ⇒ constant envelope $a(t) = A_{\rm T}$. | *The equivalent low-pass signal $s_{\rm TP}(t) = A_{\rm T} · {\rm e}^{ \hspace{0.05cm}{\rm j}\hspace{0.05cm}· \hspace{0.05cm}ϕ(t)}$ describes an arc ⇒ constant envelope $a(t) = A_{\rm T}$. | ||
| − | *Thus, the information about the source signal $q(t)$ is exclusively found in the zero | + | *Thus, the information about the source signal $q(t)$ is exclusively found in the zero crossings of $s(t)$. |
*Should $ϕ(t) < 0$ hold, then the zero crossings of $s(t)$ occur later than those of $z(t)$. Otherwise – when $ϕ(t) > 0$, the zero crossings of $s(t)$ come before $z(t)$. | *Should $ϕ(t) < 0$ hold, then the zero crossings of $s(t)$ occur later than those of $z(t)$. Otherwise – when $ϕ(t) > 0$, the zero crossings of $s(t)$ come before $z(t)$. | ||
| − | The lower graph corresponds to [[Modulation_Methods/Double-Sideband_Amplitude_Modulation|$\text{ | + | The lower graph corresponds to [[Modulation_Methods/Double-Sideband_Amplitude_Modulation|$\text{Double-Sideband Amplitude Modulation}$]] $\rm (DSB-AM)$ as described in Chapter 2, characterized by |
*the time-dependent envelope $a(t)$ according to the signal $q(t)$, | *the time-dependent envelope $a(t)$ according to the signal $q(t)$, | ||
*equidistant zero crossings of $s(t)$ according to the carrier $z(t)$, and | *equidistant zero crossings of $s(t)$ according to the carrier $z(t)$, and | ||
| Line 240: | Line 243: | ||
{{GraueBox|TEXT= | {{GraueBox|TEXT= | ||
| − | [[File:EN_Mod_T_3_1_S3c.png |right|frame| Example of an equivalent low-pass–signal in phase modulation | + | [[File:EN_Mod_T_3_1_S3c.png |right|frame| Example of an equivalent low-pass–signal in phase modulation]] |
$\rm Example\ 3\text{:}$ The Bessel functions yield the following values for the modulation index $η = 1$: | $\rm Example\ 3\text{:}$ The Bessel functions yield the following values for the modulation index $η = 1$: | ||
:$${\rm J}_0 = 0.765,\hspace{0.3cm}{\rm J}_1 = - {\rm J}_{ - 1} = 0.440, \hspace{0.3cm}{\rm J}_2 = {\rm J}_{ - 2} = 0.115,\hspace{0.3cm}{\rm J}_3 = - {\rm J}_{ - 3} = 0.020\hspace{0.05cm}.$$ | :$${\rm J}_0 = 0.765,\hspace{0.3cm}{\rm J}_1 = - {\rm J}_{ - 1} = 0.440, \hspace{0.3cm}{\rm J}_2 = {\rm J}_{ - 2} = 0.115,\hspace{0.3cm}{\rm J}_3 = - {\rm J}_{ - 3} = 0.020\hspace{0.05cm}.$$ | ||
| Line 325: | Line 328: | ||
| − | *The low-pass spectrum $S_{\rm TP}(f) = B_1(f) \star B_2(f)$ consists of nine Dirac lines and is sketched in the diagram on the right. | + | *The low-pass spectrum $S_{\rm TP}(f) = B_1(f) \star B_2(f)$ consists of nine Dirac delta lines and is sketched in the diagram on the right. |
Latest revision as of 13:43, 18 January 2023
Contents
- 1 # OVERVIEW OF THE THIRD MAIN CHAPTER #
- 2 Similarities between phase and frequency modulation
- 3 Signal characteristics of phase modulation
- 4 Equivalent low-pass signal in phase modulation
- 5 Interpretation of the Bessel spectrum
- 6 Spectral function of a phase-modulated sine signal
- 7 Phase modulation of the sum of two sinusoidal oscillations
- 8 Exercises for the chapter
- 9 References
# OVERVIEW OF THE THIRD MAIN CHAPTER #
The third chapter describes »angle modulation« $($short: "$\rm WM$" from German "Winkelmodulation"$)$.
This is a generic term for
- »phase modulation« $\rm (PM)$,
- »frequency modulation« $\rm (FM)$.
In detail, the chapter covers:
- The »similarities and differences« between phase and frequency modulation,
- the »realization of the associated demodulators«,
- the »signal characteristics and spectral functions« of angle-modulated signals and the influence of band limiting,
- the »signal-to-noise power ratio« of FM, which is more favorable than that of AM.
Similarities between phase and frequency modulation
It has already been pointed out in the chapter "General Model of Modulation" that there are substantial similarities between phase modulation $\rm (PM)$ and frequency modulation $\rm (FM)$. Therefore, these two related modulation methods are summarized under the general term "angle modulation".
$\rm Definition\text{:}$ An »angle modulation« – abbreviated as $\rm WM$ – is present whenever the modulated signal can be represented as follows:
- $$s(t) = A_{\rm T} \cdot \cos\big[\psi(t)\big] = A_{\rm T} \cdot \cos\hspace{-0.1cm}\big[ω_{\rm T} · t + ϕ(t)\big] \hspace{0.05cm}.$$
- Here, as in amplitude modulation, $A_{\rm T}$ denotes the amplitude of the carrier signal $z(t)$.
- However, all the information about the source signal $q(t)$ is now captured by the "angular function" $ψ(t)$.
Based on the plot of the equivalent low-pass signal $s_{\rm TP}(t)$ (subscript from the German "Tiefpass" ⇒ low-pass) on the complex plane (we will refer to such a plot as a "locus curve"), the following characteristics of angle modulation can be seen:
- The locus curve is an "arc" with radius $A_{\rm T}$. It follows that the envelope of an angle-modulated signal is always constant:
- $$a(t) = |s_{\rm TP}(t)|= A_{\rm T}= {\rm const.}$$
- The equivalent low-pass signal in angle modulation is always complex and determined by a time-dependent "phase function" $ϕ(t)$ (in radians), which determines the zero crossings of $s(t)$:
- $$s_{\rm TP}(t)= A_{\rm T} \cdot {\rm e}^{\hspace{0.05cm}{\rm j}\hspace{0.05cm}\cdot \hspace{0.05cm}\phi(t)}\hspace{0.05cm}.$$
- For a symmetric source signal, $ϕ(t)$ can take on all values between $±ϕ_{\rm max}$, where $ϕ_{\rm max}$ indicates the »phase deviation«. The larger the phase deviation, the more intense the modulation.
- For a harmonic oscillation, the phase deviation $ϕ_{\rm max}$ is equal to the »modulation index« $η$. Thus, the use of $η$ in what follows also indicates that $q(t)$ only contains a single frequency.
- The relationship between the source signal $q(t)$ and the angular function $ψ(t) = \cos\hspace{-0.1cm}\big[ω_{\rm T} · t + ϕ(t)\big]$ , just like the phase function $ϕ(t)$ that can be derived from it, differs fundamentally in phase and frequency modulation, which will be discussed in detail in the chapter "Frequency Modulation" .
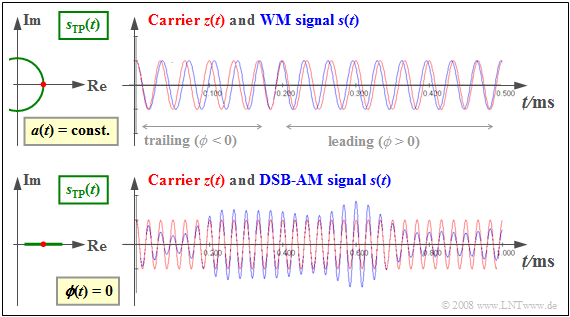
$\text{Example 1:}$ The following graph shows
- on the right, the transmitted signal $s(t)$ ⇒ blue waveforms, compared to the carrier signal $z(t)$ ⇒ red waveforms,
- on the left, the equivalent low-pass signal $s_{\rm TP}(t)$ in the complex plane.
We also refer to the (left) plot in the complex plane as the "locus curve" ⇒ green waveforms.
The upper graph applies in the case of angle modulation $\rm (WM)$:
- The equivalent low-pass signal $s_{\rm TP}(t) = A_{\rm T} · {\rm e}^{ \hspace{0.05cm}{\rm j}\hspace{0.05cm}· \hspace{0.05cm}ϕ(t)}$ describes an arc ⇒ constant envelope $a(t) = A_{\rm T}$.
- Thus, the information about the source signal $q(t)$ is exclusively found in the zero crossings of $s(t)$.
- Should $ϕ(t) < 0$ hold, then the zero crossings of $s(t)$ occur later than those of $z(t)$. Otherwise – when $ϕ(t) > 0$, the zero crossings of $s(t)$ come before $z(t)$.
The lower graph corresponds to $\text{Double-Sideband Amplitude Modulation}$ $\rm (DSB-AM)$ as described in Chapter 2, characterized by
- the time-dependent envelope $a(t)$ according to the signal $q(t)$,
- equidistant zero crossings of $s(t)$ according to the carrier $z(t)$, and
- a horizontal straight line as the locus curve $s_{\rm TP}(t)$.
The present third chapter has been structured according to the following considerations:
- Any $\rm FM$ system can be converted into a corresponding $\rm PM$ system by simple modifications and vice versa.
- $\rm FM$ is more important for analog systems due to its more favorable noise behaviour. For this reason, considerations concerning the realization of the modulator/demodulator will only be dealt with in the chapter "Frequency Modulation".
- Phase modulation is easier to understand compared to $\rm FM$. Therefore, the basic properties of an angle modulation system are first presented in this chapter using $\rm PM$ as an example.
Signal characteristics of phase modulation
Without limiting generality, the following assumes:
- a cosine carrier signal $z(t) = A_{\rm T} · \cos(ω_{\rm T} · t)$, that is, the carrier phase is always $ϕ_{\rm T} = 0$,
- a peak-limited source signal between the limits $\ –q_{\rm max} ≤ q(t) ≤ +q_{\rm max}$.
$\rm Definition\text{:}$ If the phase function $ϕ(t)$ is proportional to the applied source signal $q(t)$, we are dealing with »phase modulation« $\rm (PM)$, and it holds that:
- $$\phi(t)= K_{\rm PM} \cdot q(t)\hspace{0.05cm}\hspace{0.3cm}\Rightarrow \hspace{0.3cm}\psi(t)= \omega_{\rm T} \cdot t + \phi(t)\hspace{0.3cm}\Rightarrow \hspace{0.3cm}s(t) = A_{\rm T} \cdot \cos \big[\psi(t)\big]\hspace{0.05cm}.$$
Here, $K_{\rm PM}$ denotes the modulator constant with appropriate dimensions. If $q(t)$ describes a voltage waveform, this constant has the unit $\rm 1/V$.
The phase modulation is all the more intensive,
- the larger the modulator constant $K_{\rm PM}$, or
- the larger the maximum value $q_{\rm max}$ of the source signal.
$\rm Definitions\text{:}$
(1) Quantitatively, this fact is captured by the »phase deviation«
- $$ \phi_{\rm max} = K_{\rm PM} \cdot q_{\rm max}\hspace{0.05cm}.$$
(2) For a harmonic oscillation, the "phase deviation" is also called »modulation index«. The following holds for the amplitude $A_{\rm N}$ of the source signal:
- $$\eta = \eta_{\rm PM} = K_{\rm PM} \cdot A_{\rm N}\hspace{0.05cm}.$$
The following should be noted about this equation:
- The modulation index $η$ is comparable to the modulation depth $m$ in DSB–AM with carrier.
- In the locus curve, the parameters $ϕ_{\rm max}$ or $η$ describe the half angle of the circular arc in radians.
- For other source signals with the same $η$ $($e.g.: with different phase $ϕ_{\rm N})$ the locus curve itself does not change, only the temporal movement along the curve does.
- The modulation index is also used in describing frequency modulation, though in that case it is to be calculated somewhat differently.
- We therefore distinguish between $η_{\rm PM}$ and $η_{\rm FM}$.
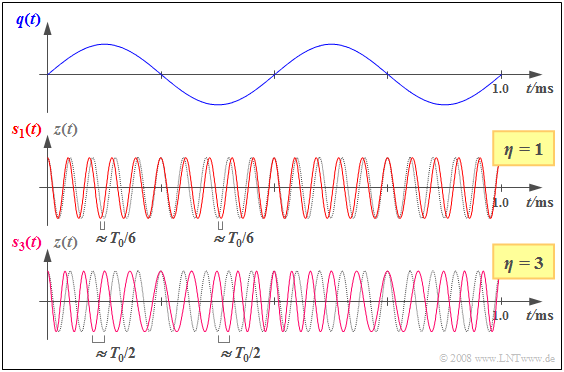
$\rm Example \ 2\text{:}$ The graph shows a sinusoidal source signal $q(t)$ with frequency $f_{\rm N} = 2 \ \rm kHz$ and amplitude $A_{\rm N}$, and two phase modulated signals drawn below.
- These differ by the parameters $η = 1$ and $η = 3$, resp.:
- $$s_\eta(t) = A_{\rm T} \cdot \cos \hspace{-0.1cm}\big[\omega_{\rm T} \cdot t + \eta \cdot \sin (\omega_{\rm N} \cdot t) \big]\hspace{0.05cm}.$$
- Dotted in gray is the cosine carrier signal $z(t)$, in each case based on $f_{\rm T} = 20 \ \rm kHz$ .
- For example, the modulation index $η = 1$ , thus the transmitted signal $s_1(t)$ is given by
- $A_{\rm N} = 1 \, \rm V $ and $K_{\rm PM} = \rm 1/V$,
- but also by parameter values $A_{\rm N} = 2 \ \rm V$ and $K_{\rm PM} = \rm 0.5/V$.
From the curves, one can see:
- The zero crossings of the transmitted signal $s_1(t)$ and the carrier signal $z(t)$ coincide exactly when $q(t) ≈ 0$.
- When $q(t) = +\hspace{-0.05cm}A_{\rm N}$, the zero crossings come $1/(2π) ≈ 0.159$ of a carrier period $T_0$ earlier ("leading").
- When $q(t) = -\hspace{-0.05cm}A_{\rm N}$, the zero crossings come the same period fraction later ("lagging").
- Increasing the index to $η = 3$ $($by tripling $A_{\rm N}$ or $K_{\rm PM})$, we get qualitatively the same result, but with a more intense PM.
- The zero crossings of $s_3(t)$ are now shifted relative to those of the carrier by a maximum of $\rm ±3/(2π) ≈ ±0.5$ of a period, i.e., up to $±T_0/2$.
Equivalent low-pass signal in phase modulation
In preparation for deriving the spectrum $S(f)$ of a phase modulated signal $s(t)$, we first analyse the equivalent low-pass signal $s_{\rm TP}(t)$. In the folowing, we assume:
- a sine-shaped source signal $q(t)$ with amplitude $A_{\rm N}$ and frequency $f_{\rm N}$,
- a cosine-shaped carrier signal $z(t)$ with amplitude $A_{\rm T}$ and frequency $f_{\rm T}$,
- phase modulation with modulation index $η = K_{\rm PM} · A_{\rm N}$.
Thus, the phase modulated signal and the corresponding equivalent low-pass signal are:
- $$s(t) = A_{\rm T} \cdot \cos \big[\omega_{\rm T} \cdot t + \eta \cdot \sin (\omega_{\rm N} \cdot t) \big]\hspace{0.05cm},$$
- $$s_{\rm TP}(t) = A_{\rm T} \cdot {\rm e}^{\hspace{0.05cm}{\rm j} \hspace{0.05cm}\cdot \hspace{0.05cm}\eta \hspace{0.05cm}\cdot \hspace{0.05cm}\sin (\omega_{\rm N} \cdot t) }\hspace{0.05cm}.$$
This signal is periodic and can be represented by a $\text{complex Fourier series}$. Thus, in general one obtains:
- $$s_{\rm TP}(t) = \sum_{n = - \infty}^{+\infty}D_{n} \cdot {\rm e}^{\hspace{0.05cm}{\rm j} \hspace{0.05cm}\cdot \hspace{0.05cm}n\hspace{0.05cm}\cdot \hspace{0.05cm}\omega_{\rm N} \hspace{0.05cm}\cdot \hspace{0.05cm} t} \hspace{0.05cm}.$$
In the special case considered here (sinusoidal source signal, cosinusoidal carrier) the typically complex Fourier coefficients $D_n$ are all real and given by $n$–th order »Bessel functions« of the first kind ${\rm J}_n(η)$ as follows:
- $$D_{n} = A_{\rm T}\cdot {\rm J}_n (\eta) \hspace{0.05cm}. \hspace{1cm} $$
$\text{Important intermediate result:}$ Now it should be mathematically proven that in the case of phase modulation, the equivalent low-pass signal can indeed be converted into the following function series:
- $$s_{\rm TP}(t) = A_{\rm T} \cdot {\rm e}^{\hspace{0.05cm}{\rm j} \hspace{0.05cm}\cdot \hspace{0.05cm}\eta \hspace{0.05cm}\cdot \hspace{0.05cm}\sin (\omega_{\rm N} \cdot t) } \hspace{0.3cm}\Rightarrow \hspace{0.3cm} s_{\rm TP}(t) = A_{\rm T} \cdot \sum_{n = - \infty}^{+\infty}{\rm J}_n (\eta) \cdot {\rm e}^{\hspace{0.05cm}{\rm j} \hspace{0.05cm}\cdot \hspace{0.05cm}n\hspace{0.05cm}\cdot \hspace{0.05cm}\omega_{\rm N} \hspace{0.05cm}\cdot \hspace{0.05cm} t}.$$
$\text{Proof:}$ For simplicity, we set $A_{\rm T} = 1$. Thus, the given equivalent low-pass signal is:
- $$s_{\rm TP}(t) = {\rm e}^{\hspace{0.05cm}{\rm j} \hspace{0.05cm}\cdot \hspace{0.05cm}\eta \hspace{0.05cm}\cdot \hspace{0.05cm}\sin (\omega_{\rm N} \cdot t) }\hspace{0.05cm}.$$
(1) When $x = {\rm j} · η · \sin(γ)$ and $γ = ω_{\rm N} · t$, the power series expansion of this equation is:
- $$s_{\rm TP}(t) = {\rm e}^{x } = 1 + x + \frac{1}{2!} \cdot x^2 + \frac{1}{3!} \cdot x^3 + \text{...} = 1 + {\rm j} \cdot \eta \cdot \sin (\gamma)+ \frac{1}{2!} \cdot {\rm j}^2 \cdot \eta^2 \cdot \sin^2 (\gamma)+ \frac{1}{3!} \cdot {\rm j}^3 \cdot \eta^3 \cdot \sin^3 (\gamma) + \text{...}$$
(2) The individual trigonometric expressions can be rewritten as follows:
- $$ \frac{1}{2!} \cdot {\rm j}^2 \cdot \eta^2 \cdot \sin^2 (\gamma) = \frac{- \eta^2}{2 \cdot 2!} \cdot \big[ 1 - \cos (2\gamma)\big],\hspace{1.0cm} \frac{1}{3!} \cdot {\rm j}^3 \cdot \eta^3 \cdot \sin^3 (\gamma) = \frac{- {\rm j} \cdot \eta^3}{4 \cdot 3!} \cdot \big[ 3 \cdot \sin (\gamma)- \sin (3\gamma)\big],$$
- $$ \frac{1}{4!} \cdot {\rm j}^4 \cdot \eta^4 \cdot \sin^4 (\gamma) = \frac{\eta^4}{8 \cdot 4!} \cdot \left[ 3+ 4 \cdot \cos (2\gamma)+ \cos (4\gamma)\right], \text{...} $$
(3) By rearranging using ${\rm J}_n(η)$, we obtain the first kind of $n$–th order Bessel functions:
- $$s_{\rm TP}(t) = 1 \cdot {\rm J}_0 (\eta) + 2 \cdot {\rm j}\cdot {\rm J}_1 (\eta)\cdot \sin (\gamma) \hspace{0.2cm} + 2 \cdot {\rm J}_2 (\eta)\cdot \cos (2\gamma) + 2 \cdot {\rm j}\cdot {\rm J}_3 (\eta)\cdot \sin (3\gamma)+ 2 \cdot {\rm J}_4 (\eta)\cdot \cos (4\gamma) + \text{...} $$
(4) Using Euler's theorem, this can be written as:
- $$s_{\rm TP}(t) = {\rm J}_0 (\eta) + \big[ {\rm e}^{\hspace{0.05cm}{\rm j} \hspace{0.05cm}\cdot \hspace{0.05cm} \gamma} - {\rm e}^{\hspace{0.05cm}{ - \rm j} \hspace{0.05cm}\cdot \hspace{0.05cm} \gamma} \big]\cdot {\rm J}_1 (\eta) \hspace{0.27cm} +\left[ {\rm e}^{\hspace{0.05cm}{\rm j} \hspace{0.05cm}\cdot \hspace{0.05cm} 2\gamma} + {\rm e}^{\hspace{0.05cm}{ - \rm j} \hspace{0.05cm}\cdot \hspace{0.05cm} 2\gamma} \right]\cdot {\rm J}_2 (\eta)+ \left[ {\rm e}^{\hspace{0.05cm}{\rm j} \hspace{0.05cm}\cdot \hspace{0.05cm} 3\gamma} - {\rm e}^{\hspace{0.05cm}{ - \rm j} \hspace{0.05cm}\cdot \hspace{0.05cm} 3\gamma} \right]\cdot {\rm J}_3 (\eta)+ \left[ {\rm e}^{\hspace{0.05cm}{\rm j} \hspace{0.05cm}\cdot \hspace{0.05cm} 4\gamma} + {\rm e}^{\hspace{0.05cm}{ - \rm j} \hspace{0.05cm}\cdot \hspace{0.05cm} 4\gamma} \right]\cdot {\rm J}_4 (\eta)+\text{...}$$
(5) The Bessel functions exhibit the following symmetrical properties:
- $${\rm J}_{-n} (\eta) = ( - 1)^n \cdot {\rm J}_{n} (\eta)\hspace{0.3cm} \Rightarrow \hspace{0.3cm} {\rm J}_{ - 1} (\eta) = - {\rm J}_{1} (\eta),\hspace{0.3cm}{\rm J}_{ - 2} (\eta) = {\rm J}_{2} (\eta),\hspace{0.3cm}{\rm J}_{ - 3} (\eta) = - {\rm J}_{3} (\eta),\hspace{0.3cm}{\rm J}_{ - 4} (\eta) = {\rm J}_{4} (\eta).$$
(6) Considering this fact and the factor $A_{\rm T}$ omitted so far, we get the desired result:
- $$s_{\rm TP}(t) = A_{\rm T} \cdot \sum_{n = - \infty}^{+\infty}{\rm J}_n (\eta) \cdot {\rm e}^{\hspace{0.05cm}{\rm j} \hspace{0.05cm}\cdot \hspace{0.05cm}n\hspace{0.05cm}\cdot \hspace{0.05cm}\omega_{\rm N} \hspace{0.05cm}\cdot \hspace{0.05cm} t}.$$
These mathematical functions, introduced as early as 1844 by $\text{Friedrich Wilhelm Bessel}$ are defined as
- $${\rm J}_n (\eta) = \frac{1}{2\pi}\cdot \int_{-\pi}^{+\pi} {{\rm e}^{\hspace{0.05cm}{\rm j}\hspace{0.05cm}\cdot \hspace{0.05cm}(\eta \hspace{0.05cm}\cdot \hspace{0.05cm}\sin(\alpha) -\hspace{0.05cm} n \hspace{0.05cm}\cdot \hspace{0.05cm}\alpha)}}\hspace{0.1cm}{\rm d}\alpha\hspace{0.05cm},$$
and can be approximated by a series according to the next equation:
- $${\rm J}_n (\eta) = \sum\limits_{k=0}^{\infty}\frac{(-1)^k \cdot (\eta/2)^{n \hspace{0.05cm} + \hspace{0.05cm} 2 \hspace{0.02cm}\cdot \hspace{0.05cm}k}}{k! \cdot (n+k)!} \hspace{0.05cm}.$$
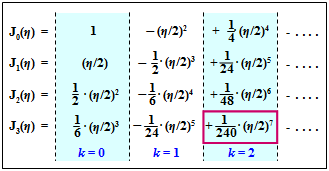
The adjacent graph shows the first three summands $(k = 0,\ 1,\ 2)$ of each of the series ${\rm J}_0(η)$, ... , ${\rm J}_3(η).$
- For example, the term outlined in red – valid for $n = 3$ and $k = 2$ – is written as:
- $$\frac{(-1)^2 \cdot (\eta/2)^{3 \hspace{0.05cm} + \hspace{0.05cm} 2 \hspace{0.02cm}\cdot \hspace{0.05cm}2}}{2\hspace{0.05cm}! \cdot (3+2)\hspace{0.05cm}!} = \frac{1}{240}\cdot (\frac{\eta}{2})^7 \hspace{0.05cm}.$$
- The Bessel functions ${\rm J}_n(η)$ can also be found in collections of formulae or with our applet "Bessel functions of the first kind".
- If the function values for $n = 0$ and $n = 1$ are known, the Bessel functions for $n ≥ 2$ can be iteratively determined from them:
- $${\rm J}_n (\eta) ={2 \cdot (n-1)}/{\eta} \cdot {\rm J}_{n-1} (\eta) - {\rm J}_{n-2} (\eta) \hspace{0.05cm}.$$
Interpretation of the Bessel spectrum
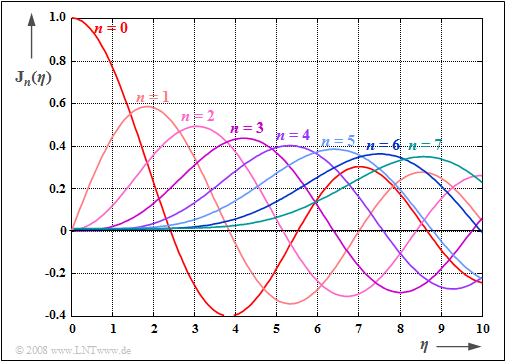
The graph shows the Bessel functions ${\rm J}_0(η)$, ... , ${\rm J}_7(η)$ depending on the modulation index $η$ in the range $0 ≤ η ≤ 10$.
One can also find these in formula collections such as [BS01][1] in tabular form.
- That the functions are of the first kind is expressed by the "$\rm J$", and
- the order is given by the index $n$.
Using this graph, the equivalent low-pass signal is given by
- $$s_{\rm TP}(t) = A_{\rm T} \cdot \sum_{n = - \infty}^{+\infty}{\rm J}_n (\eta) \cdot {\rm e}^{\hspace{0.05cm}{\rm j} \hspace{0.05cm}\cdot \hspace{0.05cm}n\hspace{0.05cm}\cdot \hspace{0.05cm}\omega_{\rm N} \hspace{0.05cm}\cdot \hspace{0.05cm} t}.$$
The following properties can be derived:
- The equivalent low-pass signal is composed of
- a pointer at rest $(n = 0)$
- and infinitely many clockwise $(n < 0)$
- or counterclockwise $(n > 0)$ rotating pointers.
- The pointer lengths depend on the modulation index $η$ via the Bessel functions ${\rm J}_n(η)$.
- The smaller the modulation index $η$, the more pointers can be ignored for the construction of $s_{\rm TP}(t)$. For example, with a modulation index of $η = 1$, the following approximation holds:
- $$s_{\rm TP}(t) = {\rm J}_0 (1) + {\rm J}_1 (1)\cdot {\rm e}^{\hspace{0.05cm}{\rm j} \hspace{0.05cm}\omega_{\rm N} \hspace{0.05cm} t}+ {\rm J}_2 (1)\cdot {\rm e}^{\hspace{0.05cm}{\rm j} \hspace{0.05cm}2 \hspace{0.05cm}\omega_{\rm N} \hspace{0.05cm} t}+ {\rm J}_3 (1)\cdot {\rm e}^{\hspace{0.05cm}{\rm j} \hspace{0.05cm}3 \hspace{0.05cm}\omega_{\rm N} \hspace{0.05cm} t}- {\rm J}_1 (1)\cdot {\rm e}^{-{\rm j} \hspace{0.05cm}\omega_{\rm N} \hspace{0.05cm} t}+ {\rm J}_2 (1)\cdot {\rm e}^{-{\rm j} \hspace{0.05cm}2 \hspace{0.05cm}\omega_{\rm N} \hspace{0.05cm} t}- {\rm J}_3 (1)\cdot {\rm e}^{-{\rm j} \hspace{0.05cm}3 \hspace{0.05cm}\omega_{\rm N} \hspace{0.05cm} t}\hspace{0.05cm}.$$
- Here, the symmetrical relationship ${\rm J}_{–n}(η) = (–1)^n · {\rm J}_n(η)$ is taken into account. Thus:
- $${\rm J}_{-1}(\eta) = - {\rm J}_{1}(\eta), \hspace{0.3cm}{\rm J}_{-2}(\eta) = {\rm J}_{2}(\eta), \hspace{0.3cm}{\rm J}_{-3}(\eta) = - {\rm J}_{3}(\eta).$$
- Further, it can be seen from the above equation that with $η = 3$, the equivalent low-pass signal $s_{\rm TP}(t)$ is composed of significantly more pointers, namely those with indices ${\rm J}_{–6}(\eta)$, ... , ${\rm J}_{+6}(\eta)$.
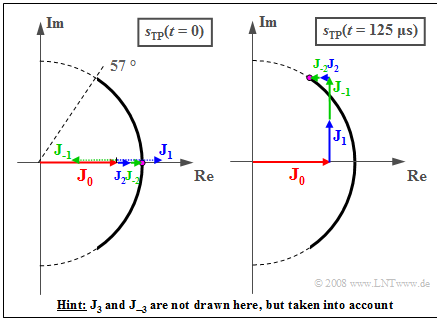
$\rm Example\ 3\text{:}$ The Bessel functions yield the following values for the modulation index $η = 1$:
- $${\rm J}_0 = 0.765,\hspace{0.3cm}{\rm J}_1 = - {\rm J}_{ - 1} = 0.440, \hspace{0.3cm}{\rm J}_2 = {\rm J}_{ - 2} = 0.115,\hspace{0.3cm}{\rm J}_3 = - {\rm J}_{ - 3} = 0.020\hspace{0.05cm}.$$
The graph shows the composition of the locus curves from the seven pointers.
- For simplicity, set $A_{\rm T} = 1$.
- The frequency of the sinusoidal source signal is $f_{\rm N} = 2 \ \rm kHz$, which gives the period
- $$T_{\rm N} = 1/f_{\rm N} = 500 \ \rm µ s.$$
The left image shows the snapshot at time $t = 0$.
- Because ${\rm J}_1 = – {\rm J}_{ – 1}$ and ${\rm J}_3 = – {\rm J}_{ – 3}$, the following holds:
- $$s_{\rm TP}(t = 0) = {\rm J}_0 + {\rm J}_{2} + {\rm J}_{ - 2} = 0.765 + 2 \cdot 0.115 = 0.995 \hspace{0.05cm}.$$
- The phase ${\mathbf ϕ}(t = 0) = 0$ and the magnitude $a(t = 0) = 1$ follow from the real result.
- The slightly different value $0.995$ shows that though ${\rm J}_4 = {\rm J}_{ – 4}$ is small $(≈ 0.002)$, it is not equal to zero.
The right image shows the ratios at time $t = T_{\rm N}/4 = 125\ \rm µ s$:
- The pointers with lengths ${\rm J}_{– 1}$ and ${\rm J}_1$ have rotated clockwise resp. counterclockwise by $90^\circ$, and now both point in the direction of the imaginary axis.
- The pointers ${\rm J}_2$ and ${\rm J}_{– 2}$ rotate twice as fast as ${\rm J}_1$ and ${\rm J}_{– 1}$ and now both point in the direction of the negative real axis.
- ${\rm J}_3$ and ${\rm J}_{– 3}$ rotate at three times the speed of ${\rm J}_1$ und ${\rm J}_{– 1}$ and now both point downward.
- This gives:
- $$s_{\rm TP}(t = 125\,{\rm µ s}) = {\rm J}_0 - 2 \cdot {\rm J}_{2} + {\rm j} \cdot (2 \cdot {\rm J}_{1} - 2 \cdot {\rm J}_{3})= 0.535 + {\rm j} \cdot 0.840 $$
- $$ \Rightarrow \hspace{0.3cm} a(t = 125\,{\rm µ s}) = \sqrt{0.535^2 + 0.840^2}= 0.996\hspace{0.05cm},$$
- $$ \Rightarrow \hspace{0.3cm}\phi(t = 125\,{\rm µ s}) = \arctan \frac{0.840}{0.535} = 57.5^\circ \approx 1\,{\rm rad}\hspace{0.05cm}.$$
- At all others times, the vector sum of the seven pointers each also yields a point on the arc with angle $ϕ(t)$, where $\vert ϕ(t) \vert ≤ η = 1\ \rm rad $.
Spectral function of a phase-modulated sine signal
$\text{Without proof:}$
- Based on the equivalent low-pass signal just calculated, we obtain for the »analytical signal«:
- $$s_{\rm +}(t) = s_{\rm TP}(t) \cdot {\rm e}^{\hspace{0.05cm}{\rm j} \hspace{0.05cm}\cdot \hspace{0.05cm}\omega_{\rm T} \hspace{0.05cm}\cdot \hspace{0.05cm} t}= A_{\rm T} \cdot \sum_{n = - \infty}^{+\infty}{\rm J}_n (\eta) \cdot {\rm e}^{\hspace{0.05cm}{\rm j} \hspace{0.05cm}\cdot \hspace{0.05cm}(\omega_{\rm T}\hspace{0.05cm}+\hspace{0.05cm} n\hspace{0.05cm}\cdot \hspace{0.05cm}\omega_{\rm N}) \hspace{0.05cm}\cdot \hspace{0.05cm} t}$$
- By Fourier transform, we get the »spectrum of the analytical signal«:
- $$S_{\rm +}(f) = A_{\rm T} \cdot \sum_{n = - \infty}^{+\infty}{\rm J}_n (\eta) \cdot \delta \big[f - (f_{\rm T}+ n \cdot f_{\rm N})\big]\hspace{0.05cm}.$$
- The »spectrum of the physical signal« is obtained by expanding to negative frequencies taking into account a factor of $1/2$:
- $$S(f) = \frac{A_{\rm T} }{2} \cdot \sum_{n = - \infty}^{+\infty}{\rm J}_n (\eta) \cdot \delta \big[f \pm (f_{\rm T}+ n \cdot f_{\rm N})\big]\hspace{0.05cm}.$$
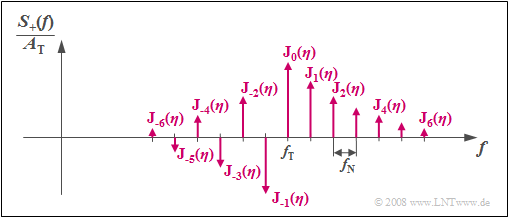
Based on the graph, the following statements can be made:
- The spectrum $S_+(f)$ of a phase-modulated sinusoidal signal consists of infinitely many discrete lines spaced at the frequency $f_{\rm N}$ of the sine signal. In principle, it is infinitely extended.
- The heights (weights) of the spectral lines at $f_{\rm T} + n · f_{\rm N}$ ($n$ is an integer) are determined by the modulation index $η$ via the Bessel functions ${\rm J}_n(η)$.
- The ${\rm J}_n(η)$ values show that in practice the spectrum is barely changed by bandlimiting. However, the resulting error grows as $η$ increases.
- The spectral lines are real for a sinusoidal source signal and cosinusoidal carrier and symmetric about $f_{\rm T}$ for even values of $n$ . When $n$ is odd, a sign change must be taken into account.
- The PM of an oscillation with a different phase of source and/or carrier signal yields the same magnitude spectrum and differs only with respect to the phase function.
If the source signal is composed of several oscillations, the spectrum calculation becomes difficult, namely:
»Convolution of the single spectra« $($see next section and "Exercise 3.3").
Phase modulation of the sum of two sinusoidal oscillations
If the source signal is composed of the sum of two sinusoidal oscillations, the signals at the output of the phase modulator are:
- $$s(t) = A_{\rm T} \cdot \cos \big[\omega_{\rm T} \cdot t + \eta_1 \cdot \sin (\omega_{\rm 1} \cdot t) + \eta_2 \cdot \sin(\omega_{\rm 2} \cdot t)\big]\hspace{0.05cm},$$
- $$s_{\rm TP}(t) = A_{\rm T} \cdot {\rm e}^{\hspace{0.05cm}{\rm j} \hspace{0.05cm}\cdot [\hspace{0.05cm}\eta_1 \hspace{0.05cm}\cdot \hspace{0.08cm}\sin (\omega_{\rm 1} \hspace{0.05cm}\cdot \hspace{0.05cm} t) \hspace{0.05cm}+ \hspace{0.05cm}\eta_2 \hspace{0.05cm}\cdot \hspace{0.08cm}\sin (\omega_{\rm 2} \hspace{0.05cm}\cdot \hspace{0.05cm}t)]}\hspace{0.05cm}.$$
- For ease of representation, we now set $A_{\rm T} = 1$ and get:
- $$s_{\rm TP}(t) = {\rm e}^{\hspace{0.05cm}{\rm j} \hspace{0.05cm}\cdot \hspace{0.05cm}\eta_1 \hspace{0.05cm}\cdot \hspace{0.08cm}\sin (\omega_{\rm 1} \hspace{0.05cm}\cdot \hspace{0.05cm} t) } \cdot {\rm e}^{\hspace{0.05cm}{\rm j} \hspace{0.05cm}\cdot \hspace{0.05cm}\eta_2 \hspace{0.05cm}\cdot \hspace{0.08cm}\sin (\omega_{\rm 2} \hspace{0.05cm}\cdot \hspace{0.05cm} t) }\hspace{0.05cm}.$$
- The spectral functions of the two terms are:
- $${\rm e}^{\hspace{0.05cm}{\rm j} \hspace{0.05cm}\cdot \hspace{0.05cm}\eta_1 \hspace{0.05cm}\cdot \hspace{0.08cm}\sin (2 \pi \hspace{0.05cm}\cdot \hspace{0.05cm}f_{\rm 1} \hspace{0.01cm}\cdot \hspace{0.05cm} t) } \hspace{0.2cm}\circ\!\!-\!\!\!-\!\!\!-\!\!\bullet\, \hspace{0.2cm} B_1(f) = \sum_{n = - \infty}^{+\infty}{\rm J}_n (\eta_1) \cdot \delta (f - n \cdot f_{\rm 1})\hspace{0.05cm},$$
- $${\rm e}^{\hspace{0.05cm}{\rm j} \hspace{0.05cm}\cdot \hspace{0.05cm}\eta_2 \hspace{0.05cm}\cdot \hspace{0.08cm}\sin (2 \pi \hspace{0.05cm}\cdot \hspace{0.05cm}f_{\rm 2} \hspace{0.01cm}\cdot \hspace{0.05cm} t) } \hspace{0.2cm}\circ\!\!-\!\!\!-\!\!\!-\!\!\bullet\, \hspace{0.2cm} B_2(f) = \sum_{n = - \infty}^{+\infty}{\rm J}_n (\eta_2) \cdot \delta (f - n \cdot f_{\rm 2})\hspace{0.05cm}.$$
- The Bessel functions $B_1(f)$ and $B_2(f)$ describe line spectra spaced in frequency at $f_1$ and $f_2$, whose weights are determined by $η_1$ and $η_2$.
- Due to multiplication in the time domain, the spectral function is given by the convolution:
- $$S_{\rm TP}(f) = B_1(f) \star B_2(f)= S_{\rm +}(f + f_{\rm T}) \hspace{0.05cm}.$$
$\rm Example\ 4\text{:}$ The left graph shows the Bessel function $B_1(f)$ for $η_1 = 0.64$ and $f_1 = 1 \ \rm kHz$. The much smaller lines at $f = ±2 \ \rm kHz$ with weights $0.05$ are left out for clarity.
- The function $B_2(f)$ is valid for the same modulation index $η_2 = η_1$, but at the signal frequency $f_2 = 4 \ \rm kHz$.
- The low-pass spectrum $S_{\rm TP}(f) = B_1(f) \star B_2(f)$ consists of nine Dirac delta lines and is sketched in the diagram on the right.
- By shifting the frequency $f_{\rm T}$ to the right, we obtain the spectrum $S_+(f)$ of the analytical signal $s_+(t)$. Thus:
- $$S_+(f = f_{\rm T}) = S_{\rm TP}(f = 0) = 0.81.$$
Exercises for the chapter
Exercise 3.1: Phase Modulation Locus Curve
Exercise 3.1Z: Influence of the Message Phase in Phase Modulation
Exercise 3.2: Spectrum with Angle Modulation
Exercise 3.2Z: Bessel Spectrum
Exercise 3.3: Sum of two Oscillations
Exercise 3.3Z: Characteristics Determination
Exercise 3.4: Simple Phase Modulator
References
- ↑ Bronstein, I.N.; Semendjajew, K.A.: Taschenbuch der Mathematik. 5. Auflage. Frankfurt: Harry Deutsch, 2001.
