Difference between revisions of "Linear and Time Invariant Systems/Linear Distortions"
| Line 97: | Line 97: | ||
{{GraueBox|TEXT= | {{GraueBox|TEXT= | ||
$\text{Example 2:}$ | $\text{Example 2:}$ | ||
| − | The graph shows the input signal (blue curve) | + | The graph shows the input signal (blue curve) |
:$$x(t) = {1\, \rm V} \cdot \cos(2 \pi \cdot {1\, \rm kHz}\cdot t) + {1\, \rm V} \cdot \sin(2 \pi \cdot {2\, \rm kHz}\cdot t)$$ | :$$x(t) = {1\, \rm V} \cdot \cos(2 \pi \cdot {1\, \rm kHz}\cdot t) + {1\, \rm V} \cdot \sin(2 \pi \cdot {2\, \rm kHz}\cdot t)$$ | ||
| − | + | which is periodic with $T_0 = 1\ \rm ms$ and the signal $y(t)$ which is attenuation-distorted with $α_1 = 0.2$, $α_2 = 0.5$ . | |
Man erkennt signifikante Auswirkungen dieser Dämpfungsverzerrungen: | Man erkennt signifikante Auswirkungen dieser Dämpfungsverzerrungen: | ||
Revision as of 01:34, 16 September 2021
Contents
Zusammenstellung wichtiger Beschreibungsgrößen
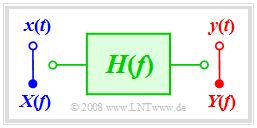
Now nonlinear distortions are excluded so that the system is fully described by the frequency response $H(f)$ .
The generally complex frequency response can also be formulated as follows:
- $$H(f) = |H(f)| \cdot {\rm e}^{-{\rm j} \hspace{0.05cm} \cdot \hspace{0.05cm} b(f)} = {\rm e}^{-a(f)}\cdot {\rm e}^{-{\rm j} \hspace{0.05cm} \cdot \hspace{0.05cm} b(f)}.$$
This yields the following descriptive quantities:
- The magnitude $|H(f)|$ is referred to as amplitude response and in logarithmic form as attenuation curve :
- $$a(f) = - \ln |H(f)|\hspace{0.2cm}{\rm in \hspace{0.1cm}Neper \hspace{0.1cm}(Np) } = - 20 \cdot \lg |H(f)|\hspace{0.2cm}{\rm in \hspace{0.1cm}Dezibel \hspace{0.1cm}(dB) }.$$
- The phase response $b(f)$ specifies the negative angle of $H(f)$ dependent on $f$ in the complex plane and with respect to the real axis:
- $$b(f) = - {\rm arc} \hspace{0.1cm}H(f) \hspace{0.2cm}{\rm in \hspace{0.1cm}Radian \hspace{0.1cm}(rad)}.$$
Voraussetzungen für verzerrungsfreie Systeme
According to the explanations in the chapter Classification of the Distortions there is a distortion-free system at hand if and only if all frequency components are uniformly damped and delayed:
- $$y(t) = \alpha \cdot x(t - \tau).$$
According to the laws of system theory, the following must thus hold for the frequency response
- $$H(f) = \alpha \cdot {\rm e}^{-{\rm j}\hspace{0.04cm}2 \pi f \tau}$$
or expressed with functions $a(f)$ and $b(f)$:
- The attenuation curve must be constant for all frequencies contained in the input signal:
- $$a(f) = - \ln |H(f)| = - \ln \ \alpha = {\rm const.}$$
- The phase response must either be zero in the region of interest (system with no transit time) or increase linearly with frequency $(τ$ indicats the transit time of the system):
- $$b(f) = 2 \pi f \tau = {\rm const.} \cdot f.$$
$\text{Definitionen:}$ For a distortion-free system, both requirements must be satisfied simultaneously. Violation of even one of these two conditions results in linear distortions which are distinguished according to their cause.
- It comes to attenuation distortions if in the frequency range of interest the attenuation curve is not constant:
- $$a(f) \ne {\rm const.}$$
- In contrast to this, there are phase distortions if the phase function is not linear with respect to $f$ :
- $$b(f) \ne {\rm const.} \cdot f.$$
It should be noted that in all realisable systems – in particular, in the "minimum-phase systems" described in Chapter 3 – both forms of distortion usually occur simultaneously.
$\text{Definition:}$ In the time domain, the condition for a distortion-free system is:
- $$h(t) = \alpha \cdot \delta(t - \tau),\hspace{0.4cm}\alpha \ne 0.$$
Moreover, if $α = 1$ and $τ = 0$ hold,then there is an ideal transmission system . In contrast, there are linear distortions whenever
- $h(t)$ is a continuous-time function or
- $h(t)$ is composed of more than one Dirac function.
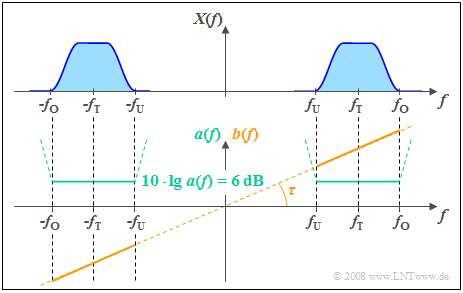
$\text{Example 1:}$ The following sketch shows the attenuation curve $a(f)$ and the phase response $b(f)$ of a distortion-free system.
- In a range from $f_{\rm U}$ to $f_{\rm O}$ around the carrier frequency $f_{\rm T}$, in which the signal $x(t)$ has components, $a(f)$ is constant.
- From the given constant attenuation value $6 \ \rm dB$ it follows for the amplitude response: $\vert H(f)\vert = 0.5$.
- The output spectrum $Y(f)$ is thus half as large in magnitude as the spectral components $X(f)$ of the input signal.
- The phase response $b(f)$ increases linearly with frequency between $f_{\rm U}$ und $f_{\rm O}$.
- This results in all frequency components being delayed by the same phase delay time $τ$ where $τ$ is fixed by the slope of $b(f)$ .
- With $b(f) = 0$ a transit time-free system would arise as a result ⇒ $τ = 0$.
Furthermore, the following generally valid properties can be identified from the graph:
- The attenuation curve $a(f) = a(\hspace{-0.01cm}-\hspace{-0.08cm} f)$ is an even function in $f$.
- The phase curve $b(f) = \hspace{-0.01cm}–\hspace{-0.01cm} b(\hspace{-0.01cm}-\hspace{-0.01cm}f)$ is an odd function in $f$.
Outside the frequency band occupied by $x(t)$ the "constant attenuation" and "linear phase" conditions do not need to be satisfied. It can be seen from the dashed curve of $a(f)$ that even a much higher attenuation is purposeful here because as a consequence the always-existing noise components outside the useful bandwidth – which are not considered in this section – are suppressed better.
Dämpfungsverzerrungen
In the following, we consider the sum of two harmonic oscillations as input signal:
- $$x(t) = A_1 \cdot \cos(2 \pi f_1 \cdot t - \varphi_1) + A_2 \cdot \cos(2 \pi f_2 \cdot t - \varphi_2).$$
If the output signal can be represented in the form
- $$y(t) = \alpha_1 \cdot A_1 \cdot \cos(2 \pi f_1 \cdot t - \varphi_1) + \alpha_2 \cdot A_2 \cdot \cos(2 \pi f_2 \cdot t - \varphi_2).$$
and at the same time $α_1 ≠ α_2$ is valid, then exclusively attenuation distortions are existent since the phase values $\varphi_1$ and $\varphi_2$ are not changed by the system.
The attenuation constants $α_1$ and $α_2$ can be determined from the amplitude response $|H(f)|$ :
- $$\alpha_1 = |H(f_1)|,\hspace{0.4cm}\alpha_2 = |H(f_2)|.$$
If the attenuation curve $a(f)$ is given in Neper, then likewise the following holds $(1 \ \rm dB$ corresponds to $0.1151 \ \rm Np)$:
- $$ \alpha_1 = {\rm e}^{-{\rm a}(f_1)},\hspace{0.4cm}\alpha_2 = {\rm e}^{-{\rm a}(f_2)}.$$
Please note: In some character fonts, "$a$" and "$α$" (alpha) are difficult to distinguish.
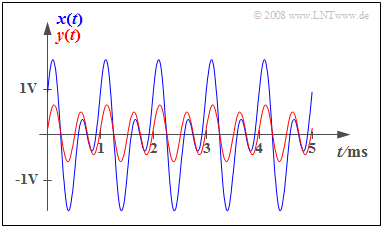
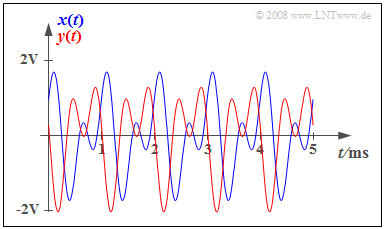
$\text{Example 2:}$ The graph shows the input signal (blue curve)
- $$x(t) = {1\, \rm V} \cdot \cos(2 \pi \cdot {1\, \rm kHz}\cdot t) + {1\, \rm V} \cdot \sin(2 \pi \cdot {2\, \rm kHz}\cdot t)$$
which is periodic with $T_0 = 1\ \rm ms$ and the signal $y(t)$ which is attenuation-distorted with $α_1 = 0.2$, $α_2 = 0.5$ .
Man erkennt signifikante Auswirkungen dieser Dämpfungsverzerrungen:
- $y(t)$ hat nur noch wenig Ähnlichkeit mit $x(t)$.
- Dagegen würde sich mit $α_1 = α_2 = α$ das verzerrungsfreie Signal $y(t) = α · x(t)$ ergeben, aus dem man durch Verstärkung um $1/α$ das ursprüngliche Signal $x(t)$ wieder rekonstruieren könnte.
We refer here explicitly to the interactive applet Linear distortions of periodic signals.
Phasenlaufzeit
Wir betrachten ein System mit $|H(f)| = 1$, so dass für den Frequenzgang gilt:
- $$H(f) = {\rm e}^{-{\rm j} \hspace{0.05cm} \cdot \hspace{0.05cm} b(f)}.$$
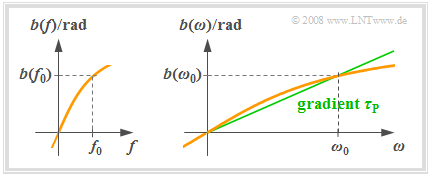
- Die linke Grafik zeigt einen beispielhaften Phasenverlauf $b(f)$. Ein solcher Phasenverlauf ist stets eine ungerade Funktion bezüglich der Frequenz $f$: $b(\hspace{-0.01cm}-\hspace{-0.08cm}f) = \hspace{0.08cm}-b(f)$.
- Rechts ist die Funktion $b(ω)$ skizziert, die gegenüber $b(f)$ in der Abszisse um den Faktor $2π$ gestreckt ist.
Liegt am Eingang die harmonische Schwingung
- $$x(t) = C \cdot \cos(2 \pi f_0 t - \varphi) \circ\!\!-\!\!\!-\!\!\!-\!\!\bullet\, X(f ) = {C}/{2}\cdot {\rm e}^{{\rm j}\hspace{0.05cm} \cdot \hspace{0.05cm} \varphi} \cdot \delta(f + f_0) \hspace{0.01cm} + \hspace{0.01cm}{C}/{2}\cdot {\rm e}^{-{\rm j}\hspace{0.05cm} \cdot \hspace{0.05cm} \varphi} \cdot \delta(f - f_0)$$
an, so ergibt sich für die Spektralfunktion am Ausgang:
- $$Y(f ) = {C}/{2}\cdot {\rm e}^{{\rm j}\hspace{0.05cm} \cdot \hspace{0.05cm} \varphi} \cdot {\rm e}^{\hspace{0.05cm}{\rm j}\hspace{0.05cm} \cdot \hspace{0.05cm} b(f_0)} \cdot \delta(f + f_0) \hspace{0.05cm} + \hspace{0.05cm}{C}/{2}\cdot {\rm e}^{-{\rm j}\hspace{0.05cm} \cdot \hspace{0.05cm} \varphi}\cdot {\rm e}^{-{\rm j}\hspace{0.05cm} \cdot \hspace{0.05cm} b(f_0)} \cdot \delta(f - f_0).$$
Somit lautet das Ausgangssignal:
- $$y(t) = C \cdot \cos(2 \pi f_0 t - b(f_0) - \varphi).$$
Dieses Signal kann auch in folgender Form dargestellt werden:
- $$y(t) = C \cdot \cos(2 \pi f_0 ( t - \tau_{\rm P}(f_0)) - \varphi).$$
$\text{Definition:}$ Die Phasenlaufzeit gibt die Verzögerung an, die eine harmonische Schwingung mit der Frequenz $f_0$ durch das System erfährt. Bei phasenverzerrenden Systemen ist die Phasenlaufzeit frequenzabhängig:
- $$\tau_{\rm P}(f_0) = \frac{b(f_0)}{2\pi f_0} \hspace{0.4cm}{\rm bzw.} \hspace{0.4cm} \tau_{\rm P}(\omega_0) = \frac{b(\omega_0)}{\omega_0}.$$
Zu dieser Definition ist anzumerken:
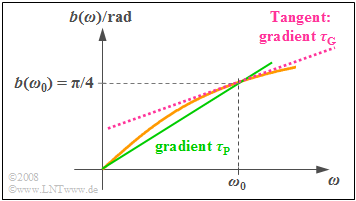
- In der $b(ω)$–Darstellung kann die Phasenlaufzeit $τ_{\rm P}$ als die Steigung der in der obigen Grafik grün eingezeichneten Geraden auch grafisch ermittelt werden.
- Im Allgemeinen wird eine Schwingung mit anderer Frequenz auch eine andere Phasenlaufzeit zur Folge haben. Dies ist der physikalische Hintergrund für Phasenverzerrungen.
- Gilt bei einem System $b(ω) = τ_{\rm P} · ω$ bzw. $b(f) = 2π · τ_{\rm P} · f$, so haben alle Frequenzen die gleiche Phasenlaufzeit $τ_{\rm P}$. Ein solches System führt nicht zu Phasenverzerrungen.
Wir verweisen hier nochmals auf das interaktive Applet Lineare Verzerrungen periodischer Signale.
Unterschied zwischen Phasen- und Gruppenlaufzeit
Eine weitere wichtige Systembeschreibungsgröße ist die Gruppenlaufzeit, die nicht mit der Phasenlaufzeit verwechselt werden darf.
$\text{Definition:}$ Die Gruppenlaufzeit ist wie folgt definiert:
- $$\tau_{\rm G}(\omega_0) = \left[ \frac{ {\rm d}b(\omega)}{ {\rm d}\omega}\right ]_{\omega = \omega_0}.$$
- Diese Größe wird vorwiegend zur Beschreibung von Schmalbandsystemen herangezogen.
- Sie gibt die Verzögerung an, welche die Hüllkurve eines Bandpass-Systems erfährt.
$\text{Beispiel 3:}$ Die Grafik zeigt die beispielhafte Phasenfunktion:
- $$b(ω) = \arctan (ω/ω_0).$$
- Diese steigt monoton von Null $($bei $ω = 0)$ bis $π/2$ $($für $ω → ∞)$.
- Der Funktionswert bei $ω = ω_0$ beträgt $π/4$.
Setzen wir $ω_0 = 2π · 1 \ \rm kHz$, so erhalten wir für die Phasenlaufzeit:
- $$\tau_{\rm P}(\omega_0) = \frac{b(\omega_0)}{\omega_0}= \frac{\pi / 4}{2 \pi \cdot{1\, \rm kHz} } = {125\, \rm µ s}.$$
Diese Größe entspricht der Steigung der grün eingezeichneten Geraden in obiger Grafik.
Dagegen kennzeichnet die geringere Steigung der rot dargestellten Tangente die Gruppenlaufzeit:
- $$\tau_{\rm G}(\omega_0) = \left[ \frac{ {\rm d}b(\omega)}{ {\rm d}\omega}\right ]_{\omega = \omega_0} = \left[ \frac{1}{\omega_0} \cdot \frac{1}{1 + \left(\omega / \omega_0\right]^2} \right ]_{\omega = \omega_0} = \frac{1}{2\omega_0}= \frac{1}{4 \pi \cdot{1\, \rm kHz} } \approx {80\, \rm µ s}.$$
Phasenverzerrungen
Zur Verdeutlichung dieses Sachverhaltes betrachten wir als Eingangssignal wieder die Summe zweier harmonischer Schwingungen:
- $$x(t) = A_1 \cdot \cos(2 \pi f_1 \cdot t - \varphi_1) + A_2 \cdot \cos(2 \pi f_2 \cdot t - \varphi_2).$$
Ist bei diesem Eingangssignal das Ausgangssignal in der Form
- $$y(t) = A_1 \cdot \cos(2 \pi f_1 \cdot (t - \tau_1) - \varphi_1) + A_2 \cdot \cos(2 \pi f_2 \cdot (t - \tau_2) - \varphi_2)$$
darstellbar und gilt gleichzeitig $τ_1 ≠ τ_2$, so liegen ausschließlich Phasenverzerrungen vor.
Die beiden Phasenlaufzeiten $τ_1 ≠ τ_2$ können aus dem Phasenverlauf (in Radian) ermittelt werden:
- $$\tau_1 = \frac{b(f_1)}{2\pi f_1} , \hspace{0.4cm}\tau_2 = \frac{b(f_2)}{2\pi f_2}.$$
$\text{Beispiel 4:}$ Die Grafik zeigt als blauen Kurvenverlauf das mit der Periodendauer $T_0$ periodische Signal
- $$x(t) = {1\, \rm V} \cdot \cos(2 \pi \cdot {1\, \rm kHz}\cdot t) + {1\, \rm V} \cdot \sin(2 \pi \cdot {2\, \rm kHz}\cdot t)$$
sowie das mit den Laufzeiten $τ_1 = 0.7 \ \rm ms$ und $τ_2 = 0.3 \ \rm ms$ phasenverzerrte Signal $y(t)$ ⇒ rote Kurve.
- Man erkennt deutlich die Auswirkungen der Phasenverzerrungen.
- Mit $τ_1 = τ_2 = τ$ ergäbe sich das verzerrungsfreie Signal
- $$y(t) = x(t - τ).$$
Wir weisen nochmals auf das interaktive Applet Lineare Verzerrungen periodischer Signale hin.
Entzerrungsverfahren
Dieses für die Nachrichtentechnik sehr wichtige Verfahren soll hier nur kurz angerissen werden. Nähere Informationen hierzu finden Sie in den Büchern Modulationsverfahren und Digitalsignalübertragung.
Wir gehen für diese Kurzbeschreibung von der skizzierten Konstellation aus:
- $S_{\rm V}$ bezeichnet ein verzerrendes System,
- während $S_{\rm E}$ der Entzerrung dient.
Zu dieser Konstellation ist anzumerken:
- Ist die Verzerrung nichtlinear, so muss auch die Entzerrung nichtlinear erfolgen.
- Aber auch bei linearen Verzerrungen werden nichtlineare Entzerrungsverfahren eingesetzt, zum Beispiel Decision Feedback Equalization bei Digitalsystemen. Der Vorteil gegenüber linearer Entzerrung ist, dass es nicht zu einer Erhöhung der Rauschleistung kommt.
- Ist $S_{\rm V}$ ein lineares System mit Frequenzgang $H_{\rm V}(f)$, so können mit dem inversen Frequenzgang $H_{\rm E}(f) = 1/H_{\rm V}(f)$ die Verzerrungen vollständig eliminiert werden, und es gilt $z(t) = x(t)$.
- Voraussetzung hierfür ist allerdings, dass der Frequenzgang $H_{\rm V}(f)$ im interessierenden Spektralbereich keine Nullstellen besitzt, da sonst bei $H_{\rm E}(f)$ Unendlichkeitsstellen erforderlich wären.
- Bei Analogsystemen bedeutet eine vollständige Entzerrung, dass sich $z(t)$ von $x(t)$ nur durch die unvermeidbaren Rauschanteile unterscheidet, und eventuell durch eine Laufzeit.
- Bei Digitalsystemen ist das Kriterium für eine vollständige Entzerrung weniger streng. Es muss dann nur sichergestellt werden, dass die Signale $x(t)$ und $z(t)$ zu den Detektionszeitpunkten übereinstimmen. Man spricht in diesem Zusammenhang von Nyquistsystemen.
Aufgaben zum Kapitel
Aufgabe 2.5: Verzerrung und Entzerrung
Aufgabe 2.5Z: Nyquistentzerrung
Aufgabe 2.6Z: Synchrondemodulator
Aufgabe 2.7: Nochmals Zweiwegekanal
