Contents
Ideal channel equalizer
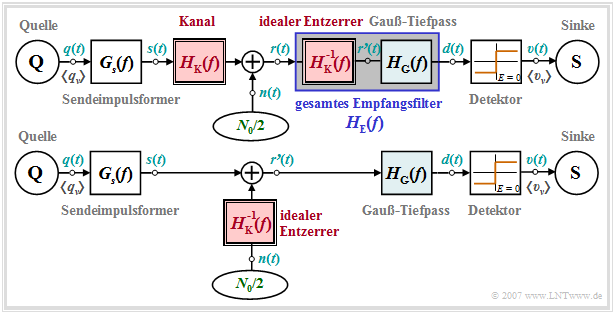
For a transmission system whose channel frequency response $H_{\rm K}(f)$ causes severe distortion, we assume the following block diagram (upper graph) and equivalent circuit (lower graph).
To these representations the following is to be noted:
- The receiver filter $H_{\rm E}(f)$ is – at least mentally – composed of an ideal equalizer $1/H_{\rm K}(f)$ and a low-pass filter $H_{\rm G}(f)$. For the latter we use in this chapter exemplarily a Gaussian low-pass with the cutoff frequency $f_{\rm G}$.
- If we now move the ideal equalizer – again purely mentally – to the left side of the noise addition point, nothing changes with respect to the S/N ratio at the sink and with respect to the error probability compared to the block diagram drawn above.
- From the equivalent circuit below it can be seen that the channel frequency response $H_{\rm K}(f)$ does not change anything with respect to the signal component of the detection signal $d_{\rm S}(t)$ – originating from the transmitted signal $s(t)$ – if it is fully compensated with $1/H_{\rm K}(f)$. Thus, the signal component has exactly the same shape as calculated in the chapter Error Probability with Intersymbol Interference.
- The degradation due to the channel frequency response $H_{\rm K}(f)$ is rather shown by a significant increase of the detection noise power, i.e. the variance of the signal $d_{\rm N}(t)$ – originating from the noise signal $n(t)$:
- $$\sigma_d^2 = \frac{N_0}{2} \cdot \int_{-\infty}^{+\infty} |H_{\rm E}(f)|^2 \,{\rm d} f = \frac{N_0}{2} \cdot \int_{-\infty}^{+\infty} \frac{1}{|H_{\rm K}(f)|^2}\cdot |H_{\rm G}(f)|^2 \,{\rm d} f \hspace{0.05cm}.$$
- The prerequisite for a finite noise power $\sigma_d^2$ is that the low-pass $H_{\rm G}(f)$ attenuates the noise $n(t)$ at (very) high frequencies more than it is raised by the ideal equalizer $1/H_{\rm K}(f)$.
Note: The channel frequency response $H_{\rm K}(f)$ can be equalized according to magnitude and phase, but only in a limited frequency range given by $H_{\rm G}(f)$. However, a complete phase equalization is only possible at the expense of a (frequency-independent) running time, which will not be considered further in the following.
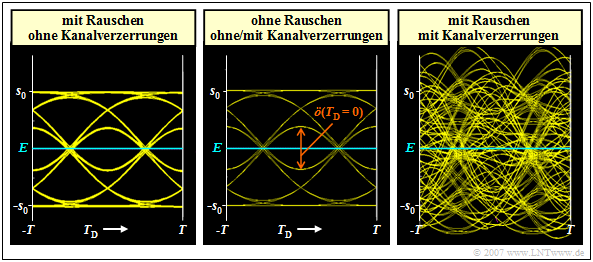
$\text{Example 1:}$ We consider again a binary system with NRZ rectangular pulses and Gaussian receiver filter $H_{\rm E}(f) = H_{\rm G}(f)$ with (normalized) cutoff frequency $f_\text{G, opt} \cdot T = 0.4$.
- The middle graph shows the eye diagram of the signal component of the detection signal $d_{\rm S}(t)$ for this case – i.e. without taking the noise into account.
- This is identical with the eye diagram shown in the chapter Definition and statements of the eye diagram in $\text{example 3}$ (right diagram).
The left eye diagram is obtained for ideal channel, i.e., for $H_{\rm K}(f) = 1$ ⇒ $1/H_{\rm K}(f) = 1$. It takes into account the AWGN noise, but here it was assumed to be very small, $10 \cdot {\rm lg}\hspace{0.1cm} E_{\rm B}/N_0 = 30 \ \rm dB$. For this configuration, it was determined by simulation:
- $$10 \cdot {\rm lg}\hspace{0.1cm}\rho_{\rm U}\approx 26.8\,{\rm dB} \hspace{0.3cm}\Rightarrow \hspace{0.3cm} p_{\rm U}< 10^{-40}\hspace{0.05cm}.$$
In contrast, the right diagram applies to a coaxial cable, where the characteristic cable attenuation $a_\star = 40 \ \rm dB$. This results in significantly worse system sizes for the same $E_{\rm B}/N_0$:
- $$10 \cdot {\rm lg}\hspace{0.1cm}\rho_{\rm U}\approx -4.6\,{\rm dB} \hspace{0.3cm}\Rightarrow \hspace{0.3cm} p_{\rm U}\approx 0.28\hspace{0.05cm}.$$
This result can be interpreted as follows:
- Assuming an ideal channel equalizer $1/H_{\rm K}(f)$, the same "eye diagram without noise" (left graph) results for the distorting channel as for the ideal channel $H_{\rm K}(f) = 1$ (middle graph).
- Channel equalization $1/H_{\rm K}(f)$ extremely amplifies the noise component. In the right-hand example, equally strong equalization is required over a wide frequency range because of the strong distortion.
- The noise power $\sigma_d^2$ here is larger by a factor of $1300$ than in the left constellation (no distortion ⇒ no equalization). Thus, the error probability results in $p_{\rm S}\approx p_{\rm U}\approx 50 \%$.
- An acceptable error probability results only with smaller noise power density $N_0$. For example, with $10 \cdot {\rm lg}\hspace{0.1cm} E_{\rm B}/N_0 = 50 \ \rm dB$ $($instead of $30 \ \rm dB)$ the following result is obtained:
- $$10 \cdot {\rm lg}\hspace{0.1cm}\rho_{\rm U} = -4.6 +20 \approx 15.4\,{\rm dB} \hspace{0.3cm}\Rightarrow \hspace{0.3cm} p_{\rm U}\approx 2 \cdot 10^{-9} \hspace{0.3cm}\Rightarrow \hspace{0.3cm} p_{\rm S} \ge p_{\rm U}/4 \approx 0.5 \cdot 10^{-9}\hspace{0.05cm}.$$
Increase of the noise power by linear equalization
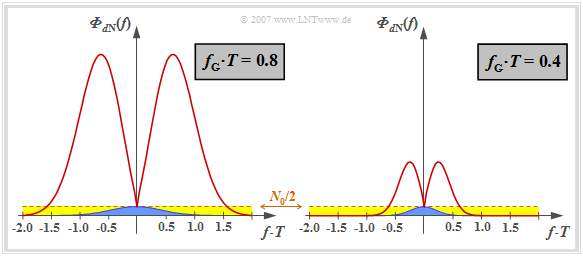
The eye diagrams on the last section impressively document the increase of the noise power $\sigma_d^2$ with unchanged vertical eye opening, if one compensates the channel frequency response $H_{\rm K}(f)$ on the receiving side by its inverse. This result shall now be interpreted in terms of the noise power density ${\it \Phi}_{d{\rm N}}(f)$ after the receiver filter (before the decision), with the following settings:
- Let the channel be a coaxial cable with the magnitude frequency response
- $$|H_{\rm K}(f)| = {\rm exp}\left [- a_{\star}\cdot \sqrt{2 f T}\hspace{0.05cm} \right ]\hspace{0.2cm}{\rm with}\hspace{0.2cm} a_{\star} = 1.7\,\,{\rm Np}\hspace{0.2cm} ({\rm corresponding to} \hspace{0.2cm} 15\,\,{\rm dB}) \hspace{0.05cm}.$$
- The ideal channel equalizer $1/H_{\rm K}(f)$ compensates the channel frequency response completely. No statement is made here about the realization of the attenuation and phase equalization.
- For noise power limitation a Gaussian low-pass filter is used:
- $$|H_{\rm G}(f)| = {\rm exp}\left [- \pi \cdot \left (\frac{f }{2 f_{\rm G}}\right )^2 \right ]\hspace{0.2cm}{\rm with}\hspace{0.2cm} f_{\rm G} = 0.8/T \hspace{0.2cm} {\rm and} \hspace{0.2cm} f_{\rm G} = 0.4/T \hspace{0.05cm}.$$
Thus, the noise power density before the decision is:
- $${\it \Phi}_{d{\rm N}}(f) = \frac{N_0}{2} \cdot \frac{|H_{\rm G }(f)|^2}{|H_{\rm K}(f)|^2} = \frac{N_0}{2} \cdot {\rm exp}\left [2 \cdot a_{\star}\cdot \sqrt{2 f T} - {\pi}/{2} \cdot \left ({f }/{f_{\rm G}}\right )^2 \right ] \hspace{0.05cm}.$$
This curve is shown on the left for the two (normalized) cutoff frequencies
- $f_\text{G} \cdot T = 0.8$ (left) and
- $f_\text{G} \cdot T = 0.4$ (right)
Note that here, for reasons of presentation, the characteristic cable attenuation of $a_\star = 15 \ \rm dB$ $($corresponding to $1.7 \ \rm Np)$ is chosen to be significantly smaller than in the right eye diagram in $\text{Example 1}$ in the last section $($valid for $a_\star = 40 \ \rm dB)$.
Let us first consider the left graph for the (normalized) cutoff frequency $f_\text{G} \cdot T = 0.8$ which, according to the calculations in the last chapter represents the optimum for the ideal channel ⇒ $H_{\rm K}(f) = 1$.
- The constant noise power density $N_0/2$ at the receiver input is highlighted in yellow. With an ideal channel, this is limited by the Gaussian receive filter $H_{\rm E}(f) = H_{\rm G}(f)$ and results in the detection noise power $\sigma_d^2$ (indicated by the blue area in the graph).
- If – as usual for conducted transmission üblich – higher frequencies are strongly attenuated, $|H_{\rm E}(f)| = |H_{\rm G}(f)|/|H_{\rm K}(f)|$ increases very strongly due to the ideal channel equalizer before the attenuating influence of the Gaussian filter becomes effective for $f \cdot T \ge 0.6$ $($only valid for $a_\star = 15 \ \rm dB$ and $f_\text{G} \cdot T = 0.8)$.
- The noise power $\sigma_d^2$ is now equal to the area under the red curve, which is about a factor of $28$ larger than the blue area. The effects of these different noise powers can also be seen in the eye diagrams on the last section, but for $a_\star = 40 \ \rm dB$.
The right graph shows the noise power density ${\it \Phi}_{d{\rm N}}(f)$ for the normalized cutoff frequency $f_\text{G} \cdot T = 0.4$. Here the noise power is only increased by a factor of $9$ by the ideal channel equalizer (ratio between the area under the red curve and the blue area).
$\text{Conclusion:}$ From the above graph and the previous explanations it is already clear that with distorting channel ⇒ $H_{\rm K}(f) \ne 1$ the cutoff frequency $f_\text{G} \cdot T = 0.8$ of the Gaussian low-pass filter $H_{\rm G}(f)$ will no longer be optimal after the ideal channel equalizer $1/H_{\rm K}(f)$.
Optimization of the cutoff frequency
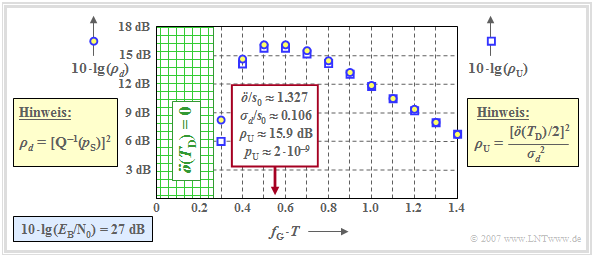
Die Grafik zeigt die Störabstände in Abhängigkeit der Grenzfrequenz $f_{\rm G}$ des gaußförmigen Gesamtfrequenzgangs $H_{\rm G}(f) = H_{\rm K}(f) \cdot H_{\rm E}(f)$. Dieses Bild gilt für
- einen koaxialen Übertragungskanal mit der charakteristischen Kabeldämpfung $a_\star = 15 \ \rm dB$,
- AWGN–Rauschen mit $10 \cdot {\rm lg}\hspace{0.1cm} E_{\rm B}/N_0 = 27 \ \rm dB$, wobei $E_{\rm B} = s_0^2 \cdot T$ zu setzen ist ⇒ NRZ–Rechteckimpulse.
Anmerkungen:
- Die Kreise zeigen die dB–Werte für $10 \cdot {\rm lg}\hspace{0.1cm} \rho_d$ ⇒ "mittleres" Detektions–SNR (Maß für die mittlere Fehlerwahrscheinlichkeit $p_{\rm S})$.
- Die Quadrate zeigen die dB–Werte für $10 \cdot {\rm lg}\hspace{0.1cm} \rho_{\rm U}$ ⇒ "ungünstigstes" SNR $($Maß für die ungünstigste Fehlerwahrscheinlichkeit $p_{\rm U})$.
Man erkennt aus dieser Darstellung und durch Vergleich mit der entsprechenden Grafik im letzten Kapitel, die für $H_{\rm K}(f) = 1$ und $10 \cdot {\rm lg}\hspace{0.1cm} E_{\rm B}/N_0 = 13 \ \rm dB$ gegolten hat:
- Auch bei stark verzerrendem Kanal ist $\rho_{\rm U}$ eine geeignete untere Schranke für $\rho_d$ ⇒ $\rho_{d} \ge \rho_{\rm U}$. Entsprechend ist auch $p_{\rm U} \ge p_{\rm S} $ eine sinnvolle obere Schranke für $p_{\rm S}$.
- Bei der betrachteten Kabeldämpfung $a_\star = 15 \ \rm dB$ ist die Grenzfrequenz $f_\text{G} \cdot T \approx 0.55$ optimal und es gilt $\ddot{o}/s_0 \approx 1.327$ sowie $\sigma_d/s_0 \approx 0.106$.
- Daraus ergeben sich der (ungünstigste) Störabstand $10 \cdot {\rm lg}\hspace{0.1cm} \rho_{\rm U} \approx \ \rm 15.9 \ dB$ und die Worst–Case–Fehlerwahrscheinlichkeit $p_{\rm U} \approx 2 \cdot 10^{-9}.$
- Eine kleinere Grenzfrequenz hätte eine deutlich kleinere Augenöffnung zur Folge, ohne dass dadurch auch $\sigma_d$ gleichermaßen verkleinert würde. Für $f_\text{G} \cdot T = 0.4$ gilt:
- $$\ddot{o}/s_0 \approx 0.735,\hspace{0.2cm}\sigma_d/s_0 \approx 0.072\hspace{0.3cm}\Rightarrow \hspace{0.3cm} 10 \cdot {\rm lg}\hspace{0.1cm}\rho_{\rm U}\approx 14.1\,{\rm dB} \hspace{0.3cm}\Rightarrow \hspace{0.3cm} p_{\rm U}\approx 1.8 \cdot 10^{-7}\hspace{0.05cm}.$$
- Ist die Grenzfrequenz $f_\text{G}$ zu groß, so wird das Rauschen weniger effektiv begrenzt. Beispielsweise lauten die Werte für die Grenzfrequenz $f_\text{G} \cdot T =0.8$:
- $$\ddot{o}/s_0 \approx 1.819,\hspace{0.2cm}\sigma_d/s_0 \approx 0.178\hspace{0.3cm}\Rightarrow \hspace{0.3cm} 10 \cdot {\rm lg}\hspace{0.1cm}\rho_{\rm U}\approx 14.2\,{\rm dB} \hspace{0.3cm}\Rightarrow \hspace{0.3cm} p_{\rm U}\approx 1.7 \cdot 10^{-7}\hspace{0.05cm}.$$
- Die optimalen Werte sind mit $10 \cdot {\rm lg}\hspace{0.1cm} \rho_{d} \approx 16.2 \ \rm dB$ und $10 \cdot {\rm lg}\hspace{0.1cm} \rho_{\rm U} \approx \ \rm 15.9 dB$ deutlich ausgeprägter als bei idealem Kanal.
Bei einem Vergleich der Störabstände ist allerdings zu berücksichtigen, dass hier $10 \cdot {\rm lg}\hspace{0.1cm} E_{\rm B}/N_0 = 27 \ \rm dB$ zugrunde liegt; in der entsprechenden Grafik für den idealen Kanal wurde dagegen von $10 \cdot {\rm lg}\hspace{0.1cm} E_{\rm B}/N_0 = 13 \ \rm dB$ ausgegangen.
Optimale Grenzfrequenz in Abhängigkeit der Kabeldämpfung
Wir betrachten weiter
- ein Binärsystem mit NRZ–Sendeimpulsen ⇒ $E_{\rm B} = s_0^2 \cdot T$,
- ein Koaxialkabel $H_{\rm K}(f)$, charakteristische Dämpfung $a_\star$,
- einen Gauß–Gesamtfrequenzgang $H_{\rm G}(f) = H_{\rm K}(f) \cdot H_{\rm E}(f)$.
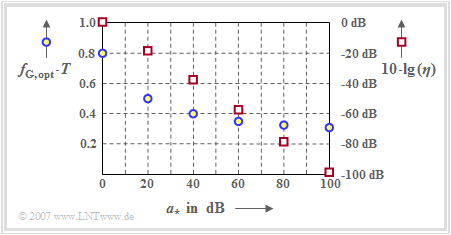
Die blauen Kreise (linke Achsenbeschriftung) markieren die optimale Grenzfrequenzen $f_\text{G, opt}$ für die jeweilige Kabeldämpfung $a_\star$.
Zusätzlich ist in der Grafik mit roten Quadraten der Systemwirkungsgrad (bei Spitzenwertbegrenzung) $\eta$ dargestellt, der das Verhältnis des mit der betrachteten Konfiguration erreichbaren SNR $\rho_{d}$ zum maximal möglichen S/N-Verhältnis $\rho_{d, \ {\rm max}}$ angibt.
Ersetzt man $\rho_d$ durch $\rho_{\rm U}$, also $p_{\rm S}$ durch $p_{\rm U}$, so kann der Systemwirkungsgrad wie folgt dargestellt werden:
- $$\eta = \eta_{\rm A}=\frac{\rho_d}{\rho_{d, \hspace{0.05cm}{\rm max \hspace{0.05cm}|\hspace{0.05cm} A}}}= \frac{\rho_d}{2 \cdot E_{\rm B}/N_0}\approx \frac{\rho_{\rm U}}{2 \cdot E_{\rm B}/N_0}.$$
Man erkennt aus der Anordnung der blauen Kreise:
- Die optimale Grenzfrequenz $f_\text{G, opt}$ hängt signifikant ab von der Stärke der Verzerrungen des Koaxialkabels, genauer gesagt: ausschließlich von der charakteristischen Kabeldämpfung $a_\star$ bei der halben Bitrate.
- Je größer die Kabeldämpfung $a_\star$ und damit der Rauscheinfluss ist, um so niedriger ist die optimale Grenzfrequenz $f_\text{G, opt}$.
- Allerdings ist stets $f_\text{G, opt} > 0.27/T$. Andernfalls wäre das Auge geschlossen, gleichbedeutend mit der "Worst–case"–Fehlerwahrscheinlichkeit $p_{\rm U} = 0.5$.
Diskutieren wir nun die Abhängigkeit des Systemwirkungsgrads $\eta$ (rote Quadrate) von der charakteristischen Kabeldämpfung $a_\star$. Die rechte Ordinate beginnt oben bei $0 \ \rm dB$ und erstreckt sich nach unten bis $-100 \ \rm dB$.
Wie nun an einigen Zahlenbeispielen verdeutlicht werden soll, vermeidet die Darstellung $\eta = \eta\hspace{0.05cm}(a_\star)$ einige Probleme, die sich aus dem großen Wertebereich von S/N–Verhältnissen ergeben:
- Der Ordinatenwert $10 \cdot {\rm lg}\hspace{0.1cm} \eta\hspace{0.05cm}(a_\star = 0 \ \rm dB) = -1.4 \ \rm dB$ sagt aus, dass der bei idealem Kanal bestmögliche Gaußtiefpass mit Grenzfrequenz $f_\text{G} \cdot T = 0.8$ um $1.4 \ \rm dB$ schlechter ist als der optimale (Matched–Filter–) Empfänger.
- Gehen wir von idealem Kanal $(a_\star = 0 \ \rm dB)$ und $10 \cdot {\rm lg}\hspace{0.1cm} E_{\rm B}/N_0 = 10 \ \rm dB$ aus, so besagt die obige Gleichung auch, dass diese Konfiguration zu folgender (worst-case) Fehlerwahrscheinlichkeit führen wird:
- $$10 \cdot {\rm lg}\hspace{0.1cm}\rho_{\rm U} = 10 \cdot {\rm lg}\hspace{0.1cm}{E_{\rm B}}/{N_0} + 10 \cdot {\rm lg}\hspace{0.1cm}(2) + 10 \cdot {\rm lg}\hspace{0.1cm}(\eta) \approx \approx 10\,{\rm dB} \hspace{0.1cm}+\hspace{0.1cm}3\,{\rm dB} \hspace{0.1cm}-\hspace{0.1cm}1.4\, {\rm dB}= 11.6\,{\rm dB} \hspace{0.3cm}\Rightarrow \hspace{0.3cm} p_{\rm U}\approx 7 \cdot 10^{-5}\hspace{0.05cm}.$$
- Soll diese (ungünstigste) Fehlerwahrscheinlichkeit $p_{\rm U} = 7 \cdot 10^{-5}$ ⇒ $10 \cdot {\rm lg}\hspace{0.1cm} \rho_{\rm U} = 11.6 \ \rm dB$ beim Kanal mit der charakteristischen Kabeldämpfung $a_\star = 80 \ \rm dB$ nicht überschritten werden, so muss demnach für das Verhältnis $E_{\rm B}/N_0$ gelten:
- \[10 \cdot {\rm lg}\hspace{0.1cm}{E_{\rm B}}/{N_0} \ge 11.6\,{\rm dB} \hspace{0.1cm}-3\,{\rm dB} \hspace{0.1cm}-\hspace{0.1cm}(-78.2)\,{\rm dB}= 86.8\,{\rm dB} \hspace{0.2cm} \Rightarrow \hspace{0.2cm}{E_{\rm B}}/{N_0}\approx 5 \cdot 10^{8}\hspace{0.05cm}.\]
- Um dies zu erreichen, muss allerdings die Grenzfrequenz des Gaußtiefpasses entsprechend den blauen Kreisen in der Grafik auf $f_{\rm G}= 0.33/T$ herabgesetzt werden.
Aufgaben zum Kapitel
Aufgabe 3.3: Rauschen bei Kanalentzerrung
Aufgabe 3.3Z: Optimierung eines Koaxialkabelsystems
