Synchronous Demodulation
Contents
- 1 Block diagram and time domain representation
- 2 Description in the frequency domain
- 3 Prerequisites for the application of a synchronous demodulator
- 4 Influence of a frequency offset
- 5 Influence of a phase offset
- 6 Influence of linear channel distortions
- 7 Einfluss von Rauschstörungen
- 8 Berechnung der Rauschleistung
- 9 Zusammenhang zwischen $P_q$ und $P_{\rm S}$
- 10 Sinken-SNR und Leistungskenngröße
- 11 Aufgaben zum Kapitel
Block diagram and time domain representation
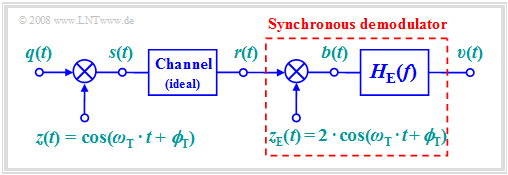
Modulation at the transmitter only makes sense, if it is possible to reverse this signal conversion at the receiver end, ideally without loss of information. In any form of amplitude modulation - be it double sideband (DSB) or single sideband (SSB), with or without a carrier signal - the so-called synchronous demodulator fulfils this task.
The following should be noted with regard to the above block diagram:
- For modulation, we will focus on "DSB–AM without a carrier" $($modulation depth $m → ∞)$ . However, synchronous demodulation is also applicable in "DSB–AM with carrier".
- Let the channel be ideal and the distortions negligible, that the received signal $r(t)$ is identical to the transmitted signal $s(t)$ :
- $$r(t) = s(t) = q(t) \cdot \cos(\omega_{\rm T} \cdot t + \phi_{\rm T})\hspace{0.05cm}.$$
- At the receiver, $r(t)$ is first multiplied by the receiver-side carrier $z_{\rm E}(t)$ , which is identical to the transmitter-side carrier $z(t)$ but larger by a factor of $2$ :
- $$z_{\rm E}(t) = 2 \cdot \cos(\omega_{\rm T} \cdot t + \phi_{\rm T})\hspace{0.05cm}.$$
- DThe result of the multiplication is the signal $b(t)$. . Considering the trigonometric transformation $\cos^2(α) = 1/2 · \big [1 + \cos(2α)\big ]$ we get
- $$b(t) = r(t) \cdot z_{\rm E}(t) = 2 \cdot q(t) \cdot \cos^2(\omega_{\rm T} \cdot t + \phi_{\rm T}) = q(t) + q(t) \cdot \cos(2 \cdot \omega_{\rm T} \cdot t + 2\cdot \phi_{\rm T})\hspace{0.05cm}.$$
- The second term is in the range around twice the carrier frequency. If the signal bandwidth is $B_{\rm NF} < f_{\rm T}$, which is always true in practice, this component can be suppressed by a low-pass filter $H_{\rm E}(f)$ with suitable dimensions, and we obtain $v(t) = q(t)$.
Description in the frequency domain
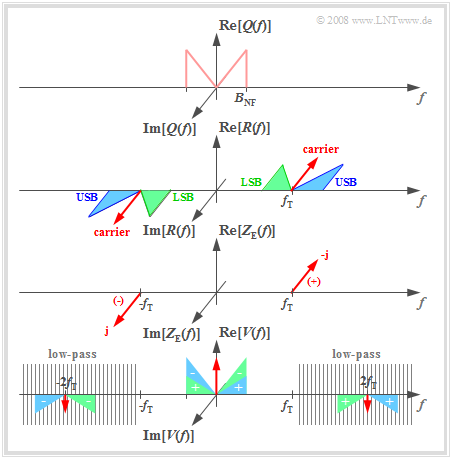
Assuming an even source signal $q(t)$ ⇒ with a real spectrum $Q(f)$ and a sinusoidal carrier $z(t)$ , the imaginary transmitted spectrum $S(f)$ is obtained according to the second plot, where $A_{\rm T} ≠ 0$ also takes into account the DSB-AM with a carrier (shown by the red Dirac function). Because the channel is ideal, $R(f) = S(f)$.
The operation of the synchronous demodulator can be explained in the frequency domain as follows:
- The receiver-side carrier signal $z_{\rm E}(t) = 2 · z(t) = 2 · \sin(ω_{\rm T} · t)$ leads to two Dirac functions in the spectral domain at $\pm f_{\rm T}$ with weights $\pm \rm j$. The negative imaginary part occurs at $f = +f_{\rm T}$ .
- The multiplication $b(t) = r(t) · z_{\rm E}(t)$ corresponds to the convolution of the associated spectral functions:
- $$B(f) = R(f) \star Z_{\rm E}(f)\hspace{0.05cm}.$$
- Convolution of the Dirac function $ - {\rm j} \cdot δ(f – f_{\rm T})$ with the wholly imaginary spectrum $R(f)$ leads to completely real spectral components around $f = 0$ and $f = 2f_{\rm T}$. These components are marked with a "+" on the graph.
- The second convolution product ${\rm j} · δ(f + f_{\rm T}) \star R(f)$ yields a low-frequency spectral component around $f = 0$. in addition to a component at $–2f_{\rm T}$ . These spectral components are marked with "–".
- The spectrum after the low-pass $H_{\rm E}(f)$ is $V(f) = Q(f) + A_{\rm T} · δ(f)$. For DSB-AM with a carrier, the interfering DC component can be removed by a band limit on the low end, i.e. $H_{\rm E}(f = 0) = 0$.
- The color assignment in the diagram (USB blue, LSB green, carrier red) shows that the synchronous demodulator uses both the USB and the LSB for signal reconstruction.
Prerequisites for the application of a synchronous demodulator
The output signal $v(t)$ is identical to the source signal $q(t)$ if the following conditions are satisfied:
- The bandwidth $B_{\rm NF}$ of the source signal is smaller than the carrier frequency $f_{\rm T}$. This restriction is not particularly drastic and is not relevant for practical applications.
- The carrier frequencies of the transmitter and receiver are exactly matched. This requires carrier recovery at the receiver and thus involves some "cost".
- There is also perfect phase synchrony between the the carrier signals $z(t)$ and $z_{\rm E}(t)$ at the transmitter and receiver end, respectively.
- The channel frequency response $H_{\rm K}(f)$ is ideally equal to $1$. in the passband $f_{\rm T} - B_{\rm NF} ≤ |f| ≤ f_{\rm T} + B_{\rm NF}$ . Frequency-independent attenuation or frequency-linear phase (delay) are usually tolerated.
- The influence of noise and external disturbances is assumed to be negligible in this model. However, even with non-negligible noise, the synchronous demodulator is superior to other demodulators.
- The receiver filter $H_{\rm E}(f)$ (subscript E stands for German "Empfangsfilter" ⇒ receiver filter) is equal to "one" for $|f| ≤ B_{\rm NF}$ and equal to "zero" for $|f| ≥ 2f_{\rm T} - B_{\rm NF}$. The process in between is not relevant (see graph in the previous section).
- BFor the modulation method "DSB-AM with carrier", $H_{\rm E}(f = 0) ≡ 0$ must additionally ensure that the carrier added at the transmitter is no longer included in the sink signal.
The following sections describe the effects if some of the above conditions are not met.
Influence of a frequency offset
As the name "synchronous demodulator” it only works when there is complete synchrony between the carrier signals of the transmitter and receiver. On the other hand, if the carrier frequencies differ by a frequency offset $Δ\hspace{-0.05cm}f_{\rm T}$, for example
- $$\begin{align*}z(t) & = 1 \cdot \cos(2 \pi f_{\rm T} \cdot t + \phi_{\rm T})\hspace{0.05cm}, \\ z_{\rm E}(t) & = 2 \cdot \cos(2 \pi (f_{\rm T} + \Delta\hspace{-0.05cm} f_{\rm T}) \cdot t + \phi_{\rm T})\hspace{0.05cm},\end{align*}$$
then for the sink signal spectrum we obtain:
- $$V(f) = {1}/{2}\cdot Q(f + \Delta \hspace{-0.05cm}f_{\rm T}) + {1}/{2}\cdot Q(f - \Delta\hspace{-0.05cm} f_{\rm T}) = Q(f) \star \big[ {1}/{2}\cdot \delta(f + \Delta\hspace{-0.05cm} f_{\rm T}) + {1}/{2}\cdot \delta (f - \Delta \hspace{-0.05cm}f_{\rm T}) \big] \hspace{0.05cm}.$$
This result can be verified in the frequency domain using the sketch on the Description page. After transforming the equation to the time domain, we get:
- $$v(t) = q(t) \cdot \cos(2 \pi \cdot \Delta \hspace{-0.05cm}f_{\rm T} \cdot t )\hspace{0.05cm}.$$
$\text{Conclusion:}$ for DSB-AM (with or without carrier), synchronous demodulation with frequency offset $ \Delta \hspace{-0.05cm}f_{\rm T}$ leads to attenuation distortions, characterized by the time-dependent factor $\cos(2 \pi \cdot \Delta \hspace{-0.05cm}f_{\rm T} \cdot t )$.
The frequency offset $Δ\hspace{-0.05cm}f_{\rm T}$, which is due to inaccuracies in the realization of carrier recovery, is usually very small and ranges from a few Hertz to about $100\text{ Hz}$ . In this context, one usually speaks of a "beat".
$\text{Example 1:}$ The graph shows
- a cosine-shaped source signal with frequency $f_{\rm N} = 1\ \rm kHz$
⇒ blue oscillation, and - the sink signal obtained with a synchronous demodulator $v(t)$
⇒ red curve.
Here, a frequency offset of $Δ\hspace{-0.05cm}f_{\rm T} = 100\ \rm Hz$ was used as a basis. This results in:
- $$\begin{align*}v(t ) & = 1\,{\rm V} \cdot \cos (2 \pi \cdot 1\,{\rm kHz} \cdot t) \cdot \cos (2 \pi \cdot 0.1\,{\rm kHz} \cdot t) =\\ &= 0.5\,{\rm V} \cdot \cos (2 \pi \cdot 0.9\,{\rm kHz} \cdot t) + 0.5\,{\rm V} \cdot \cos (2 \pi \cdot 1.1\,{\rm kHz} \cdot t) \hspace{0.05cm}.\end{align*}$$
From a spectral point of view, the $1\ \rm kHz$ oscillation becomes two superimposed oscillations with frequencies $0.9\ \rm kHz$ and $1.1\ \rm kHz$ with half the amplitude.
- New frequencies occur as a result – i.e., nonlinear distortions.
- In contrast, the transmitted frequency $(1\ \rm kHz)$ is no longer included in $v(t)$ .
Influence of a phase offset
Now, for the transmitter-side and receiver-side carrier signal, it holds that:
- $$\begin{align*}z(t) & = 1 \cdot \cos(2 \pi f_{\rm T} t + \phi_{\rm T})\hspace{0.05cm}, \\ z_{\rm E}(t) & = 2 \cdot \cos(2 \pi f_{\rm T} t + \phi_{\rm E})\hspace{0.05cm}.\end{align*}$$
This gives Δ𝛟T=𝛟E-𝛟T For the signal immediately after multiplication by the phase offset $Δ \mathbf{ϕ_{\rm T} = ϕ_{\rm E} - ϕ_{\rm T} }$, this gives:
- $$b(t) = q(t) \cdot \cos(\omega_{\rm T} \cdot t + \phi_{\rm T}) \cdot 2 \cdot \cos(\omega_{\rm T} \cdot t + \phi_{\rm E})= q(t)\cdot \cos(\Delta \phi_{\rm T}) + q(t) \cdot \cos(2 \cdot \omega_{\rm T} \cdot t + \phi_{\rm E}+ \phi_{\rm T})\hspace{0.05cm}.$$
Thus, taking into account the low-pass filter, the result for the sink signal is:
- $$v(t) = q(t)\cdot \cos(\Delta \phi_{\rm T}) \hspace{0.05cm}.$$
$\text{Conclusion:}$ for DSB-AM (with or without carrier), synchronous demodulation with phase offset $Δ\mathbf{ϕ_{\rm T} }$ does not lead to distortions, but only to a frequency independent attenuation by the time independent factor $\cos(Δ\mathbf{ϕ_{\rm T} })$.
The reason for this less serious signal change than in the case of a frequency offset is that in this case the time $t$ is missing in the argument of the cosine function.
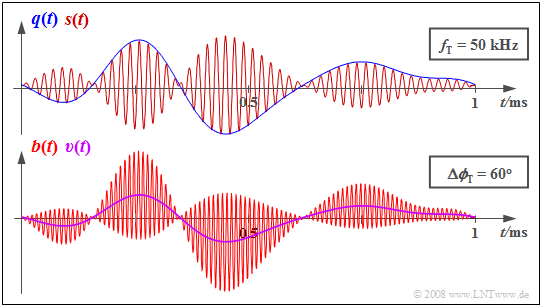
$\text{Example 2:}$ The diagram shows the signals $q(t)$ and $s(t)$ at the transmitter above, and the receiver-side signals $b(t)$ and $v(t)$ below.
- Due to the phase offset of $Δ \mathbf{ϕ_{\rm T} } = π/3\ (60^\circ)$ , the sink signal $v(t)$ is only half the size of the source signal $q(t)$.
- However, the waveform of $q(t)$ is preserved in $v(t)$ .
Influence of linear channel distortions
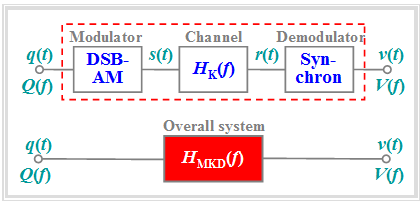
In the section Attenuation distortions of the book "Linear and Time Invariant Systems" it was already suggested that the entire communication system - consisting of modulator, channel, and demodulator – consisting of Modulator, Channel (or K for "Kanal" in German)and Demodulator – can be completely described by the resulting frequency response Frequenzgang $H_{\rm MKD}(f)$ if
- either the system is free of distortion, or
- only linear distortions arise with respect to the $q(t)$ and $v(t)$ signals.
In contrast, nonlinear distortions are not captured by this diagram because the multiplicative relationship $V(f) = Q(f)\cdot H_{\rm MKD}(f)$ does not allow for the emergence of new frequencies. If $Q(f_0) = 0$, then $V(f_0) = 0$ will always hold as well.
The above conditions are fulfilled for the following system variant:
- The modulator generates a DSB-AM (with or without carrier) around the carrier frequencyThe channel is describable by the frequency response $H_{\rm K}(f)$ with bandpass characteristics and its bandwidth is sufficient.
- The synchronous demodulator is synchronous in frequency and phase and the filter $H_{\rm E}(f)$ is ideal (rectangular).
$\text{Definition:}$ Thus, the resulting frequency response of the modulator-channel-demodulator is:
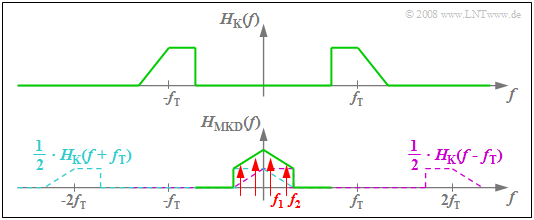
- $$H_{\rm MKD}(f) = {1}/{2} \cdot \big[ H_{\rm K}(f + f_{\rm T}) + H_{\rm K}(f - f_{\rm T})\big] \hspace{0.05cm}.$$
- Ist $\vert H_{\rm MKD}(f) \vert $ im Bereich der Signalbandbreite nicht konstant, so werden die verschiedenen Spektralanteile des Quellensignals $q(t)$ auch unterschiedlich übertragen ⇒ Dämpfungsverzerrungen.
- Ebenso kann es zu Phasenverzerrungen kommen, wenn die Phasenfunktion $\text{arc} \ H_{\rm MKD}(f) $ nichtlinear in $f$ ist.
$\text{Beispiel 3:}$ Die Grafik verdeutlicht die obige Berechnungsvorschrift für die resultierende Systemfunktion.
- Aus dem unsymmetrischen Bandpass $H_{\rm K}(f)$ – bezogen auf die Trägerfrequenz $f_{\rm T}$ – wird die im NF–Bereich $($um $f = 0)$ symmetrische Funktion $H_{\rm MKD}(f)$.
- Besteht das Quellensignal aus zwei Frequenzanteilen – in der Grafik an den roten Markierungspfeilen zu erkennen – so wird die Spektrallinie bei $f_2$ stärker gedämpft als die Frequenz $f_1$
⇒ es entstehen lineare Dämpfungsverzerrungen.
- Dass $H_{\rm MKD}(f)$ auch Anteile um $±2f_{\rm T}$ beinhaltet, ist nicht weiter störend. Diese beeinträchtigen die Tiefpass-Betrachtung nicht.
Einfluss von Rauschstörungen
Nun soll die Frage geklärt werden, in wie weit die Übertragungsqualität durch ein stochastisches Stör- bzw. Rauschsignal $n(t)$ beeinträchtigt wird. Wir gehen dabei von folgendem Szenario aus, das bereits auf der Seite Untersuchungen beim AWGN–Kanal vorgestellt wurde.
Insbesondere werden folgende Annahmen getroffen:
- Betrachtet wird eine Zweiseitenband–Amplitudenmodulation mit Modulationsgrad $m$ sowie ein idealer Synchrondemodulator ohne Phasen- und Frequenzversatz.
- Entsprechend dem erweiterten AWGN–Kanalmodell gilt für das Empfangssignal, wobei $α_{\rm K}$ ein frequenzunabhängiger Übertragungsfaktor ist und das Störsignal $n(t)$ weißes Rauschen mit der zweiseitigen Rauschleistungsdichte $N_0/2$ modelliert:
- $$r(t) = \alpha_{\rm K} \cdot s(t) + n(t) \hspace{0.05cm}.$$
- Stellvertretend für ein Quellensignal $q(t)$ der Bandbreite $B_{\rm NF}$ wird hier von einem cosinusförmigen Nachrichtensignal der Frequenz $B_{\rm NF}$ ausgegangen:
- $$q(t) = A_{\rm N} \cdot \cos(2 \pi \cdot B_{\rm NF} \cdot t ) \hspace{0.05cm}.$$
Mit diesen Annahmen gilt für das Sinkensignal $v(t) = \alpha_{\rm K} \cdot q(t) + \varepsilon(t) \hspace{0.05cm}$, wobei die Ursache der stochastischen Komponente $ε(t)$ das Bandpass–Rauschen $n(t)$ am Eingang des Synchrondemodulators ist.
$\text{Definition:}$ Als quantitatives Maß für die Übertragungsqualität wird das Signal–zu–Rausch–Leistungsverhältnis an der Sinke verwendet, das hier mit den Leistungen von $q(t)$ und $ε(t)$ wie folgt lautet:
- $$\rho_v = \frac{\alpha_{\rm K}^2 \cdot P_q}{P_\varepsilon} \hspace{0.05cm}.$$
Dieses Verhältnis bezeichnen wir im Folgenden kurz als das Sinken–SNR $ρ_v$ und die logarithmische Darstellung $10 · \lg ρ_v$ als den Sinken-Störabstand in dB.
Berechnung der Rauschleistung
Wir berechnen zunächst die Leistung $P_ε$ des Fehlersignals $ε(t)$, die wir der Einfachheit halber als „Rauschleistung” bezeichnen. Das Fehlersignal $ε(t)$ erhält man aus dem Störsignal $n(t)$ am Eingang durch
- Multiplikation mit $z_{\rm E}(t) = 2 · \cos(ω_{\rm T} · t + \mathbf{ϕ_{\rm T} })$ und
- eine anschließende (ideale) Tiefpassfilterung auf den Frequenzbereich $\pm B_{\rm NF}$.
Für das Leistungsdichtespektrum ${\it Φ_ε}'(f)$ ohne Berücksichtigung des Tiefpasses gilt mit ${\it Φ}_n(f) = N_0/2$:
- $${\it \Phi}_\varepsilon \hspace{-0.10cm} '(f) = {\it \Phi}_n (f) \star {\it \Phi}_{z {\rm E}}(f) \hspace{0.05cm}.$$
In den Büchern „Signaldarstellung” und „Stochastische Signaltheorie” wurde gezeigt, dass das Spektrum und das Leistungsdichtespektrum eines Cosinussignals $x(t) = A · \cos(2πf_{\rm T}t)$ wie folgt gegeben sind:
- $$X(f) = \frac{A}{2}\cdot \delta(f + f_{\rm T}) + \frac{A}{2}\cdot \delta(f - f_{\rm T}) \hspace{0.05cm}, $$
- $$ {\it \Phi}_x (f) = \frac{A^2}{4}\cdot \delta(f + f_{\rm T}) + \frac{A^2}{4}\cdot \delta(f - f_{\rm T}) \hspace{0.05cm}.$$
Angewandt auf das empfangsseitige Trägersignal $z_{\rm E}(t)$ lautet die zweite Gleichung mit $A = 2$, und zwar unabhängig von der Phase (da im Leistungsdichtespektrum alle Phasenbeziehungen verloren gehen):
- $${\it \Phi}_{z {\rm E}}(f)= \delta(f + f_{\rm T}) + \delta(f - f_{\rm T}) \hspace{0.05cm}.$$
Unter Berücksichtigung, dass ${\it Φ}_n(f)$ für alle Frequenzen konstant ist ⇒ „Weißes Rauschen” , ergibt sich:
- $${\it \Phi}_\varepsilon \hspace{-0.10cm} '(f) = {\it \Phi}_n (f + f_{\rm T}) + {\it \Phi}_n (f - f_{\rm T}) = 2 {\it \Phi}_n (f) = N_0 \hspace{0.05cm}.$$
Das Leistungsdichtespektrum (LDS) nach dem Tiefpassfilter ist für $|f| < B_{\rm NF}$ genau so groß und außerhalb Null:
- $${\it \Phi}_\varepsilon (f) = \left\{ \begin{array}{c} N_0 \\ 0 \\ \end{array} \right.\quad \begin{array}{*{10}c} {\rm{f\ddot{u}r}}\\ \\ \end{array}\begin{array}{*{20}c} |f|< B_{\rm NF} \hspace{0.05cm}, \\ {\rm sonst} \hspace{0.05cm}. \\ \end{array}$$
Durch Integration erhält man die Leistung $P_ε = 2N_0 · B_{\rm NF}$. Mit diesem Zwischenergebnis kann somit für das Sinken–SNR geschrieben werden:
- $$\rho_v = \frac{\alpha_{\rm K}^2 \cdot P_q}{P_\varepsilon} = \frac{\alpha_{\rm K}^2 \cdot P_q}{N_0 \cdot B_{\rm NF}} \hspace{0.05cm}.$$
Im nächsten Abschnitt wird noch der Zusammenhang zwischen der Leistung $P_q$ des Quellensignals und der Sendeleistung $P_{\rm S}$ hergestellt.
Zusammenhang zwischen $P_q$ und $P_{\rm S}$
Um den Zusammenhang zwischen Sinken–SNR $\rho_v$ und Sendeleistung $P_{\rm S}$ angeben zu können, benötigen wir noch den Zusammenhang zwischen den Leistungen von
- Quellensignal $q(t)$ ⇒ Leistung $P_q$, und
- Sendesignal $s(t)$ ⇒ Sendeleistung $P_{\rm S}$.
$\text{Vorweg genommenes Ergebnis:}$ Im Falle der „ZSB–AM mit Träger” gilt dabei mit dem Modulationsgrad $m$:
- $$P_{\rm S} = { P_q}/{2} \cdot \hspace{0.05cm} \left( 1 + {2}/{m^2}\right)\hspace{0.05cm}.$$
- Anzumerken ist, dass diese Gleichung nur dann anwendbar ist, wenn $q(t)$ eine harmonische Schwingung beschreibt.
- Die „ZSB–AM ohne Träger” ist in der Gleichung als Sonderfall für $m → ∞$ mit enthalten.
$\text{Beweis:}$ Ausgegangen wird jeweils von Cosinusschwingungen, also den folgenden Gleichungen:
- $$q(t) = A_{\rm N} \cdot \cos(\omega_{\rm N} \cdot t ) \hspace{0.05cm},$$
- $$s(t) = \big[ q(t) + A_{\rm T}\big] \cdot \cos(\omega_{\rm T} \cdot t ) = A_{\rm T} \cdot \cos(\omega_{\rm T} \cdot t ) + {A_{\rm N} }/{2}\cdot \cos\big [(\omega_{\rm T}+ \omega_{\rm N}) \cdot t \big] + {A_{\rm N} }/{2}\cdot \cos\big[(\omega_{\rm T}- \omega_{\rm N}) \cdot t \big]\hspace{0.05cm}.$$
- Die Leistung des Quellensignals, bezogen auf den Widerstand $1 \ \rm Ω$, beträgt mit der Periodendauer $T_{\rm N}$:
- $$P_{q} = \frac{1}{T_{\rm N} }\cdot\int_{0}^{ T_{\rm N} } {q^2(t)}\hspace{0.1cm}{\rm d}t = \frac{A_{\rm N}^2}{T_{\rm N} }\cdot\int_{0}^{T_{\rm N} } {\cos^2(2 \pi\cdot{t}/{T_{\rm N} })}\hspace{0.1cm}{\rm d}t = \frac{A_{\rm N}^2}{2}\hspace{0.05cm}.$$
- Entsprechend erhält man für die Leistung des Sendesignals:
- $$P_{\rm S} = \frac{A_{\rm T}^2}{2} + \frac{(A_{\rm N}/2)^2}{2} + \frac{(A_{\rm N}/2)^2}{2} = \frac{A_{\rm T}^2}{2} + \frac{A_{\rm N}^2}{4} \hspace{0.3cm}\Rightarrow \hspace{0.3cm} P_{\rm S} = {1}/{2} \cdot \left( P_q + A_{\rm T}^2 \right) \hspace{0.05cm}.$$
- Diese Gleichung gilt sowohl für ZSB–AM ohne Träger $(A_{\rm T} = 0)$ als auch für ZSB–AM mit Träger. Da $q(t)$ als eine harmonische Schwingung vorausgesetzt wurde, kann mit dem Modulationsgrad $m = A_{\rm N}/A_{\rm T}$ hierfür auch geschrieben werden:
- $$P_{\rm S} = {A_{\rm N}^2}/{4} \cdot \left( 1 +{2A_{\rm T}^2}/{A_{\rm N}^2} \right)= P_q/2 \cdot \left( 1 +{2}/{m^2} \right)\hspace{0.05cm}.\hspace{5.4cm}{\rm q.e.d.}$$
Sinken-SNR und Leistungskenngröße
Mit den Ergebnissen der letzten drei Abschnitte kann deshalb für das Sinken–SNR der ZSB-AM geschrieben werden:
- $$\rho_v = \frac{\alpha_{\rm K}^2 \cdot P_q}{P_\varepsilon} = \frac{\alpha_{\rm K}^2 \cdot P_{\rm S} }{N_0 \cdot B_{\rm NF} } \cdot \frac{1}{1 + {2}/{m^2} } \hspace{0.05cm}.$$
Nachfolgend wird diese Gleichung ausführlich diskutiert. Bereits im Kapitel Untersuchungen beim AWGN-Kanal wurde begründet, warum es Sinn macht, das Sinken–SNR $ρ_v$ in Abhängigkeit der nachfolgend benannten Leistungskenngröße $ξ$ anzugeben:
- $$\xi = \frac{\alpha_{\rm K}^2 \cdot P_{\rm S}}{N_0 \cdot B_{\rm NF}} \hspace{0.5cm}\Rightarrow \hspace{0.5cm} \rho_v = \frac{\xi}{1 + {2}/{m^2}} \hspace{0.05cm}.$$
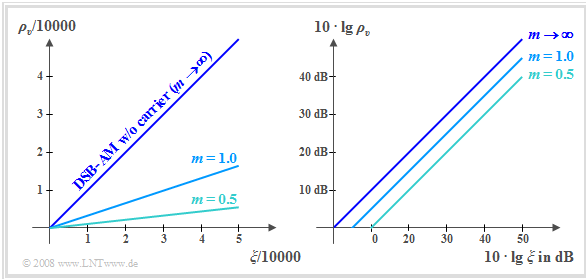
Die beiden Grafiken zeigen die entsprechenden Kurven – links linear und rechts in doppelt–logarithmischer Darstellung.
Die Kurven sind wie folgt zu interpretieren:
- Für die Systemvariante „ZSB–AM ohne Träger” erhält man mit $m → ∞$ aus der oberen Gleichung den einfachen Zusammenhang $ρ_v = ξ$. Dies ergibt sowohl bei der linearen als auch bei der doppelt–logarithmischen Darstellung die Winkelhalbierende.
- Eine größere Sendeleistung $P_{\rm S}$ führt ebenso wie ein größerer Übertragungsfaktor $α_{\rm K}$ (⇒ geringere Dämpfung) zu einem besseren Sinken–SNR. $10 · \lg ρ_v$ wird aber auch durch eine kleinere Rauschleistungsdichte $N_0$ und eine kleinere Bandbreite $B_{\rm NF}$ bei sonst gleichen Bedingungen vergrößert.
- Bei einer „ZSB–AM mit Träger” gilt mit dem Modulationsgrad $m$:
- $$\rho_v = \xi \cdot \frac{1}{1 + {2}/{m^2}}\hspace{0.3cm}\Rightarrow \hspace{0.3cm} 10 \cdot {\rm lg }\hspace{0.1cm}\rho_v = 10 \cdot {\rm lg }\hspace{0.1cm}\xi - 10 \cdot {\rm lg }\hspace{0.1cm} \left({1 + {2}/{m^2}}\right)\hspace{0.05cm}.$$
- In der doppelt–logarithmischen Darstellung (siehe rechte Grafik) führt dies zu einer Parallelverschiebung der Kurven nach unten, zum Beispiel bei $m = 1$ um $4.77$ dB und bei $m = 0.5$ um $9.54$ dB.
- Alle Aussagen gelten unter der Voraussetzung eines idealen Synchrondemodulators. In diesem Fall macht das Verfahren „ZSB–AM mit Träger” eigentlich keinen Sinn. Der zugesetzte Träger führt hier nur zu einer unnötig großen Sendeleistung und kann zur Demodulation nicht genutzt werden.
- Die Kurven gelten für perfekte Frequenz– und Phasensynchronisation. Um die Parameter $f_{\rm T}$ und $\mathbf{ϕ_{\rm T} }$ mit weniger Aufwand aus dem Empfangssignal $r(t)$ ermitteln zu können, macht allerdings ein kleiner Trägeranteil im Sendesignal durchaus Sinn.
- Mit $m = 3$ ergibt sich dann nur eine unwesentliche Verschlechterung gegenüber „ZSB–AM ohne Träger” von weniger als einem dB.
Aufgaben zum Kapitel
Aufgabe 2.4: Frequenz– und Phasenversatz
Aufgabe 2.4Z: Tiefpass-Einfluss bei Synchrondemodulation
Aufgabe 2.5: ZSB–AM über einen Gaußkanal
Aufgabe 2.5Z: Nochmals Verzerrungen bei ZSB-AM
Aufgabe 2.6Z: Signal-to-Noise-Ratio (SNR)
