Contents
- 1 # OVERVIEW OF THE SECOND MAIN CHAPTER #
- 2 Information content – Entropy – Redundancy
- 3 Source coding – Channel coding – Transmission coding
- 4 System model and description variables
- 5 ACF calculation of a digital signal
- 6 LDS–Berechnung eines Digitalsignals
- 7 AKF und LDS bei bipolaren Binärsignalen
- 8 AKF und LDS bei unipolaren Binärsignalen
- 9 Aufgaben zum Kapitel
# OVERVIEW OF THE SECOND MAIN CHAPTER #
The second main chapter deals with so-called transmission coding, which is sometimes also referred to as "line coding" in the literature. In this process, an adaptation of the digital transmission signal to the characteristics of the transmission channel is achieved through the targeted addition of redundancy. In detail, the following are dealt with:
- some basic concepts of information theory such as information content and entropy,
- the ACF calculation and the power-spectral densities of digital signals,
- the redundancy-free coding, which leads to a non-binary transmitted signal,
- the calculation of symbol and bit error probability for multilevel systems,
- the so-called 4B3T codes as an important example of blockwise coding, and
- the pseudo-ternary codes, each of which realizes symbol-wise coding.
The description is in baseband throughout and some simplifying assumptions (among others: no intersymbol interfering) are still made.
Further information on the topic as well as exercises, simulations and programming exercises can be found in
- chapter 15: Coded and multilevel transmission, program cod
of the practical course "Simulation Methods in Communications Engineering". This (former) LNT course at the TU Munich is based on
- the teaching software package LNTsim ⇒ link refers to the ZIP version of the program and
- this lab manual ⇒ link refers to the PDF version; chapter 15: pages 337-362.
Information content – Entropy – Redundancy
We assume an $M$–stage digital message source that outputs the following source signal:
- $$q(t) = \sum_{(\nu)} a_\nu \cdot {\rm \delta} ( t - \nu \cdot T)\hspace{0.3cm}{\rm with}\hspace{0.3cm}a_\nu \in \{ a_1, \text{...} \ , a_\mu , \text{...} \ , a_{ M}\}.$$
- The source symbol sequence $\langle q_\nu \rangle$ is thus mapped to the sequence $\langle a_\nu \rangle$ of the dimensionless amplitude coefficients.
- Simplifying, first for the time indexing variable $\nu = 1$, ... , $N$ is set, while the index $\mu$ can always assume values between $1$ and $M$.
If the $\nu$–th sequence element is equal to $a_\mu$, its information content can be calculated with probability $p_{\nu\mu} = {\rm Pr}(a_\nu = a_\mu)$ as follows:
- $$I_\nu = \log_2 \ (1/p_{\nu \mu})= {\rm ld} \ (1/p_{\nu \mu}) \hspace{1cm}\text{(unit: bit)}\hspace{0.05cm}.$$
The logarithm to the base 2 ⇒ $\log_2(x)$ is often also called ${\rm ld}(x)$ ⇒ logarithm dualis. With the numerical evaluation the reference unit "bit" (from: binary digit ) is added. With the tens logarithm $\lg(x)$ and the natural logarithm $\ln(x)$ applies:
- $${\rm log_2}(x) = \frac{{\rm lg}(x)}{{\rm lg}(2)}= \frac{{\rm ln}(x)}{{\rm ln}(2)}\hspace{0.05cm}.$$
According to this definition of information, which goes back to Claude E. Shannon, the smaller the probability of occurrence of a symbol, the greater its information content.
$\text{Definition:}$ Entropy is the average information content of a sequence element (symbol). This important information-theoretical quantity can be determined as a time average as follows:
- $$H = \lim_{N \to \infty} \frac{1}{N} \cdot \sum_{\nu = 1}^N I_\nu = \lim_{N \to \infty} \frac{1}{N} \cdot \sum_{\nu = 1}^N \hspace{0.1cm}{\rm log_2}\hspace{0.05cm} \ (1/p_{\nu \mu}) \hspace{1cm}\text{(unit: bit)}\hspace{0.05cm}.$$
Of course, entropy can also be calculated by ensemble averaging (over the symbol set).
If the sequence elements $a_\nu$ are statistically independent of each other, the probabilities of occurrence $p_{\nu\mu} = p_{\mu}$ are independent of $\nu$ and we obtain in this special case for the entropy:
- $$H = \sum_{\mu = 1}^M p_{ \mu} \cdot {\rm log_2}\hspace{0.1cm} \ (1/p_{\mu})\hspace{0.05cm}.$$
If, on the other hand, there are statistical bonds between neighboring amplitude coefficients $a_\nu$, the more complicated equation according to the above definition must be used for entropy calculation.
The maximum value of entropy is obtained whenever the $M$ occurrence probabilities (of the statistically independent symbols) are all equal $(p_{\mu} = 1/M)$:
- $$H_{\rm max} = \sum_{\mu = 1}^M \hspace{0.1cm}\frac{1}{M} \cdot {\rm log_2} (M) = {\rm log_2} (M) \cdot \sum_{\mu = 1}^M \hspace{0.1cm} \frac{1}{M} = {\rm log_2} (M) \hspace{1cm}\text{(unit: bit)}\hspace{0.05cm}.$$
$\text{Definition:}$ Let $H_{\rm max}$ be the decision content (or message content ) of the source and the quotient
- $$r = \frac{H_{\rm max}-H}{H_{\rm max} }$$
as the relative redundancy. Since $0 \le H \le H_{\rm max}$ always holds, the relative redundancy can take values between $0$ and $1$ (including these limits).
From the derivation of these descriptive quantities, it is obvious that a redundancy-free digital signal $(r=0)$ must satisfy the following properties:
- The amplitude coefficients $a_\nu$ are statistically independent ⇒ $p_{\nu\mu} = {\rm Pr}(a_\nu = a_\mu)$ is identical for all $\nu$.
- The $M$ possible coefficients $a_\mu$ occur with equal probability $p_\mu = 1/M$.
$\text{Example 1:}$ If one analyzes a German text waiting for transmission on the basis of $M = 32$ characters
- $$\text{(a, ... , z, ä, ö, ü, ß, spaces, punctuation, no distinction between upper and lower case)},$$
the result is the decision content $H_{\rm max} = 5 \ \rm bit/symbol$. Due to
- the different frequencies (for example, "e" occurs significantly more often than "u") and
- of statistical bindings (for example "q" is followed by the letter "u" much more often than "e")
according to Karl Küpfmüller the entropy of the German language is only $H = 1.3 \ \rm bit/character$. This results in a relative redundancy of $r \approx (5 - 1.3)/5 = 74\%$.
For English texts Claude Shannon has given the entropy as $H = 1 \ \rm bit/character$ and the relative redundancy as $r \approx 80\%$.
Source coding – Channel coding – Transmission coding
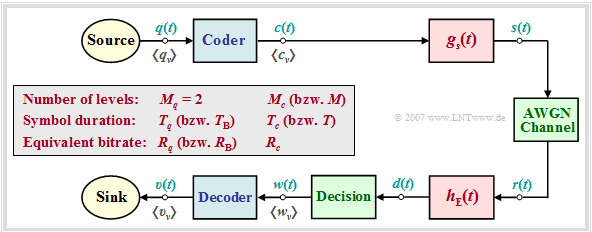
Coding is the conversion of the source symbol sequence $\langle q_\nu \rangle$ with symbol range $M_q$ into a code symbol sequence $\langle c_\nu \rangle$ with symbol range $M_c$. Usually, coding manipulates the redundancy contained in a digital signal. Often – but not always – $M_q$ and $M_c$ are different.
A distinction is made between different types of coding depending on the target direction:
- The task of source coding is redundancy reduction for data compression, as applied for example in image coding. By exploiting statistical bonds between the individual points of an image or between the brightness values of a point at different times (in the case of moving image sequences), methods can be developed that lead to a noticeable reduction in the amount of data (measured in "bit" or "byte") while maintaining virtually the same (subjective) image quality. A simple example of this is differential pulse code modulation (DPCM).
- With channel coding, on the other hand, a noticeable improvement in the transmission behavior is achieved by using a redundancy specifically added at the transmitter to detect and correct transmission errors at the receiver end. Such codes, the most important of which are block codes, convolutional codes and turbo codes, are particularly important in the case of heavily disturbed channels. The greater the relative redundancy of the coded signal, the better the correction properties of the code, albeit at a reduced user data rate.
- Transmission coding – often referred to as line coding – is used to adapt the transmitted signal to the spectral characteristics of the transmission channel and receiving equipment by recoding the source symbols. For example, in the case of a channel with the frequency response characteristic $H_{\rm K}(f=0) = 0$, over which consequently no DC signal can be transmitted, transmission coding must ensure that the code symbol sequence contains neither a long $\rm L$ sequence nor a long $\rm H$ sequence.
In the current book "Digital Signal Transmission" we deal exclusively with this last, transmission-technical aspect.
- Channel Coding has its own book dedicated to it in our learning tutorial.
- Source coding is covered in detail in the book Information Theory (main chapter 2).
- Also voice coding described in the book "Examples of Communication Systems" is a special form of source coding.
System model and description variables
In the following we always assume the block diagram sketched below and the following agreements:
- Let the digital source signal $q(t)$ be binary $(M_q = 2)$ and redundancy-free $(H_q = 1 \ \rm bit/symbol)$.
- With the symbol duration $T_q$ results for the symbol rate of the source:
- $$R_q = {H_{q}}/{T_q}= {1}/{T_q}\hspace{0.05cm}.$$
- Because of $M_q = 2$, in the following we also refer to $T_q$ as the bit duration and $R_q$ as the bit rate.
- For the comparison of transmission systems with different coding, $T_q$ and $R_q$ are always assumed to be constant.
Note: In later chapters we use $T_{\rm B}$ and $R_{\rm B}$ for this purpose. - The encoder signal $c(t)$ and also the transmitted signal $s(t)$ after pulse shaping with $g_s(t)$ have the step number $M_c$, the symbol duration $T_c$ and the symbol rate $1/T_c$. The equivalent bit rate is
- $$R_c = {{\rm log_2} (M_c)}/{T_c} \hspace{0.05cm}.$$
- It is always $R_c \ge R_q$, where the equal sign is valid only for the redundancy-free codes $(r_c = 0)$. Otherwise, we obtain for the relative code redundancy:
- $$r_c =({R_c - R_q})/{R_c} = 1 - R_q/{R_c} \hspace{0.05cm}.$$
Notes on nomenclature:
- In the context of transmission codes, $R_c$ in our learning tutorial always indicates the equivalent bit rate of the encoder signal has the unit "bit/s", as does the source bit rate $R_q$.
- In the literature on channel coding, in particular, $R_c$ is often used to denote the dimensionless code rate $1 - r_c$ . $R_c = 1 $ then indicates a redundancy-free code, while $R_c = 1/3 $ indicates a code with the relative redundancy $r_c = 2/3 $.
$\text{Example 2:}$ In the so-called 4B3T codes, four binary symbols $(m_q = 4, \ M_q= 2)$ are each represented by three ternary symbols $(m_c = 3, \ M_c= 3)$. Because of $4 \cdot T_q = 3 \cdot T_c$ holds:
- $$R_q = {1}/{T_q}, \hspace{0.1cm} R_c = { {\rm log_2} (3)} \hspace{-0.05cm} /{T_c} = {3/4 \cdot {\rm log_2} (3)} \hspace{-0.05cm}/{T_q}\hspace{0.3cm}\Rightarrow \hspace{0.3cm}r_c =3/4\cdot {\rm log_2} (3) \hspace{-0.05cm}- \hspace{-0.05cm}1 \approx 15.9\, \% \hspace{0.05cm}.$$
More detailed information about the 4B3T codes can be found in the chapter of the same name .
ACF calculation of a digital signal
To simplify the notation, $M_c = M$ and $T_c = T$ is set in the following. Thus, for the transmitted signal $s(t)$ in the case of an unlimited-time message sequence with $a_\nu \in \{ a_1,$ ... , $a_M\}$ can be written:
- $$s(t) = \sum_{\nu = -\infty}^{+\infty} a_\nu \cdot g_s ( t - \nu \cdot T) \hspace{0.05cm}.$$
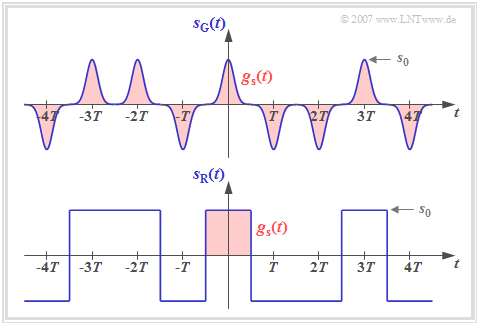
This signal representation includes both the source statistics $($amplitude coefficients $a_\nu$) and the transmitted pulse shape $g_s(t)$. The diagram shows two binary bipolar transmitted signals $s_{\rm G}(t)$ and $s_{\rm R}(t)$ with the same amplitude coefficients $a_\nu$, which thus differ only by the basic transmission pulse $g_s(t)$.
It can be seen from this representation that a digital signal is generally nonstationary:
- For the transmitted signal $s_{\rm G}(t)$ with narrow Gaussian pulses, the non-stationarity is obvious, since, for example, at multiples of $T$ the variance is $\sigma_s^2 = s_0^2$, while exactly in between $\sigma_s^2 \approx 0$ holds.
- Auch das Signal $s_{\rm R}(t)$ mit NRZ–rechteckförmigen Impulsen ist im strengen Sinne nichtstationär, da sich hier die Momente an den Bitgrenzen gegenüber allen anderen Zeitpunkten unterscheiden. Beispielsweise gilt $s_{\rm R}(t = \pm T/2)=0$.
$\text{Definition:}$ Einen Zufallsprozess, dessen Momente $m_k(t) = m_k(t+ \nu \cdot T)$ sich periodisch mit $T$ wiederholen, bezeichnet man als zyklostationär; $k$ und $\nu$ besitzen bei dieser impliziten Definition ganzzahlige Zahlenwerte.
Viele der für ergodische Prozesse gültigen Regeln kann man mit nur geringen Einschränkungen auch auf zykloergodische (und damit auf zyklostationäre ) Prozesse anwenden.
Insbesondere gilt für die Autokorrelationsfunktion (AKF) solcher Zufallsprozesse mit Mustersignal $s(t)$:
- $$\varphi_s(\tau) = {\rm E}\big [s(t) \cdot s(t + \tau)\big ] \hspace{0.05cm}.$$
Mit obiger Gleichung des Sendesignals kann die AKF als Zeitmittelwert auch wie folgt geschrieben werden:
- $$\varphi_s(\tau) = \sum_{\lambda = -\infty}^{+\infty}\frac{1}{T} \cdot \lim_{N \to \infty} \frac{1}{2N +1} \cdot \sum_{\nu = -N}^{+N} a_\nu \cdot a_{\nu + \lambda} \cdot \int_{-\infty}^{+\infty} g_s ( t ) \cdot g_s ( t + \tau - \lambda \cdot T)\,{\rm d} t \hspace{0.05cm}.$$
Da die Grenzwert–, Integral– und Summenbildung miteinander vertauscht werden darf, kann mit den Substitutionen $N = T_{\rm M}/(2T)$, $\lambda = \kappa- \nu$ und $t - \nu \cdot T \to T$ hierfür auch geschrieben werden:
- $$\varphi_s(\tau) = \lim_{T_{\rm M} \to \infty}\frac{1}{T_{\rm M}} \cdot \int_{-T_{\rm M}/2}^{+T_{\rm M}/2} \sum_{\nu = -\infty}^{+\infty} \sum_{\kappa = -\infty}^{+\infty} a_\nu \cdot g_s ( t - \nu \cdot T ) \cdot a_\kappa \cdot g_s ( t + \tau - \kappa \cdot T ) \,{\rm d} t \hspace{0.05cm}.$$
Nun werden zur Abkürzung folgende Größen eingeführt:
$\text{Definition:}$ Die diskrete AKF der Amplitudenkoeffizienten liefert Aussagen über die linearen statistischen Bindungen der Amplitudenkoeffizienten $a_{\nu}$ und $a_{\nu + \lambda}$ und besitzt keine Einheit:
- $$\varphi_a(\lambda) = \lim_{N \to \infty} \frac{1}{2N +1} \cdot \sum_{\nu = -\infty}^{+\infty} a_\nu \cdot a_{\nu + \lambda} \hspace{0.05cm}.$$
$\text{Definition:}$ Die Energie–AKF des Grundimpulses ist ähnlich definiert wie die allgemeine (Leistungs–)AKF. Sie wird mit einem Punkt gekennzeichnet. Da $g_s(t)$ energiebegrenzt ist, kann auf die Division durch $T_{\rm M}$ und den Grenzübergang verzichtet werden:
- $$\varphi^{^{\bullet} }_{gs}(\tau) = \int_{-\infty}^{+\infty} g_s ( t ) \cdot g_s ( t + \tau)\,{\rm d} t \hspace{0.05cm}.$$
$\text{Definition:}$ Für die Autokorrelationsfunktion eines Digitalsignals $s(t)$ gilt allgemein:
- $$\varphi_s(\tau) = \sum_{\lambda = -\infty}^{+\infty}{1}/{T} \cdot \varphi_a(\lambda)\cdot\varphi^{^{\bullet} }_{gs}(\tau - \lambda \cdot T)\hspace{0.05cm}.$$
Das Signal $s(t)$ kann dabei binär oder mehrstufig, unipolar oder bipolar sowie redundanzfrei oder redundant (leitungscodiert) sein. Die Impulsform wird durch die Energie–AKF berücksichtigt.
Beschreibt das Digitalsignal $s(t)$ einen Spannungsverlauf, so hat die Energie–AKF des Grundimpulses $g_s(t)$ die Einheit $\rm V^2s$ und $\varphi_s(\tau)$ die Einheit $\rm V^2$, jeweils bezogen auf den Widerstand $1 \ \rm \Omega$.
Anmerkung: Im strengen Sinne der Systemtheorie müsste man die AKF der Amplitudenkoeffizienten wie folgt definieren:
- $$\varphi_{a , \hspace{0.08cm}\delta}(\tau) = \sum_{\lambda = -\infty}^{+\infty} \varphi_a(\lambda)\cdot \delta(\tau - \lambda \cdot T)\hspace{0.05cm}.$$
Damit würde sich die obige Gleichung wie folgt darstellen:
- $$\varphi_s(\tau) ={1}/{T} \cdot \varphi_{a , \hspace{0.08cm} \delta}(\tau)\star \varphi^{^{\bullet}}_{gs}(\tau - \lambda \cdot T) = \sum_{\lambda = -\infty}^{+\infty}{1}/{T} \cdot \varphi_a(\lambda)\cdot \varphi^{^{\bullet}}_{gs}(\tau - \lambda \cdot T)\hspace{0.05cm}.$$
Zur einfacheren Darstellung wird im Folgenden die diskrete AKF der Amplitudenkoeffizienten
⇒ $\varphi_a(\lambda)$
ohne diese Diracfunktionen geschrieben.
LDS–Berechnung eines Digitalsignals
Die Entsprechungsgröße zur Autokorrelationsfunktion (AKF) eines Zufallssignals ⇒ $\varphi_s(\tau)$ ist im Frequenzbereich das Leistungsdichtespektrum (LDS) ⇒ ${\it \Phi}_s(f)$, das mit der AKF über das Fourierintegral in einem festen Bezug steht:
- $$\varphi_s(\tau) \hspace{0.4cm}\circ\!\!-\!\!\!-\!\!\!-\!\!\bullet \hspace{0.4cm} {\it \Phi}_s(f) = \int_{-\infty}^{+\infty} \varphi_s(\tau) \cdot {\rm e}^{- {\rm j}\hspace{0.05cm} 2 \pi f \hspace{0.02cm} \tau} \,{\rm d} \tau \hspace{0.05cm}.$$
Berücksichtigt man den Zusammenhang zwischen Energie–AKF und Energiespektrum,
- $$\varphi^{^{\hspace{0.05cm}\bullet}}_{gs}(\tau) \hspace{0.4cm}\circ\!\!-\!\!\!-\!\!\!-\!\!\bullet \hspace{0.4cm} {\it \Phi}^{^{\hspace{0.08cm}\bullet}}_{gs}(f) = |G_s(f)|^2 \hspace{0.05cm},$$
sowie den Verschiebungssatz, so kann das Leistungsdichtespektrum des Digitalsignals $s(t)$ in folgender Weise dargestellt werden:
- $${\it \Phi}_s(f) = \sum_{\lambda = -\infty}^{+\infty}{1}/{T} \cdot \varphi_a(\lambda)\cdot {\it \Phi}^{^{\hspace{0.05cm}\bullet}}_{gs}(f) \cdot {\rm e}^{- {\rm j}\hspace{0.05cm} 2 \pi f \hspace{0.02cm} \lambda T} = {1}/{T} \cdot |G_s(f)|^2 \cdot \sum_{\lambda = -\infty}^{+\infty}\varphi_a(\lambda)\cdot \cos ( 2 \pi f \lambda T)\hspace{0.05cm}.$$
Hierbei ist berücksichtigt, dass ${\it \Phi}_s(f)$ und $|G_s(f)|^2$ reellwertig sind und gleichzeitig $\varphi_a(-\lambda) =\varphi_a(+\lambda)$ gilt.
Definiert man nun die spektrale Leistungsdichte der Amplitudenkoeffizienten zu
- $${\it \Phi}_a(f) = \sum_{\lambda = -\infty}^{+\infty}\varphi_a(\lambda)\cdot {\rm e}^{- {\rm j}\hspace{0.05cm} 2 \pi f \hspace{0.02cm} \lambda \hspace{0.02cm}T} = \varphi_a(0) + 2 \cdot \sum_{\lambda = 1}^{\infty}\varphi_a(\lambda)\cdot\cos ( 2 \pi f \lambda T) \hspace{0.05cm},$$
so erhält man den folgenden Ausdruck:
- $${\it \Phi}_s(f) = {\it \Phi}_a(f) \cdot {1}/{T} \cdot |G_s(f)|^2 \hspace{0.05cm}.$$
$\text{Fazit:}$ Das Leistungsdichtespektrum ${\it \Phi}_s(f)$ eines Digitalsignals $s(t)$ kann als Produkt zweier Funktionen dargestellt werden::
- Der erste Term ${\it \Phi}_a(f)$ ist dimensionslos und beschreibt die spektrale Formung des Sendesignals durch die statistischen Bindungen der Quelle.
- Dagegen berücksichtigt $\vert G_s(f) \vert^2$ die spektrale Formung durch den Sendegrundimpuls $g_s(t)$. Je schmaler dieser ist, desto breiter ist $\vert G_s(f) \vert^2$ und um so größer ist damit der Bandbreitenbedarf.
- Das Energiespektrum hat die Einheit $\rm V^2s/Hz$ und das Leistungsdichtespektrum – aufgrund der Division durch den Symbolabstand $T$ – die Einheit $\rm V^2/Hz$. Beide Angaben gelten wieder nur für den Widerstand $1 \ \rm \Omega$.
AKF und LDS bei bipolaren Binärsignalen
Die bisherigen Ergebnisse werden nun an Beispielen verdeutlicht. Ausgehend von binären bipolaren Amplitudenkoeffizienten $a_\nu \in \{-1, +1\}$ erhält man, falls keine Bindungen zwischen den einzelnen Amplitudenkoeffizienten $a_\nu$ bestehen:
- $$\varphi_a(\lambda) = \left\{ \begin{array}{c} 1 \\ 0 \\ \end{array} \right.\quad \begin{array}{*{1}c} {\rm{f\ddot{u}r}}\\ {\rm{f\ddot{u}r}} \\ \end{array} \begin{array}{*{20}c}\lambda = 0, \\ \lambda \ne 0 \\ \end{array} \hspace{0.5cm}\Rightarrow \hspace{0.5cm}\varphi_s(\tau)= {1}/{T} \cdot \varphi^{^{\bullet}}_{gs}(\tau)\hspace{0.05cm}.$$
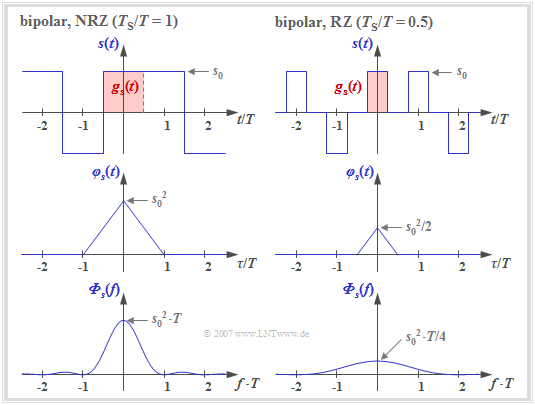
Die Grafik zeigt zwei Signalausschnitte jeweils mit Rechteckimpulsen $g_s(t)$, die dementsprechend zu einer dreieckförmigen AKF und zu einem $\rm si^2$–förmigen Leistungsdichtespektrum (LDS) führen.
- Die linken Bilder beschreiben eine NRZ–Signalisierung. Das heißt: Die Breite $T_{\rm S}$ des Grundimpulses ist gleich dem Abstand $T$ zweier Sendeimpulse (Quellensymbole).
- Dagegen gelten die rechten Bilder für einen RZ–Impuls mit dem Tastverhältnis $T_{\rm S}/T = 0.5$.
Man erkennt aus diesen Darstellungen:
- Bei NRZ–Rechteckimpulsen ergibt sich für die (auf den Widerstand $1 \ \rm \Omega$ bezogene) Sendeleistung $P_{\rm S} = \varphi_s(\tau = 0) = s_0^2$ und die dreieckförmige AKF ist auf den Bereich $|\tau| \le T_{\rm S}= T$ beschränkt.
- Das LDS ${\it \Phi}_s(f)$ als die Fouriertransformierte von $\varphi_s(\tau)$ ist $\rm si^2$–förmig mit äquidistanten Nullstellen im Abstand $1/T$. Die Fläche unter der LDS–Kurve ergibt wiederum die Sendeleistung $P_{\rm S} = s_0^2$.
- Im Fall der RZ–Signalisierung (rechte Rubrik) ist die dreieckförmige AKF gegenüber dem linken Bild in Höhe und Breite jeweils um den Faktor $T_{\rm S}/T = 0.5$ kleiner.
$\text{Fazit:}$ Vergleicht man die beiden Leistungsdichtespektren (untere Bilder), so erkennt man für $T_{\rm S}/T = 0.5$ (RZ–Impuls) gegenüber $T_{\rm S}/T = 1$ (NRZ–Impuls) eine Verkleinerung in der Höhe um den Faktor $4$ und eine Verbreiterung um den Faktor $2$. Die Fläche (Leistung) ist somit halb so groß, da in der Hälfte der Zeit $s(t) = 0$ gilt.
AKF und LDS bei unipolaren Binärsignalen
Wir gehen weiterhin von NRZ– bzw. RZ–Rechteckimpulsen aus. Die binären Amplitudenkoeffizienten seien aber nun unipolar: $a_\nu \in \{0, 1\}$.
Dann gilt für die diskrete AKF der Amplitudenkoeffizienten:
- $$\varphi_a(\lambda) = \left\{ \begin{array}{c} m_2 = 0.5 \\ \\ m_1^2 = 0.25 \\ \end{array} \right.\quad \begin{array}{*{1}c} {\rm{f\ddot{u}r}}\\ \\ {\rm{f\ddot{u}r}} \\ \end{array} \begin{array}{*{20}c}\lambda = 0, \\ \\ \lambda \ne 0 \hspace{0.05cm}.\\ \end{array}$$
Vorausgesetzt sind hier gleichwahrscheinliche Amplitudenkoeffizienten ⇒ ${\rm Pr}(a_\nu =0) = {\rm Pr}(a_\nu =1) = 0.5$ ohne statistische Bindungen, so dass sowohl der quadratische Mittelwert $m_2$ (Leistung) als auch der lineare Mittelwert $m_1$ (Gleichanteil) jeweils $0.5$ sind.
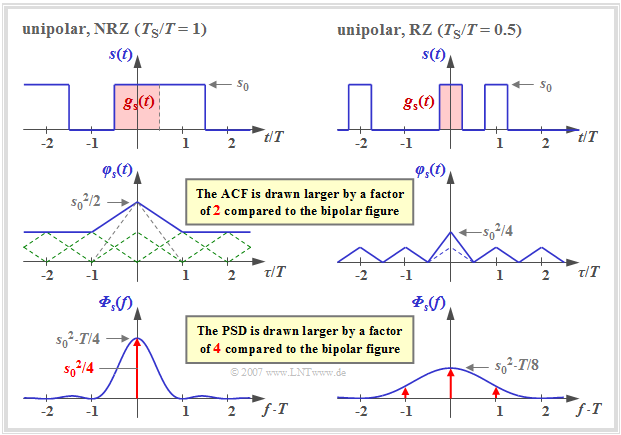
Die Grafik zeigt einen Signalausschnitt, die AKF und das LDS mit unipolaren Amplitudenkoeffizienten,
- links für rechteckförmige NRZ–Impulse $(T_{\rm S}/T = 1)$ , und
- rechts für RZ–Impulse mit dem Tastverhältnis $T_{\rm S}/T = 0.5$.
Es gibt folgende Unterschiede gegenüber bipolarer Signalisierung:
- Durch die Addition der unendlich vielen Dreieckfunktionen im Abstand $T$, alle mit gleicher Höhe, ergibt sich für die AKF in der linken Grafik (NRZ) ein konstanter Gleichanteil $s_0^2/4$.
- Daneben verbleibt im Bereich $|\tau| \le T_{\rm S}$ ein einzelnes Dreieck ebenfalls mit Höhe $s_0^2/4$, das im Leistungsdichtespektrum (LDS) zum $\rm si^2$–förmigen Verlauf führt (blaue Kurve).
- Der Gleichanteil in der AKF hat im LDS eine Diracfunktion bei der Frequenz $f = 0$ mit dem Gewicht $s_0^2/4$ zur Folge. Dadurch wird der LDS–Wert ${\it \Phi}_s(f=0)$ unendlich groß.
Aus der rechten Grafik – gültig für $T_{\rm S}/T = 0.5$ – erkennt man, dass sich nun die AKF aus einem periodischen Dreiecksverlauf (im mittleren Bereich gestrichelt eingezeichnet) und zusätzlich noch aus einem einmaligen Dreieck im Bereich $|\tau| \le T_{\rm S} = T/2$ mit Höhe $s_0^2/8$ zusammensetzt.
- Diese einmalige Dreieckfunktion führt zum kontinuierlichen, $\rm si^2$–förmigen Anteil (blaue Kurve) von ${\it \Phi}_s(f)$ mit der ersten Nullstelle bei $1/T_{\rm S} = 2/T$.
- Dagegen führt die periodische Dreieckfunktion nach den Gesetzmäßigkeiten der Fourierreihe zu einer unendlichen Summe von Diracfunktionen mit unterschiedlichen Gewichten im Abstand $1/T$ (rot gezeichnet).
- Die Gewichte der Diracfunktionen sind proportional zum kontinuierlichen (blauen) LDS–Anteil. Das maximale Gewicht $s_0^2/8$ besitzt die Diraclinie bei $f = 0$. Dagegen sind die Diraclinien bei $\pm 2/T$ und Vielfachen davon nicht vorhanden bzw. besitzen jeweils das Gewicht $0$, da hier auch der kontinuierliche LDS–Anteil Nullstellen besitzt.
$\text{Hinweis:}$
- Unipolare Amplitudenkoeffizienten treten zum Beispiel bei optischen Übertragungssystemen auf.
- In späteren Kapiteln beschränken wir uns aber meist auf die bipolare Signalisierung.
Aufgaben zum Kapitel
Aufgabe 2.1: AKF und LDS nach Codierung
Aufgabe 2.1Z: Zur äquivalenten Bitrate
Aufgabe: 2.2 Binäre bipolare Rechtecke


