Contents
- 1 Definition of the bit error probability
- 2 Definition of the bit error rate
- 3 Bit error probability and bit error rate in the BSC model
- 4 Error probability with Gaussian noise
- 5 Optimal binary receiver – "Matched Filter" realization
- 6 Optimal binary receiver – "Integrate & Dump" realization
- 7 Interpretation des optimalen Empfängers
- 8 Aufgaben zum Kapitel
- 9 Quellenverzeichnis
Definition of the bit error probability
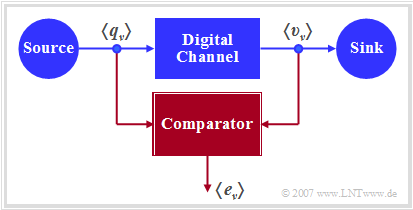
The diagram shows a very simple, but generally valid model of a binary transmission system. This can be characterized as follows:
- Source and sink are described by the two binary sequences $〈q_ν〉$ and $〈v_ν〉$.
- The entire transmission system – consisting of transmitter, transmission channel including interference and receiver – is regarded as a "Black Box" with binary input and binary output.
- This "digital channel" is characterized solely by the error sequence $〈e_ν〉$. If the $\nu$–th bit is transmitted without errors $(v_ν = q_ν)$, $e_ν= 0$ is valid, otherwise $(v_ν \ne q_ν)$ $e_ν= 1$ is set.
$\text{Definition:}$ The (average) bit error probability for a binary system is given as follows:
- $$p_{\rm B} = {\rm E}\big[{\rm Pr}(v_{\nu} \ne q_{\nu})\big]= \overline{ {\rm Pr}(v_{\nu} \ne q_{\nu}) } = \lim_{N \to\infty}\frac{1}{N}\cdot\sum\limits_{\nu=1}^{N}{\rm Pr}(v_{\nu} \ne q_{\nu})\hspace{0.05cm}.$$
This statistical quantity is the most important evaluation criterion of any digital system.
- The calculation as expected value $\rm E[\text{...}]$ according to the first part of the above equation corresponds to a ensemble averaging over the falsification probability ${\rm Pr}(v_{\nu} \ne q_{\nu})$ of the $\nu$–th symbol, while the line in the right part of the equation marks a time averaging.
- Both types of calculation lead – under the justified assumption of ergodic processes – to the same result, as shown in the fourth main chapter "Random Variables with Statistical Dependence" of the book Stochastische Signaltheorie.
- Also from the error sequence $〈e_ν〉$ the bit error probability can be determined as an expected value, taking into account that the error quantity $e_ν$ can only take the values $0$ and $1$:
- $$\it p_{\rm B} = \rm E\big[\rm Pr(\it e_{\nu}=\rm 1)\big]= {\rm E}\big[{\it e_{\nu}}\big]\hspace{0.05cm}.$$
- The above definition of the bit error probability applies whether or not there are statistical bindings within the error sequence $〈e_ν〉$. Depending on this, one has to use different digital channel models in a system simulation. The complexity of the $p_{\rm B}$ calculation depends on this.
In the fifth main chapter it will be shown that the so-called BSC model (Binary Symmetrical Channel) provides statistically independent errors, while for the description of bundle error channels one has to resort to the models of Gilbert–Elliott [Gil60][1] and of McCullough [McC68][2].
Definition of the bit error rate
The bit error probability $p_{\rm B}$, for example, is well suited for the design and optimization of digital systems. It is an a priori parameter, which allows a prediction about the error behavior of a message system without having to realize it already.
In contrast, to measure the quality of a realized system or in a system simulation, one must switch to the bit error rate, which is determined by comparing the source symbol sequence $〈q_ν〉$ and sink symbol sequence $〈v_ν〉$. This is thus an a posteriori parameter of the system.
$\text{Definition:}$ The bit error rate (BER) is the ratio of the number $n_{\rm B}(N)$ of bit errors $(v_ν \ne q_ν)$ and the number $N$ of transmitted symbols:
- $$h_{\rm B}(N) = \frac{n_{\rm B}(N)}{N} \hspace{0.05cm}.$$
In terms of probability theory, the bit error rate is a relative frequency; therefore, it is also called bit error frequency.
- The notation $h_{\rm B}(N)$ is intended to make clear that the bit error rate determined by measurement or simulation depends significantly on the parameter $N$ – i.e. the total number of transmitted or simulated symbols.
- According to the elementary laws of probability theory, only in the limiting case $N \to \infty$ the a posteriori parameter $h_{\rm B}(N)$ coincides exactly with the a priori parameter $p_{\rm B}$.
The connection between probability and relative frequency is clarified in the learning video Bernoullisches Gesetz der großen Zahlen.
Bit error probability and bit error rate in the BSC model
The following derivations are based on the BSC model (Binary Symmetric Channel ), which is described in detail in chapter 5.2.
- Each bit is distorted with probability $p = {\rm Pr}(v_{\nu} \ne q_{\nu}) = {\rm Pr}(e_{\nu} = 1)$, independent of the error probabilities of the neighboring symbols.
- Thus, the (average) bit error probability $p_{\rm B}$ is also equal to $p$.
Now we estimate how accurately in the BSC model the bit error probability $p_{\rm B} = p$ is approximated by the bit error rate $h_{\rm B}(N)$:
- The number of bit errors in the transmission of $N$ symbols is a discrete random quantity:
- $$n_{\rm B}(N) = \sum\limits_{\it \nu=\rm 1}^{\it N} e_{\nu} \hspace{0.2cm} \in \hspace{0.2cm} \{0, 1, \hspace{0.05cm}\text{...} \hspace{0.05cm} , N \}\hspace{0.05cm}.$$
- In the case of statistically independent errors (BSC model), $n_{\rm B}(N)$ is binomially distributed. Consequently, the mean and dispersion of this random variable are:
- $$m_{n{\rm B}}=N \cdot p_{\rm B},\hspace{0.2cm}\sigma_{n{\rm B}}=\sqrt{N\cdot p_{\rm B}\cdot (\rm 1- \it p_{\rm B})}\hspace{0.05cm}.$$
- Therefore, for mean and dispersion of bit error rate $h_{\rm B}(N)= n_{\rm B}(N)/N$ holds\[m_{h{\rm B}}= \frac{m_{n{\rm B}}}{N} = p_{\rm B}\hspace{0.05cm},\hspace{0.2cm}\sigma_{h{\rm B}}= \frac{\sigma_{n{\rm B}}}{N}= \sqrt{\frac{ p_{\rm B}\cdot (\rm 1- \it p_{\rm B})}{N}}\hspace{0.05cm}.\]
- However, according to Moivre and Laplace the binomial distribution can be approximated by a Gaussian distribution:
- $$f_{h{\rm B}}({h_{\rm B}}) \approx \frac{1}{\sqrt{2\pi}\cdot\sigma_{h{\rm B}}}\cdot {\rm e}^{-(h_{\rm B}-p_{\rm B})^2/(2 \hspace{0.05cm}\cdot \hspace{0.05cm}\sigma_{h{\rm B}}^2)}.$$
- Using the Gaussian error integral ${\rm Q}(x)$, the probability $p_\varepsilon$ can be calculated that the bit error rate $h_{\rm B}(N)$ determined by simulation/measurement over $N$ symbols differs in amount by less than one value $\varepsilon$ from the actual bit error probability $p_{\rm B}$:
- $$p_{\varepsilon}= {\rm Pr} \left( |h_{\rm B}(N) - p_{\rm B}| < \varepsilon \right) = 1 -2 \cdot {\rm Q} \left( \frac{\varepsilon}{\sigma_{h{\rm B}}} \right)= 1 -2 \cdot {\rm Q} \left( \frac{\varepsilon \cdot \sqrt{N}}{\sqrt{p_{\rm B} \cdot (1-p_{\rm B})}} \right)\hspace{0.05cm}.$$
$\text{Conclusion:}$ This result can be interpreted as follows:
- If one performs an infinite number of test series over $N$ symbols each, the mean value $m_{h{\rm B} }$ is actually equal to the sought error probability $p_{\rm B}$.
- With a single test series, on the other hand, one will only obtain an approximation, whereby the respective deviation from the nominal value is Gaussian distributed with several test series.
$\text{Example 1:}$ The bit error probability is $p_{\rm B}= 10^{-3}$ and it is known that the bit errors are statistically independent.
- If we now make a large number of test series with $N= 10^{5}$ symbols each, the respective results $h_{\rm B}(N)$ will vary around the nominal value $10^{-3}$ according to a Gaussian distribution.
- The root mean square here is $\sigma_{h{\rm B} }= \sqrt{ { p_{\rm B}\cdot (\rm 1- \it p_{\rm B})}/{N} }\approx 10^{-4}\hspace{0.05cm}.$
- Thus, the probability that the relative frequency will have a value between $0.9 \cdot 10^{-3}$ and $1.1 \cdot 10^{-3}$ $(\varepsilon=10^{-4})$ is equal to
- $$p_{\varepsilon} = 1 - 2 \cdot {\rm Q} \left({\varepsilon}/{\sigma_{h{\rm B} } } \right )= 1 - 2 \cdot {\rm Q} (1) \approx 68.4\%.$$
- If this probability (accuracy) is to be increased to $95\%$, $N = 400\hspace{0.05cm}000$ symbols would be required.
Error probability with Gaussian noise
According to the prerequisites to this chapter, we make the following assumptions:
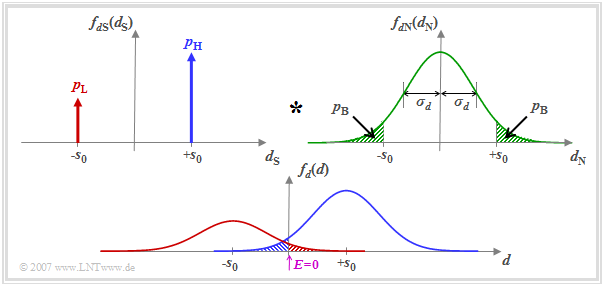
- The detection signal at the detection times can be represented as follows: $ d(\nu T) = d_{\rm S}(\nu T)+d_{\rm N}(\nu T)\hspace{0.05cm}. $
- The useful component is described by the probability density function (PDF) $f_{d{\rm S}}(d_{\rm S}) $, where we assume here different occurrence probabilities $p_{\rm L} = {\rm Pr}(d_{\rm S} = -s_0)$ and $p_{\rm H} = {\rm Pr}(d_{\rm S} = +s_0)= 1-p_{\rm L}$.
- Let the PDF $f_{d{\rm N}}(d_{\rm N})$ of the interference component be Gaussian and possess the standard deviation $\sigma_d$.
Assuming that $d_{\rm S}(\nu T)$ and $d_{\rm N}(\nu T)$ are statistically independent of each other ("signal independent noise"), the PDF $f_d(d) $ of the detection samples $d(\nu T)$ is obtained as the convolution product
- $$f_d(d) = f_{d{\rm S}}(d_{\rm S}) \star f_{d{\rm N}}(d_{\rm N})\hspace{0.05cm}.$$
The threshold decision with threshold $E = 0$ makes a wrong decision whenever
- the symbol $\rm L$ was sent $(d_{\rm S} = -s_0)$ and $d > 0$ (red shaded area), or
- the symbol $\rm H$ was sent $(d_{\rm S} = +s_0)$ and $d < 0$ (blue shaded area).
Since the areas of the red and blue Gaussian curves add up to $1$, the sum of the red and blue shaded areas gives the bit error probability $p_{\rm B}$. The two green shaded areas in the upper probability density function $f_{d{\rm N}}(d_{\rm N})$ are – each separately – also equal to $p_{\rm B}$.
The results illustrated by the diagram are now to be derived as formulas. We start from the equation
- $$p_{\rm B} = p_{\rm L} \cdot {\rm Pr}( v_\nu = \mathbf{H}\hspace{0.1cm}|\hspace{0.1cm} q_\nu = \mathbf{L})+ p_{\rm H} \cdot {\rm Pr}(v_\nu = \mathbf{L}\hspace{0.1cm}|\hspace{0.1cm} q_\nu = \mathbf{H})\hspace{0.05cm}.$$
- Here $p_{\rm L} $ and $p_{\rm H} $ are the source symbol probabilities. The respective second (conditional) probabilities $ {\rm Pr}( v_\nu \hspace{0.05cm}|\hspace{0.05cm} q_\nu)$ describe the distortions due to the AWGN channel. From the decision rule of the threshold decision $($with threshold $E = 0)$ also results:
- $$p_{\rm B} = p_{\rm L} \cdot {\rm Pr}( d(\nu T)>0)+ p_{\rm H} \cdot {\rm Pr}( d(\nu T)<0) =p_{\rm L} \cdot {\rm Pr}( d_{\rm N}(\nu T)>+s_0)+ p_{\rm H} \cdot {\rm Pr}( d_{\rm N}(\nu T)<-s_0) \hspace{0.05cm}.$$
- The two exceedance probabilities in the above equation are equal due to the symmetry of the Gaussian PDF $f_{d{\rm N}}(d_{\rm N})$. It holds:
- $$p_{\rm B} = (p_{\rm L} + p_{\rm H}) \cdot {\rm Pr}( d_{\rm N}(\nu T)>s_0) = {\rm Pr}( d_{\rm N}(\nu T)>s_0)\hspace{0.05cm}.$$
- This means: $p_{\rm B}$ does not depend on the symbol probabilities $p_{\rm L} $ and $p_{\rm H} = 1- p_{\rm L}$ for a binary system with threshold $E = 0$.
- The probability that the AWGN noise term $d_{\rm N}$ with standard deviation $\sigma_d$ is larger than the NRZ transmitted pulse amplitude $s_0$ is thus given by:
- $$p_{\rm B} = \int_{s_0}^{+\infty}f_{d{\rm N}}(d_{\rm N})\,{\rm d} d_{\rm N} = \frac{\rm 1}{\sqrt{2\pi} \cdot \sigma_d}\int_{ s_0}^{+\infty}{\rm e} ^{-d_{\rm N}^2/(2\sigma_d^2) }\,{\rm d} d_{\rm N}\hspace{0.05cm}.$$
- Using the complementary Gaussian error integral ${\rm Q}(x)$, the result is:
- $$p_{\rm B} = {\rm Q} \left( \frac{s_0}{\sigma_d}\right)\hspace{0.4cm}{\rm mit}\hspace{0.4cm}\rm Q (\it x) = \frac{\rm 1}{\sqrt{\rm 2\pi}}\int_{\it x}^{+\infty}\rm e^{\it -u^{\rm 2}/\rm 2}\,d \it u \hspace{0.05cm}.$$
- Often – especially in the English-language literature – the comparable complementary error function ${\rm erfc}(x)$ is used instead of ${\rm Q}(x)$. With this applies:
- $$p_{\rm B} = {1}/{2} \cdot {\rm erfc} \left( \frac{s_0}{\sqrt{2}\cdot \sigma_d}\right)\hspace{0.4cm}{\rm mit}\hspace{0.4cm} {\rm erfc} (\it x) = \frac{\rm 2}{\sqrt{\rm \pi}}\int_{\it x}^{+\infty}\rm e^{\it -u^{\rm 2}}\,d \it u \hspace{0.05cm}.$$
Both functions can be found in formula collections in tabular form. However, you can also use our interactive applet Complementary Gaussian Error Functions to calculate the function values of ${\rm Q}(x)$ and $1/2 \cdot {\rm erfc}(x)$.
$\text{Example 2:}$ For the following, we assume that tables are available listing the argument of the Gaussian error functions at $0.1$ intervals. With $s_0/\sigma_d = 4$, we obtain for the bit error probability according to the Q–function:
- $$p_{\rm B} = {\rm Q} (4) = 0.317 \cdot 10^{-4}\hspace{0.05cm}.$$
According to the second equation we get:
- $$p_{\rm B} = {1}/{2} \cdot {\rm erfc} ( {4}/{\sqrt{2} })= {1}/{2} \cdot {\rm erfc} ( 2.828)\approx {1}/{2} \cdot {\rm erfc} ( 2.8)= 0.375 \cdot 10^{-4}\hspace{0.05cm}.$$
- The first value is correct. With the second calculation method, you have to round or – even better – interpolate, which is very difficult due to the strong non-linearity of this function.
- With the given numerical values, the Q–function is therefore more suitable. Outside of exercise examples, $s_0/\sigma_d$ will usually have a "curved" value. In this case, of course, the Q–function offers no advantage over ${\rm erfc}(x)$.
Optimal binary receiver – "Matched Filter" realization
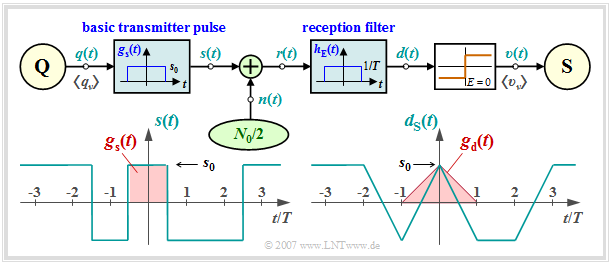
Wir gehen weiter von den vorne festgelegten Voraussetzungen aus.
- Dann kann man für den Frequenzgang und die Impulsantwort des Empfängerfilters ansetzen:
- $$H_{\rm E}(f) = {\rm si}(\pi f T) \hspace{0.4cm}\bullet\!\!-\!\!\!-\!\!\!-\!\!\circ \hspace{0.4cm} h_{\rm E}(t) = \left\{ \begin{array}{c} 1/T \\ 1/(2T) \\ 0 \\ \end{array} \right.\quad \begin{array}{*{1}c} {\rm{f\ddot{u}r}} \\ {\rm{f\ddot{u}r}} \\ {\rm{f\ddot{u}r}} \\ \end{array}\begin{array}{*{20}c} |\hspace{0.05cm}t\hspace{0.05cm}|< T/2 \hspace{0.05cm},\\ |\hspace{0.05cm}t\hspace{0.05cm}|= T/2 \hspace{0.05cm},\\ |\hspace{0.05cm}t\hspace{0.05cm}|>T/2 \hspace{0.05cm}. \\ \end{array}$$
- Aufgrund der Linearität kann für das Detektionsnutzsignal geschrieben werden:
- $$d_{\rm S}(t) = \sum_{(\nu)} a_\nu \cdot g_d ( t - \nu \cdot T)\hspace{0.4cm}{\rm mit}\hspace{0.4cm}g_d(t) = g_s(t) \star h_{\rm E}(t) \hspace{0.05cm}.$$
- Die Faltung zweier Rechtecke gleicher Breite $T$ und Höhe $s_0$ ergibt einen dreieckförmigen Detektionsgrundimpuls $g_d(t)$ mit $g_d(t = 0) = s_0$. Wegen $g_d(|t| \ge 0) \equiv 0$ ist das System impulsinterferenzfrei; es gilt $d_{\rm S}(\nu T)= \pm s_0$.
- Die Varianz des Detektionsstörsignals $d_{\rm N}(t)$ – also die Detektionsstörleistung – lautet:
- $$\sigma _d ^2 = \frac{N_0 }{2} \cdot \int_{ - \infty }^{ + \infty } {\left| {H_{\rm E}( f )} \right|^2 \hspace{0.1cm}{\rm{d}}f} = \frac{N_0 }{2} \cdot \int_{- \infty }^{+ \infty } {\rm si}^2(\pi f T)\hspace{0.1cm}{\rm{d}}f = \frac{N_0 }{2T} \hspace{0.05cm}.$$
- Damit ergeben sich für die Bitfehlerwahrscheinlichkeit entsprechend der letzten Seite die beiden äquivalenten Gleichungen:
- $$p_{\rm B} = {\rm Q} \left( \sqrt{\frac{2 \cdot s_0^2 \cdot T}{N_0}}\right)= {\rm Q} \left( \sqrt{\rho_d}\right)\hspace{0.05cm},\hspace{0.5cm} p_{\rm B} = {1}/{2} \cdot {\rm erfc} \left( \sqrt{{ s_0^2 \cdot T}/{N_0}}\right)= {1}/{2}\cdot {\rm erfc}\left( \sqrt{{\rho_d}/{2}}\right) \hspace{0.05cm}.$$
$\text{Definition:}$ Verwendet ist das momentane Signal–zu–Stör–Leistungsverhältnis (SNR) $\rho_d$ des Detektionssignals $d(t)$ zu den Zeiten $\nu T$, kurz Detektions–SNR:
- $$\rho_d = \frac{d_{\rm S}^2(\nu T)}{ {\rm E}\big[d_{\rm N}^2(\nu T)\big ]}= \frac{s_0^2}{\sigma _d ^2} \hspace{0.05cm}.$$
Ein Vergleich dieses Ergebnisses mit der Seite Optimierungskriterium des Matched-Filters im Buch "Stochastische Signaltheorie" zeigt, dass das Empfangsfilter
$H_{\rm E}(f)$ ein an den Sendegrundimpuls $g_s(t)$ angepasstes Matched–Filter ist:
- $$H_{\rm E}(f) = H_{\rm MF}(f) = K_{\rm MF}\cdot G_s^*(f)\hspace{0.05cm}.$$
Gegenüber der Seite Matched–Filter–Optimierung sind hier folgende Modifikationen berücksichtigt:
- Die Matched–Filter–Konstante ist hier zu $K_{\rm MF} = 1/(s_0 \cdot T)$ gesetzt. Damit ist der Frequenzgang $ H_{\rm MF}(f)$ dimensionslos.
- Der im allgemeinen frei wählbare Detektionszeitpunkt ist hier zu $T_{\rm D} = 0$ gewählt. Damit ergibt sich allerdings ein akausales Filter.
- Das Detektions–SNR kann für jeden beliebigen Sendegrundimpuls $g_s(t)$ mit Spektrum $G_s(f)$ wie folgt dargestellt werden, wobei sich die rechte Identität aus dem Parsevalschen Theorem ergibt:
- $$\rho_d = \frac{2 \cdot E_{\rm B}}{N_0}\hspace{0.4cm}{\rm mit}\hspace{0.4cm} E_{\rm B} = \int^{+\infty} _{-\infty} g_s^2(t)\,{\rm d}t = \int^{+\infty} _{-\infty} |G_s(f)|^2\,{\rm d}f\hspace{0.05cm}.$$
- $E_{\rm B}$ wird oft als Energie pro Bit bezeichnet und $E_{\rm B}/N_0$ – fälschlicherweise – als $\rm SNR$. Wie aus der letzten Gleichung ersichtlich ist, unterscheidet sich nämlich bei binärer Basisbandübertragung $E_{\rm B}/N_0$ vom Detektions–SNR $\rho_d$ um den Faktor $2$.
$\text{Fazit:}$ Die hier hergeleitete Bitfehlerwahrscheinlichkeit des optimalen Binärempfängers kann somit auch wie folgt geschrieben werden:
- $$p_{\rm B} = {\rm Q} \left( \sqrt{ {2 \cdot E_{\rm B} }/{N_0} }\right)= {1}/{2} \cdot{\rm erfc} \left( \sqrt{ {E_{\rm B} }/{N_0} }\right) \hspace{0.05cm}.$$
Diese Gleichung gilt sowohl für die Realisierung mit Matched-Filter als auch für die Realisierungsform „Integrate & Dump” (siehe nächste Seite).
Zur Verdeutlichung der hier behandelten Thematik weisen wir auf unser Interaktionsmodul Zur Verdeutlichung des Matched-Filters hin.
Optimal binary receiver – "Integrate & Dump" realization
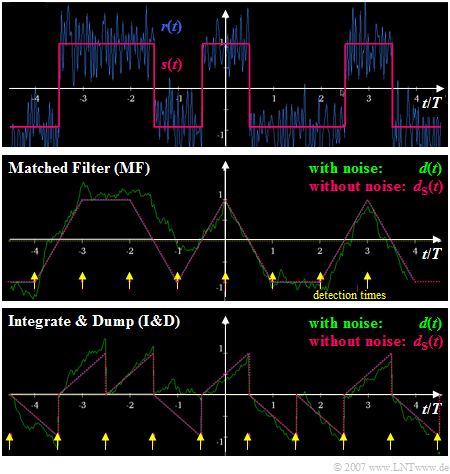
Bei rechteckförmigen NRZ–Sendeimpulsen kann das Matched–Filter auch als Integrator $($jeweils über eine Symboldauer $T)$ realisiert werden. Damit gilt für das Detektionssignal zu den Detektionszeitpunkten:
- $$d(\nu \cdot T + T/2) = \frac {1}{T} \cdot \int^{\nu \cdot T + T/2} _{\nu \cdot T - T/2} r(t)\,{\rm d}t \hspace{0.05cm}.$$
Die Grafik verdeutlicht die Unterschiede bei der Realisierung des optimalen Binärempfängers
- mit Matched–Filter $\rm (MF)$ ⇒ mittlere Skizze, bzw.
- als "Integrate & Dump" $\rm (I\&D)$ ⇒ untere Skizze.
Man erkennt aus diesen Signalverläufen:
- Das Detektionsnutzsignal $d_{\rm S}(t)$ ist zu den Detektionszeitpunkten ⇒ gelbe Markierungen $\rm (MF$: bei $\nu \cdot T$, $\rm I\&D$: bei $\nu \cdot T +T/2$ in beiden Fällen gleich $\pm s_0$.
- Die unterschiedlichen Detektionszeitpunkte sind darauf zurückzuführen, dass das Matched–Filter im Gegensatz zu "Integrate & Dump" als akausal angesetzt wurde (siehe letzte Seite).
- Beim Matched–Filter–Empfänger ist die Varianz des Detektionsstörsignals zu allen Zeiten $t$ gleich: ${\rm E}\big[d_{\rm N}^2(t)\big]= {\sigma _d ^2} = {\rm const.}$ Dagegen nimmt beim I&D–Empfänger die Varianz von Symbolanfang bis Symbolende zu.
- Zu den gelb markierten Zeitpunkten ist die Detektionsstörleistung in beiden Fällen gleich, so dass sich die gleiche Bitfehlerwahrscheinlichkeit ergibt. Mit $E_{\rm B} = s_0^2 \cdot T$ gilt wieder:
- $$\sigma _d ^2 = \frac{N_0}{2} \cdot \int_{- \infty }^{ +\infty } {\rm si}^2(\pi f T)\hspace{0.1cm}{\rm{d}}f = \frac{N_0}{2T} $$
- $$\Rightarrow \hspace{0.3cm} p_{\rm B} = {\rm Q} \left( \sqrt{ s_0^2 / \sigma _d ^2} \right)= {\rm Q} \left( \sqrt{{2 \cdot E_{\rm B}}/{N_0}}\right) .$$
Interpretation des optimalen Empfängers
In diesem Abschnitt wurde gezeigt, dass mit einem Empfänger, bestehend aus linearem Empfangsfilter und nichtlinearem Entscheider, die kleinstmögliche Bitfehlerwahrscheinlichkeit zu erreichen ist:
- $$ p_{\rm B, \hspace{0.05cm}min} = {\rm Q} \left( \sqrt{{2 \cdot E_{\rm B}}/{N_0}}\right) = {1}/{2} \cdot {\rm erfc} \left( \sqrt{{ E_{\rm B}}/{N_0}}\right) \hspace{0.05cm}.$$
Die sich ergebende Konfiguration ist ein Sonderfall des so genannten Maximum–Aposteriori–Empfängers (MAP), der im Abschnitt Optimale Empfängerstrategien im dritten Hauptkapitel dieses Buches behandelt wird.
Für die Gültigkeit obiger Gleichung müssen allerdings eine Reihe von Voraussetzungen erfüllt sein:
- Das Sendesignal $s(t)$ ist binär sowie bipolar (antipodisch) und weist pro Bit die (mittlere) Energie $E_{\rm B}$ auf. Die (mittlere) Sendeleistung ist somit $E_{\rm B}/T$.
- Es liegt ein AWGN–Kanal (Additive White Gaussian Noise ) mit der konstanten (einseitigen) Rauschleistungsdichte $N_0$ vor.
- Das Empfangsfilter $H_{\rm E}(f)$ ist bestmöglich an das Sendegrundimpulsspektrum $G_s(f)$ entsprechend dem "Matched–Filter–Kriterium" angepasst.
- Der Entscheider (Schwellenwert, Detektionszeitpunkte) ist optimal. Eine kausale Realisierung des Matched–Filters kann man durch Verschiebung des Detektionszeitpunktes ausgleichen.
- Obige Gleichung gilt unabhängig vom Sendegrundimpuls $g_s(t)$. Allein die für die Übertragung eines Binärsymbols aufgewendete Energie $E_{\rm B}$ ist neben der Rauschleistungsdichte $N_0$ entscheidend für die Bitfehlerwahrscheinlichkeit $p_{\rm B}$.
- Voraussetzung für die Anwendbarkeit obiger Gleichung ist, dass die Detektion eines Symbols nicht durch andere Symbole beeinträchtigt wird. Solche Impulsinterferenzen vergrößern die Bitfehlerwahrscheinlichkeit $p_{\rm B}$ enorm.
- Ist die absolute Sendeimpulsdauer $T_{\rm S}$ kleiner oder gleich dem Symbolabstand $T$, so ist obige Gleichung bei Erfüllung des Matched-Filter-Kriteriums immer anwendbar.
- Die Gleichung gilt auch für Nyquistsysteme, bei denen zwar $T_{\rm S} > T$ gilt, es aber aufgrund von äquidistanten Nulldurchgängen des Grundimpulses $g_d(t)$ nicht zu Impulsinterferenzen kommt. Damit beschäftigen wir uns im nächsten Kapitel.
Aufgaben zum Kapitel
Aufgabe 1.2: Bitfehlerquote (BER)
Aufgabe 1.2Z: Bitfehlermessung
Aufgabe 1.3: Rechteckfunktionen für Sender und Empfänger
Aufgabe 1.3Z: Schwellenwertoptimierung
Quellenverzeichnis


