Contents
- 1 Possible bandwidth allocations for xDSL
- 2 ADSL bandwidth allocation
- 3 VDSL(2) bandwidth allocation
- 4 Overview of xDSL transmission methods
- 5 Basics of Quadrature Amplitude Modulation
- 6 Possible QAM signal space constellations
- 7 Carrierless Amplitude Phase Modulation
- 8 Basics of Discrete Multitone Transmission
- 9 DMT realization with IDFT/DFT
- 10 Exercises for the chapter
Possible bandwidth allocations for xDSL
The xDSL specifications give operators a great deal of freedom with regard to allocation.
For the necessary directional separation of the xDSL signal transmission according to
- the downstream direction from the provider to the customer $($with the highest possible data rate$)$,
- the upstream direction from the customer to the provider $($with mostly lower data rate$)$,
two variants have been standardized for this purpose:
$\text{Definition:}$
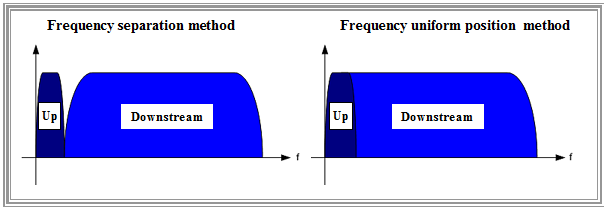
- With the »frequency separation method« the data streams for the two directions are transmitted in two separate frequency bands with the advantage that a simple filter is sufficient to separate the transmission directions, which simplifies the technical implementation.
- With the »frequency uniform position method« the spectra of upstream and downstream overlap in a certain part. The separation is done here with help of an echo cancellation circuit. Advantages of this method: The lower bandwidth requirement at higher $($and thus more attenuated$)$ frequencies and longer range.
The graph compares these two options. Basically, the specifications leave it up to the developers/operators to decide,
- to operate xDSL alone on the subscriber line, or
- to allow mixed operation of xDSL with the telephone services $\rm POTS$ $($"Plain Old Telephone Service"$)$ or $\rm ISDN$ $($"Integrated Services Digital Network"$)$, and
- thus to exclude or also occupy the lower frequency range occupied by the two telephone services for xDSL.
ADSL bandwidth allocation
Since it is technically much easier to realise, the decision in Germany for "ADSL" and "ADSL2+" was in favour of
- of the "frequency separation method", and
- the general reservation of the lower frequency range for ISDN.
The "frequency uniform position method" is still used in some cases, but rather rarely.
The bandwidth available for DSL is not further decomposed for the transmission methods
- $\rm QAM$ $($"Quadrature Amplitude Modulation"$)$ and
- $\rm CAP$ $($"Carrierless Amplitude Phase Modulation$)$.
In contrast, with the multicarrier method $\rm DMT$ $($"Discrete Multitone Transmission"$),$ the uplink and the downlink channel are divided into $N_{\rm Up}$ resp. $N_{\rm Down}$ bins of $4.3125\rm \ kHz $ each.
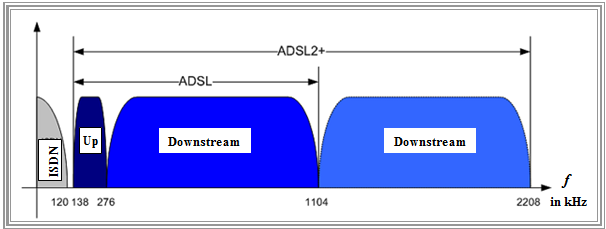
In addition to the above graph, it should be noted:
- Phone services $($POTS or ISDN$)$ and xDSL are in different frequency bands, which minimizes mutual interference in the trunk cable. Thus, the stronger signal ISDN does not interfere with the parallel running xDSL and vice versa.
- The lower frequency range up to $\text{120 kHz}$ has been reserved for ISDN $($optionally POTS$)$. This value results from the first zero of the "ISDN spectrum with 4B3T coding". Above $\text{120 kHz}$ the ISDN spectrum is completely suppressed.
- To separate the telephone and xDSL signals, a "splitter" is used at both ends of the two-wire line, which includes one low-pass filter and one high-pass filter each and also takes into account the following frequency gap up to $\text{138 kHz}$.
- After this occupancy gap follows the ADSL upstream band from $\text{138 kHz}$ to $\text{276 kHz}$. This allows the transmission of $N_{\rm Up} = 32$ subcarriers with bandwidth $\text{4.3125 kHz}$ each. This value is derived from the frame transmission rate.
- The subsequent downstream range extends to $\text{1104 kHz}$ for ADSL, with which $N_{\rm Down} = 256$ subcarriers can be realized. The separation of the upstream and the downstream channel in xDSL is done by a band-pass filter in the modem.
- However, the first $64$ subcarriers $($this corresponds to $\text{276 kHz)}$ must not be occupied. With the "frequency uniform position method" only $32$ subcarriers would have to be left out, taking into account that the separation of uplink and downlink requires a more complex implementation.
- For ADSL2+, the system bandwidth is $\text{2208 kHz}$ ⇒ $N_{\rm Down} = 512$ subcarriers. The number of bins to be spared remains unchanged compared to ADSL. Taking into account that two bins are occupied by control functions $($e.g. for synchronization$)$, $190$ $($ADSL$)$ or $446$ $($ADSL2+$)$ downstream channels remain for users.
- The ISDN reservation prescribed in Germany, however, has the consequence for xDSL that the low frequencies, which are by far the least attenuated in a copper line and would therefore actually be the most suitable, cannot be used.
- Further, from the frequency arrangement, it can be seen that the downstream bins are more attenuated than the upstream bins $($higher frequencies$)$ and consequently have a smaller signal-to-noise ratio $($SNR$)$.
- The decision "upstream below downstream" is related to the fact that the loss of downstream channels has only a comparatively small impact on the transmission rate. In the upstream, such a failure would be much more noticeable in percentage terms.
VDSL(2) bandwidth allocation
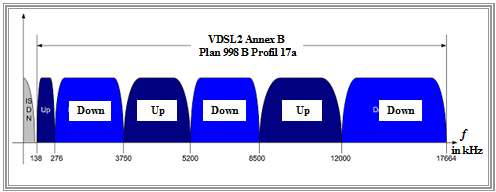
The ITU has defined several profiles for "VDSL(2)". At the time of writing this chapter (2010), the frequency band assignment specified in the graphic applies to the systems deployed in Germany in accordance with the ITU's $\text{ VDSL(2) Plan 998b - Profile 17a (Annex B)}$. The (slightly) lighter coloring at the higher frequencies is meant to indicate that these channels are more attenuated.
Without claiming to be exhaustive, this allocation plan can be characterized as follows:
- To achieve higher bit rates, eight times as many bins are used here as in "ADSL2+".
- Thus, the bandwidth enables $8 \cdot \text{2208 MHz = 17664 MHz}$, transmission rates of up to $\text{100 Mbit/s}$ $($depending on cable length and conditions$)$.
- The same as in ADSL, the frequency bands for the upstream subchannels are always arranged at the lower frequencies, since the greater cable attenuation has a greater percentage influence on the bit rate for upstream than for downstream.
- In VDSL(2), the "frequency separation method" is always used. Overlapping of the upstream and downstream frequency bands is categorically excluded in the ITU specification .
- In the VDSL systems, the lower frequencies are reserved for ISDN. This is followed by alternating ranges for upstream and downstream. From the specified limits, one can recognize the narrower upstream ranges, compared to the downstream.
- You can see an alternating arrangement of upstream and downstream areas. One reason is that with this wide spectrum it should be avoided that one direction $($e.g. downstream$)$ is assigned only strongly attenuated $($high$)$ frequencies.
The VDSL(2) specification provides for allocation plans up to system bandwidths of $\text{30 MHz}$ $($according to profile 30a$)$.
- This should enable transmission rates up to about $\text{ 200 Mbit/s}$ over short distances.
- For this purpose, the bandwidth of the individual subchannels is also doubled compared to ADSL to $\text{8.625 kHz}$ .
Overview of xDSL transmission methods
At the beginning of the various standardization procedures for the individual xDSL variants, different transmission methods were defined as a basis:
- "Quadrature Amplitude Modulation" $\text{QAM}$ for "QAM-ADSL" and "QAM-VDSL",
- "Carrierless Amplitude Phase Modulation" $\text{CAP}$ for "CAP-HDSL" and "CAP-ADSL",
- "Discrete Multitone Transmission" $\text{DMT}$ for "ADSL", "ADSL2", "ADSL2+", "VDSL" and", "VDSL2".
With increasing market demand for higher transmission rates and the associated requirements, two main suitable processes crystallized, namely "QAM/CAP" and "DMT".
Since the manufacturers were unable to agree on a common standard from 1997 to 2003, also for patent reasons $($one even speaks of "line code wars" in this context$)$, the two competing methods coexisted for a long time. At the so-called "DSL Olympics" in 2003, the decision was finally made in favor of DMT,
- on the one hand, because of the slightly better "performance" in general,
- but in particular because of its higher robustness against narrowband interference;
especially for the USA $($many overhead telephone lines and related problems with coupled radio signals$)$ this argument played a major role.
First, however, the systems "QAM-xDSL" and "CAP-xDSL" will be considered very briefly.
Basics of Quadrature Amplitude Modulation
The principle has already been described in detail in the chapter "Quadrature Amplitude Modation" of the book "Modulation Methods".
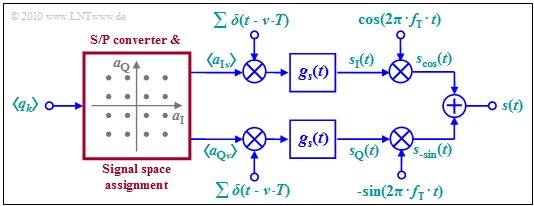
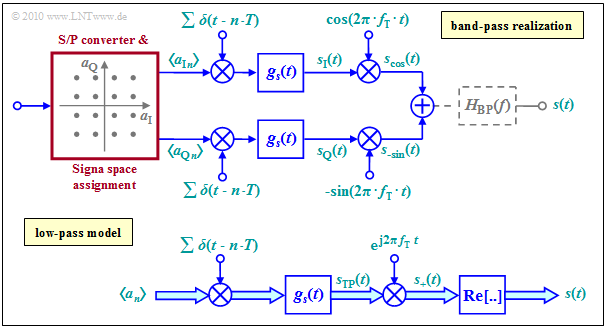
Here follows short summary on the basis of the block diagram on the right:
- QAM is a "single carrier modulation method" around the carrier frequency $f_{\rm T}$. First, a blockwise serial/parallel conversion of the bit stream and signal space assignment is performed.
- From each $b$ binary symbols, two multi-level amplitude coefficients $a_{{\rm I}n}$ and $a_{{\rm Q}n}$ are derived $($"in-phase component" and "quadrature component"$)$. Both coefficients can each take one of $M = 2^{b/2}$ possible amplitude values.
- The example considered here applies to the $\text{16-QAM}$ with $b = M = 4$ and correspondingly sixteen signal space points. For a $\text{256-QAM}$ would hold: $b = 8$ and $M = 16$ $(2^b = M^2 = 256)$.
- The coefficients $a_{{\rm I}n}$ and $a_{{\rm Q}n}$ are each impressed on a Dirac delta impulse as weights. For pulse shaping one usually uses $($because of the small bandwidth$)$ a raised-cosine filter.
- With the basic transmission pulse $g_s(t)$ is then valid in the two branches of the block diagram:
- $$ s_{\rm I}(t) = \sum_{n = - \infty}^{+\infty}a_{\rm I\hspace{0.03cm}\it n} \cdot g_s (t - n \cdot T)\hspace{0.05cm},\hspace{0.5cm} s_{\rm Q}(t) = \sum_{n = - \infty}^{+\infty}a_{\rm Q\hspace{0.03cm}\it n} \cdot g_s (t - n \cdot T)\hspace{0.05cm}.$$
- Note: Because of the redundancy-free conversion to a higher-level code, the symbol duration $T$ of these signals is greater by a factor $b$ than the bit duration $T_{\rm B}$ of the binary input sequence. In the drawn example $($16-QAM$)$, $T = 4 ⋅ T_{\rm B}$.
- The »QAM transmitted signal« $s(t)$ is then the sum of the two partial signals $ s_{\rm I}(t)$ and $ s_{\rm Q}(t)$, multiplied by "cosine" resp. "minus-sine" $($possibly followed by a band limit to prevent interference to adjacent bands, as indicated in the graph below$)$:
- $$s(t) = s_{\rm I}(t) \cdot \cos (2 \pi f_{\rm T}\,t) - s_{\rm Q}(t) \cdot \sin (2 \pi f_{\rm T}\,t) \hspace{0.05cm}. $$
- The two branches $(\rm I$ and $\rm Q)$ can be considered as two completely separate "M–level ASK systems" which do not interfere with each other as long as all components are optimally designed. This means at the same time:
- Compared to a "Binary Phase Shift Keying" $\rm (BPSK)$ modulation with cosine or sine only, the QAM allows a doubling of the data rate at constant quality.
Equivalent low-pass model
The graph on the right shows
- above the band-pass model, identical with the last graph,
- below the "equivalent low-pass model".
Here, the inphase and quadrature coefficients are combined to give the complex amplitude coefficient
- $$a_n = a_{\text{I}n} + {\rm j} ⋅ a_{\text{Q}n}.$$
Additionally, the physical transmitted signal $s(t)$ is replaced by the equivalent low-pass signal
- $$s_{\rm TP}(t) = s_{\rm I}(t) + {\rm j} ⋅ s_{\rm Q}(t).$$
⇒ The representation of the QAM transmitter and receiver is the content of the SWF flash animation "Principle of Quadrature Amplitude Modulation".
$\text{Conclusion:}$
- As the bit number $b$ and thus the number of defined symbols $(M=b^2)$ increases, the bandwidth efficiency increases,
but also the signal processing overhead increases.
- In addition, it must be taken into account that a dense QAM allocation is appropriate only if the channel is sufficiently good.
Reference Model for ADSL-QAM
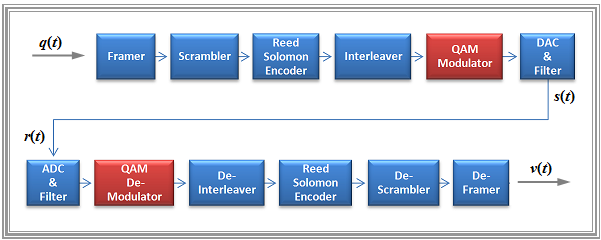
This diagram shows the reference model for "ADSL-QAM", whereby we will only deal with the red function blocks "QAM-Modulator" and "'QAM-Demodulator" here.
- The carrier frequency $f_{\rm T}$ lies within the specified up and down band of the respective xDSL variant.
- Like signal space size $($between $M^2=2^2=4$ and $M^2=2^8=256$ signal space points$)$ and symbol rate, it is determined by channel measurements during transmission initialisation.
- For ADSL-QAM, the following symbol rates have been specified
$($all numerical values in "${\rm kBaud}$" $= 10^3 \rm symbols/s)$ :
- In upstream: $20$, $40$, $84$, $100$, $120$, $136$;
- in downstream: $40$, $126$, $160$, $252$, $336$, $504$, $806.4$, $1008$.
Possible QAM signal space constellations
We still consider possible arrangements of signal space points in quadrature amplitude modulation using three examples.
$\text{Example 1:}$ An important QAM parameter is the bit number $b$ processed to the amplitude coefficient pair $(a_{\rm I}, a_{\rm Q})$. Here $b$ is always an even number.
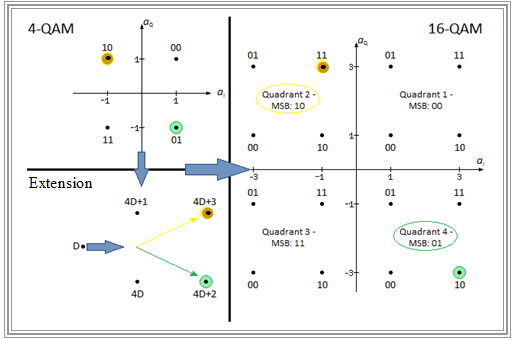
- If $b = 2$, both $a_{\rm I}$ and $a_{\rm Q}$ can only take the values $±1$ resulting in the $\rm 4\hspace{0.05cm}–\hspace{-0.02cm}QAM$ corresponding to the left constellation.
- According to an ITU recommendation, the assignment applies here:
- $$q_1 = 0, \ q_0 = 0 \, \Leftrightarrow \,a_{\rm I} = +1, \ a_{\rm Q} = +1,$$
- $$q_1 = 0, \ q_0 = 1 \, \Leftrightarrow \, a_{\rm I} = +1, \ a_{\rm Q} = -1,$$
- $$q_1 = 1, \ q_0 = 0 \, \Leftrightarrow \,a_{\rm I} = -1, \ a_{\rm Q} = +1,$$
- $$q_1 = 1, \ q_0 = 1 \, \Leftrightarrow \, a_{\rm I} = -1, \ a_{\rm Q} = -1.$$
- The point 10 marked in brown $(a_{\rm I} = -1, \ a_{\rm Q} = 1)$ thus stands for $q_1 = 1$ and $q_0 = 0$.
With $b = 4$ ⇒ $M = 2^{b/2} = 4$ one arrives at "$\rm 16\hspace{0.05cm}–\hspace{-0.02cm}QAM$" according to the right diagram with the possible amplitude coefficients
- $$a_{\rm I} ∈ \{±3, ±1\}, \ \ a_{\rm Q} ∈ \{±3, ±1\}.$$
- The assignment can be determined using the auxiliary graph given on the left below, as illustrated by the following numerical examples.
$\rm (A)$ $q_3 = 1, \ q_2 = 0, \ q_1 = 1,\ q_0 = 1$ $($brown marker$)$:
- The two most significant bits $\rm (MSB)$ ⇒ "11" determine, according to the $\text{4-QAM}$ diagram, the $($second$)$ quadrant in which the symbol is located.
- The two least significant bits $\rm (LSB)$ ⇒ "10" together with the auxiliary graph determine the point within this quadrant. Result: $a_{\rm I} = -1$, $a_{\rm Q} = +3$.
$\rm (B)$ $q_3 = 0, \ q_2 = 1, \ q_1 = 1,\ q_0 = 0$ $($green marker$)$:
- The two most significant bits ⇒ "01" refer here to the fourth quadrant.
- The two least significant bits ⇒ "10" refer to the green dot in the fourth quadrant: $a_{\rm I} = -3, \ a_{\rm Q} = -3$.
$\text{Example 2:}$ We use the same graphic as in $\text{Example 1}$. The decimal value $D$ provides another way to label the points.
- The brown marked point in the $\rm 4\hspace{0.05cm}–\hspace{-0.02cm}QAM$ diagram is binary labeled "10" ⇒ decimal: $D = 2$. This point simultaneously marks the second quadrant of $\rm 16\hspace{0.05cm}–\hspace{-0.02cm}QAM$.
- The further subdivision results from the lower left graphic. There at the brown dot is written $4D + 3=11$" $($decimal$)$.
- Therefore, the upper right dot $($highlighted in brown$)$ in the upper left quadrant stands for decimal "$11$ ⇒ binary 1011.
- For the green dot, $D = 1$ gives the decimal value $4D + 2 =6$,$11$ which corresponds to the binary representation "0110" .
According to this scheme, the signal space constellations
- for $\rm 64\hspace{0.05cm}–\hspace{-0.02cm}QAM$ ⇒ $(b = 6, \ M = 8)$
- and $\rm 256-QAM$ ⇒ $(b = 8, \ M = 16)$
which will be discussed in detail in the $\text{Exercise 2.3}$.
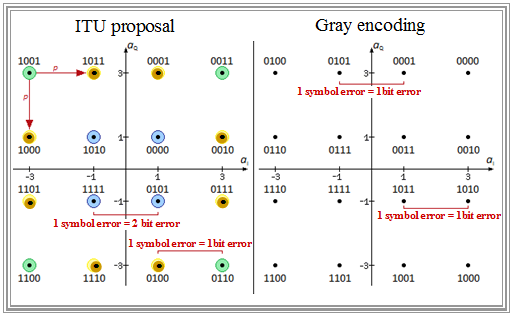
$\text{Example 3:}$ We still consider for the described $\rm 16\hspace{0.05cm}–\hspace{-0.02cm}QAM$ $($left graph, here referred to as "ITU proposal"$)$ the resulting symbol and bit error probability in the presence of AWGN noise:
- An error can be assumed to result in a horizontally or vertically adjacent symbol, as indicated for the upper left green dot.
- The symbol error probability $p$ depends on the Euclidean distance of the two points and the AWGN noise power density $N_0$.
- A distortion to the more distant blue point instead of one of the two neighboring brown points is rather unlikely with Gaussian noise.
An analysis shows:
- All corner points $($green$)$ can only be distorted in two directions.
- In contrast, the inner QAM points $($blue$)$ have four direct neighbors.
- The remaining symbols $($brown$)$ have three neighbors.
For the »symbol error probability« $p_{\rm S}$ then holds:
- $$p_{\rm S} = {1}/{16} \cdot (4 \cdot 2 p + 8 \cdot 3 p + 4 \cdot 4 p) = 3p.$$
To calculate the »bit error probability« $p_{\rm B}$ it must now be taken into account that for the left constellation one symbol error leads
- within one quadrant to only one bit error
$($e.g: "0100" ⇒ "0110"$)$,
- between adjacent quadrants to two bit errors
$($e.g: "1111" ⇒ "0101"$)$.
The computation of $p_{\rm B} $ here involves some effort.
In contrast, with Gray encoding $($right diagram$)$:
- Each symbol differs from its neighbors by exactly one bit.
- Each symbol error thus results in exactly one bit error.
- Since each individual symbol contains four bits, the "bit error probability" is in this case:
- $$p_{\rm B} = p_{\rm S}/4 = 3/4 \cdot p. $$
Carrierless Amplitude Phase Modulation
"Carrierless amplitude phase modulation" $\rm (CAP)$ is a bandwidth-efficient variant of QAM, which can be realized very easily with digital signal processors. The only difference to QAM is that the modulation with a carrier signal can be omitted.
- Digital filtering is used instead of multiplication by cosine and minus sine. $g_{\rm I}(t)$ and $g_{\rm Q}(t)$ are impulse responses of two transversal band-pass filters with same amplitude characteristic, phase-shifted by $π/2$.
- Both are orthogonal to each other, which means that the integral of the product $g_{\rm I}(t) · g_{\rm Q}(t)$ over a symbol duration gives zero.
- The signals $s_{\rm I}(t)$ and $s_{\rm Q}(t)$ generated in this way are combined, converted to a continuous-time signal by a D/A converter.
- The unwanted high-frequency components generated during D/A conversion are eliminated by a low-pass filter before transmission.
- At the receiver, the signal $r(t)$ is first converted to a discrete-time signal using an A/D converter and then the in-phase and quadrature symbols $a_{\rm I}$ and $a_{\rm Q}$ are extracted via two "finite impulse response $\rm (FIR)$ filters" and downstream "threshold decision".
CAP was the de facto standard in initial ADSL specifications until 1996. The graph shows the reference model.
- The frequencies up to $\text{4 kHz}$ were reserved for POTS/ISDN.
- The up channel occupied the frequency range of $\text{15 - 160 kHz}$,
- The down channel occupied the frequencies from $\text{240 - 1500 kHz}$.
One problem with CAP is that a "bad channel" has dramatic consequences on the transmission quality. Therefore, today (2011) ADSL-CAP is only found in a few HDSL variants.
Basics of Discrete Multitone Transmission
"Discrete Multitone Transmission" $\rm (DMT)$ refers to a multicarrier modulation method that is almost identical to "Orthogonal Frequency Division Multiplexing" $\rm (OFDM)$. In the case of wired transmission, one usually refers to "DMT", and in the case of wireless transmission, one refers to "OFDM".
In both cases, one divides the entire bandwidth into many narrowband equidistant subchannels. The respective subcarrier signals $s_k(t)$ are individually impinged with complex data symbols $D_k$ and the sum of the modulated subcarrier signals is transmitted as signal $s(t)$ .
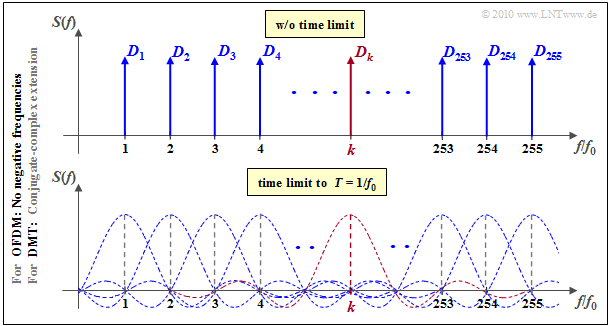
The diagram illustrates the principle of OFDM and DMT in the frequency domain, partly using the values specified for ADSL–DMT:
- $255$ Subcarriers with carrier frequencies $k \cdot f_0$ $(k = 1$, ... , $255)$.
- $4000$ data frames are transmitted per second.
- After $68$ data frames, one synchronization frame is inserted each.
- Due to the "cyclic prefix" $($see chapter "Insertion of Guard–Interval and Cyclic Prefix"$)$ the symbol duration $T = 1/f_0$ must still be shortened by the factor $16/17$.
- Thus, the »basic frequency« of DMT is
- $$f_0 = 4 \cdot (69/68) \cdot (69/68) = 4.3125 \ \rm kHz.$$
An essential difference between OFDM and DMT is that
- in OFDM, the above drawn spectrum $S(f)$ in reality describes an "equivalent low-pass spectrum" $S_{\rm TP}(f)$ and still the shift around a carrier frequency $f_{\rm T}$ has to be considered:
- $$S_{\rm TP}(f ) = \sum_{k = 1}^{255} D_k \cdot \delta (f - k \cdot f_0)\hspace{0.3cm}\Rightarrow \hspace{0.3cm} S(f) = \frac{1}{2} \big [ S_{\rm TP}(f - f_{\rm T}) + S^*_{\rm TP}(-(f + f_{\rm T}))\big ] \hspace{0.05cm};$$
- in DMT, on the other hand, the components at negative frequencies must still be taken into account, which are to be weighted with the conjugate-complex spectral coefficients:
- $$S(f ) = \sum_{k = 1}^{255} \big [ D_k \cdot \delta (f - k \cdot f_0) + D^*_k \cdot \delta (f + k \cdot f_0) \big ] \hspace{0.05cm}.$$
$\text{Please note:}$
- According to these equations, the complex OFDM signal $s_{\rm OFDM}(t)$ consists of $K = 255$ complex exponential oscillations.
- The DMT signal $s_{\rm DMT}(t)$ is composed of as many cosine oscillations with frequencies $k \cdot f_0$ $($full occupancy presupposed$)$.
- Despite complex coefficients $D_k$ resulting from QAM occupancy of the carriers, the DMT signal is always real
because of the conjugate-complex complements at negative frequencies.
However, in both OFDM and DMT, the transmitted signal $s(t)$ is precisely limited in time to the symbol duration $T = 1/f_0 ≈ 232 \ {\rm µs}$ which is equivalent to multiplying by a rectangle of duration $T$. In the spectral domain, this corresponds to convolution with the function $\text{sinc}(fT)$:
- Each Dirac delta function at $k · f_0$ thus becomes an sinc– function at the same position, given the time limit, as shown in the second diagram of the graph above.
- Adjacent subcarrier spectra overlap on the frequency axis, but exactly at $k · f_0$ the coefficients $D_k$ can be seen again, since all other spectra have zeros here.
$\text{Example 4:}$ Assuming the conditions favorable for ADSL downstream, viz.
- $4000$ frames are transmitted per second.
- All subcarriers are active at all times $(K = 255)$.
- Each carrier is occupied with a 1024-QAM $(b = 10)$; according to ITU: $8 ≤ b ≤ 15$.
- Ideal conditions prevail, so that the orthogonality evident in the graph is preserved,
then for the »maximum bit rate«
- $$R_{\rm B,\ max} = 4000 · K · b ≈ 10 \ \rm Mbit/s.$$
However, specified ADSL downstream is only $2 \ \rm Mbit/s$ due to
- the omission of the $64$ lowest carriers because of ISDN and upstream,
- the QAM occupancy of the heavily attenuated carriers with less than $10$ bits, and
- the consideration of the cyclic prefix, and some operational reasons.
DMT realization with IDFT/DFT
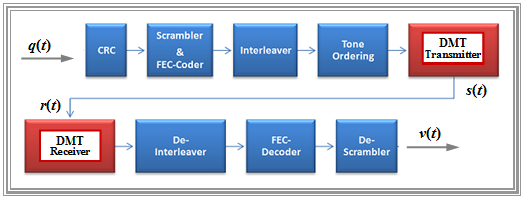
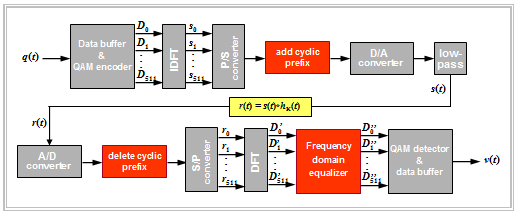
The upper graph shows the complete DMT system. For now we will focus on the two red blocks. The blue blocks will be covered in the "next chapter". Simplified, the transmitter and receiver can be represented as shown in the second graph:
- To perform a DMT modulation, the transmitter accumulates a block of input bits in a data buffer to be transmitted as one frame.
- The QAM encoder supplies per frame the complex-valued data symbols $D_1$, ... , $D_{255}$, which is expanded to the vector $\mathbf{D}$ of length $512$ by
- $D_0 = D_{256} = 0$,
- $D_k = D^\star_{512-k} \ (k = 257,$ ... , $511)$,
- the coefficients $D_{257}$, ... , $D_{511}$ are identical to $D_{-255}$, ... , $D_{-1}$
$($as consequence of "finite signals" properties$)$.
- The spectral samples $\mathbf{D}$ are transformed with the "Inverse Discrete Fourier Transform" to the vector $\mathbf{s}$ of time signal samples, also with length $512$. Because of the conjugate-complex assignment in the spectral domain ⇒ $\text{Im}[\mathbf{s}] = 0$.
- After parallel/serial and digital/analog conversion and low-pass filtering of $\text{Re}[\mathbf{s}]$ the physical $($real$)$ as well as continuous-time transmitted signal $s(t)$ results.
- For this, in the range $0 ≤ t ≤ T$ $($factor $2$, since two coefficients each contribute to cosine/sine$)$:
- $$s(t) = \sum_{k = 1}^{255} \big [ 2 \cdot{\rm Re}\{D_k\} \cdot \cos(2\pi k f_0 t ) - 2 \cdot{\rm Im}\{D_k\} \cdot \sin(2\pi k f_0 t )\big ] \hspace{0.05cm}. $$
- The received signal at the AWGN output is $r(t) = s(t) + n(t)$. After A/D and S/P conversion, $r(t)$ can be expressed by the (real) vector $\mathbf{r}$ . The "Discrete Fourier Transform" then provides estimates for the transmitted spectral coefficients.
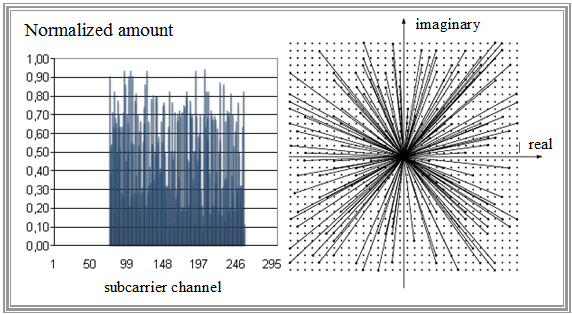
$\text{Example 5:}$ As an example, let's consider the ADSL/DMT downstream.
- In the upper left graph on the right you can see the amounts $\vert D_k\vert $ of the occupied subchannels $64$, ... , $255$. The carriers $0$, ... , $63$ for the reserved frequency range of ISDN and upstream are set to zero.
- Next to it on the right are the spectral coefficients $D_{64}$, ... , $D_{255}$ are shown in the complex plane, : where the signal space is chosen very large.
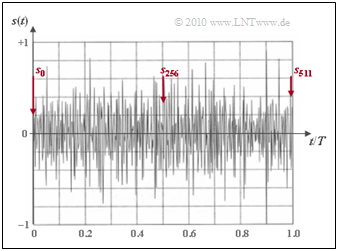
- The graph on the left shows the transmitted signal $s(t)$ for the frame duration $T = {1}/{f_0} ≈ 232 \ \rm µs$, which is obtained by low-pass filtering the IDFT values $s_0$, ... , $s_{511}$ results. This useful signal looks almost like noise.
It can be seen:
- Main problem of DMT is the unfavorable Crest factor ⇒ ratio of maximum value $s_{\rm max}$ and rms value $s_{\rm eff}$.
- The large dynamic range visible in the exemplary signal curve places high demands on the amplifier's linearity.
- When the dynamic range is limited, the peaks of $s(t)$ are cut off.
- This acts as a pulse-like disturbance and an additional noise load to the system.
$\text{Summarizing:}$
- Discrete Multitone Transmission $\rm (DMT)$ is basically the parallel implementation of many narrowband QAM modems with different carriers and relatively low data transmission rates.
- The low bandwidth per subcarrier allows a long symbol duration, thus reducing the influence of intersymbol interference and reducing the development effort for equalization.
- A major reason for the DMT success is its technical ease of implementation. IDFT and DFT are formed with digital signal processors in real time. The vectors have the length $512$ $($power of two$)$. Therefore the particularly fast FFT algorithm $($"Fast Fourier Transformation"$)$ can be applied.
Exercises for the chapter
Exercise 2.3: QAM Signal Space Assignment
Exercise 2.3Z: xDSL Frequency Band
Exercise 2.4: DSL/DMT with IDFT/DFT
Exercise 2.4Z: Repetition to IDFT
