Difference between revisions of "Signal Representation/Signal classification"
| (118 intermediate revisions by 8 users not shown) | |||
| Line 1: | Line 1: | ||
{{Header | {{Header | ||
| − | |Untermenü= | + | |Untermenü=Basic Terms of Communications Engineering |
| − | |Vorherige Seite= | + | |Vorherige Seite=Principles of Communication |
| − | |Nächste Seite= | + | |Nächste Seite=Calculating With Complex Numbers |
}} | }} | ||
| − | == | + | ==Deterministic and stochastic signals== |
| + | <br> | ||
| + | In every transmission system, both deterministic signals and stochastic signal occur. | ||
| − | In | + | {{BlaueBox|TEXT= |
| + | $\text{Definition:}$ | ||
| + | A »'''deterministic signal'''« exists, if its time function $x(t)$ can be described completely in analytical form. | ||
| + | }} | ||
| + | |||
| + | |||
| + | Since the time function $x(t)$ for all times $t$ is known and can be specified unambiguously, there always exists a spectral function $X(f)$ which can be calculated using the [[Signal_Representation/Fourier_Series#Fourierreihe|»$\text{Fourier series}$«]] or the [[Signal_Representation/The_Fourier_Transform_and_its_Inverse|»$\text{Fourier transform}$«]] . | ||
| + | |||
| + | {{BlaueBox|TEXT= | ||
| + | $\text{Definition:}$ | ||
| + | One refers to a »'''stochastic signal'''« or to a »'''random signal'''«, if the signal course $x(t)$ is not – or at least not completely – describable in mathematical form. Such a signal cannot be predicted exactly for the future.}} | ||
| + | |||
| + | |||
| + | [[File:P_ID350_Sig_T_1_2_S1_neu.png|right|frame|Example of a deterministic signal (top) and <br>a stochastic signal (bottom)]] | ||
| + | {{GraueBox|TEXT= | ||
| + | $\text{Example 1:}$ | ||
| + | The graph shows the time courses of a deterministic and a stochastic signal: | ||
| + | *At the top a periodic rectangular signal $x_1(t)$ with period duration $T_0$ ⇒ deterministic signal, | ||
| + | |||
| + | *below a Gaussian noise signal $x_2(t)$ with the mean value $2\ \rm V $ ⇒ stochastic signal. | ||
| + | |||
| + | |||
| + | For such a non–deterministic signal $x_2(t)$ no spectral function $X_2(f)$ can be specified, since Fourier series and Fourier transform requires the exact knowledge of the time function for all times $t$. }} | ||
| + | |||
| + | |||
| + | Information-carrying signals are always of stochastic nature. Their description and the definition of suitable parameters is given in the book [[Theory_of_Stochastic_Signals|»Theory of Stochastic Signals«]]. | ||
| + | |||
| + | However, deterministic signals are also of great importance for Communications Engineering. Examples of these are: | ||
| + | *Test signals for the design of communication systems, | ||
| + | |||
| + | *carrier signals for frequency multiplex systems, and | ||
| + | |||
| + | *a »Dirac delta comb« for sampling an analog signal or for time regeneration of a digital signal. | ||
| + | |||
| + | |||
| + | ==Causal and non-causal signals== | ||
| + | <br> | ||
| + | In Communications Engineering one often reckons with temporally unlimited signals; the definition range of the signal then extends from $t = -\infty$ to $t=+\infty$. | ||
| + | |||
| + | In reality, however, there are no such signals, because every signal had to be switched on at some point. If one chooses – arbitrarily but nevertheless meaningfully – the switch-on time $t = 0$, then one comes to the following classification: | ||
| + | |||
| + | {{BlaueBox|TEXT= | ||
| + | $\text{Definition:}$ | ||
| + | *A signal $x(t)$ is called »'''causal'''«, if it does not exist for all times $t < 0$ or is identical zero. | ||
| + | |||
| + | *If this condition is not fulfilled, then one speaks of a »'''non-causal'''« signal $($or system$)$.}} | ||
| + | |||
| + | |||
| + | In this book »Signal representation« mostly causal signals and systems are considered. This has the following reasons: | ||
| + | *Non-causal signals $($and systems$)$ are mathematically easier to handle than causal ones. For example, the spectral function can be determined here by means of Fourier transform and one does not need extensive knowledge of function theory as in the Laplace transform. | ||
| + | |||
| + | *Non-causal signals and systems describe the situation completely and correctly, if one ignores the problem of the switch-on process and is therefore only interested in the »steady state«. | ||
| + | |||
| + | *The description of causal signals and systems using the [[Linear_and_Time_Invariant_Systems/Laplace_Transform_and_p-Transfer_Function|»Laplace Transform«]] is shown in the book [[Lineare_zeitinvariante_Systeme|»Linear Time-Invariant Systems«]]. | ||
| + | |||
| + | |||
| + | |||
| + | {{GraueBox|TEXT= | ||
| + | [[File:EN_Sig_T_1_2_S2_v2.png|right|frame|Causal system $($top$)$ and non-causal system $($bottom$)$]] | ||
| + | $\text{Example 2:}$ | ||
| + | You can see a causal system in the upper graphic: | ||
| + | *If a unit step function $x(t)$ is applied to its input, then the output signal $y(t)$ can only increase from zero to its maximum value after time $t = 0$. | ||
| + | |||
| + | *Otherwise the causal connection that the effect cannot begin before the cause would not be fulfilled. | ||
| + | |||
| + | *In the lower graph the causality is no longer given. | ||
| + | |||
| + | |||
| + | As you can easily see in this example, an additional runtime of one millisecond is enough to change from the non-causal to the causal representation.}} | ||
| + | |||
| + | |||
| + | ==Energy–limited and power–limited signals== | ||
| + | <br> | ||
| + | At this place first two important signal description quantities must be introduced, namely »'''energy'''« and »'''power'''«. | ||
| + | *In terms of physics, energy corresponds to work and has, for example, the unit "Ws". | ||
| + | |||
| + | *The power is defined as "work per time" and therefore has the unit "W". | ||
| + | |||
| + | |||
| + | According to the elementary laws of Electrical Engineering, both values are dependent on the resistance $R$. In order to eliminate this dependency in Communications Engineering, the resistance $R=1 \,\Omega$ is often used as a basis. Then the following definitions apply: | ||
| + | |||
| + | {{BlaueBox|TEXT= | ||
| + | $\text{Definition:}$ The »'''energy'''« of the signal $x(t)$ is to calculate as follows: | ||
| + | |||
| + | :$$E_x=\lim_{T_{\rm M}\to\infty} \int^{T_{\rm M}/2} _{-T_{\rm M}/2} x^2(t)\,{\rm d}t.$$}} | ||
| + | |||
| + | |||
| + | {{BlaueBox|TEXT= | ||
| + | $\text{Definition:}$ To calculate the $($mean$)$ »'''power'''« still has to be divided by the time $T_{\rm M}$ before the boundary crossing: | ||
| + | |||
| + | :$$P_x = \lim_{T_{\rm M} \to \infty} \frac{1}{T_{\rm M} } \cdot \int^{T_{\rm M}/2} _{-T_{\rm M}/2} x^2(t)\,{\rm d}t.$$ | ||
| + | |||
| + | *$T_{\rm M}$ is the assumed measurement duration during which the signal is observed, symmetrically with respect to the time origin $(t = 0)$. | ||
| + | |||
| + | *In general, this time interval must be chosen very large; ideally $T_{\rm M}$ should be towards infinity.}} | ||
| + | |||
| + | |||
| + | If $x(t)$ denotes an electrical voltage curve $($unit: $\text{V)}$, then according to the above equations: | ||
| + | #The signal energy has the unit "$\text{V}^2\text{s}$". | ||
| + | #The signal power has the unit "$\text{V}^2$". | ||
| + | |||
| + | |||
| + | This statement also means: In the above definitions the reference resistance $R=1\,\Omega$ is already implicit. | ||
| + | |||
| + | {{GraueBox|TEXT= | ||
| + | $\text{Example 3:}$ | ||
| + | Now the energy and power of two exemplary signals are calculated. | ||
| + | [[File:P_ID590__Sig_T_1_2_S3.png|right|frame|Energy-limited and power-limited signals]] | ||
| + | |||
| + | ⇒ The upper graph shows a rectangular pulse $x_1(t)$ with amplitude $A$ and duration $T$: | ||
| + | |||
| + | #The signal energy of this pulse is $E_1 = A^2 \cdot T$. | ||
| + | #For the signal power, division by $T_{\rm M}$ and limit formation $(T_{\rm M} \to \infty)$ results in the value $P_1 = 0$. | ||
| − | |||
| − | |||
| − | |||
| − | |||
| − | + | ⇒ For the cosine signal $x_2(t)$ with amplitude $A$ applies according to the sketch below: | |
| − | |||
| − | |||
| + | #The signal power is $P_2 = A^2/2$, regardless of the frequency. | ||
| + | #The signal energy $E_2$ $($integral over power for all times$)$ is infinite. | ||
| + | #With $A = 4 \ {\rm V}$ results for the power $P_2 = 8 \ {\rm V}^2$. | ||
| + | #With the resistance of $R = 50 \,\,\Omega$ this corresponds to the physical power ${8}/{50} \,\,{\rm V}\hspace{-0.1cm}/{\Omega}= 160\,\, {\rm mW}$.}} | ||
| − | |||
| − | |||
| − | + | According to this example there are the following classification characteristics: | |
| − | |||
| − | |||
| − | |||
| + | {{BlaueBox|TEXT= | ||
| + | $\text{Definition:}$ | ||
| + | A signal $x(t)$ with finite energy $E_x$ and infinitely small power $(P_x = 0)$ is called »'''energy–limited'''«. }} | ||
| + | *With pulse-shaped signals like the signal $x_1(t)$ in the above example, the energy is always limited. Mostly, the signal values here are different from zero only for a finite time period. In other words: Such signals are often time-limited, too. | ||
| − | + | *But even signals that are unlimited in time can have a finite energy. In later chapters you will find more information about energy–limited and therefore aperiodic signals, for example the [[Signal_Representation/Special_Cases_of_Pulses#Gaussian_pulse|»Gaussian pulse«]] and the [[Aufgaben:Exercise_3.1:_Spectrum_of_the_Exponential_Pulse|»exponential pulse«]]. | |
| − | |||
| − | |||
| − | |||
| − | |||
| − | = | + | {{BlaueBox|TEXT= |
| + | $\text{Definition:}$ | ||
| + | A signal $x(t)$ with finite power $P_x$ and accordingly infinite energy $(E_x \to \infty)$ is called »'''power–limited'''«.}} | ||
| − | + | *All power–limited signals are also infinitely extended in time. Examples are the [[Signal_Representation/Direct_Current_Signal_-_Limit_Case_of_a_Periodic_Signal|»DC signal»]] and [[Signal_Representation/Harmonic_Oscillation|»harmonic oscillations«]] such as the cosine signal $x_2(t)$ in $\text{Example 3}$, which are described in detail in chapter [[Signal_Representation/General_Description|»Periodic Signals«]]. | |
| − | + | *Even most of the stochastic signals are power–limited ⇒ see the book [[Theory_of_Stochastic_Signals|»Theory of Stochastic Signals«]]. | |
| − | |||
| − | |||
| − | + | ==Continuous-valued and discrete-valued signals== | |
| − | * | + | <br> |
| − | * | + | {{BlaueBox|TEXT= |
| − | + | $\text{Definitions:}$ | |
| + | *A signal is »'''continuous in value'''« or »'''continuous-valued'''«, if the decisive signal parameter – for example the instantaneous value – can take all values of a continuum $($e.g. of an interval$)$. | ||
| + | |||
| + | *In contrast, if only countable many different values are possible for the signal parameter, then the signal is »'''discrete in value'''« or »'''discrete-valued'''«. The number $M$ of possible values is called the »level number« or the »symbol set size«.}} | ||
| − | |||
| − | |||
| − | |||
| − | + | *Analog transmission systems always work with continuous-valued signals. | |
| − | + | ||
| + | *For digital systems, on the other hand, most but not all signals are discrete-valued. | ||
| − | == | + | {{GraueBox|TEXT= |
| + | $\text{Example 4:}$ | ||
| + | The upper diagram shows in blue a section of a continuous-valued signal $x(t)$, which can take values between $\pm 8\ \rm V$ . | ||
| + | [[File:P_ID358_Sig_T_1_2_S4_a_neu.png|right|frame|Continuous-valued and discrete-valued signal]] | ||
| + | *In red you can see the signal $x_{\rm Q}(t)$ discretized on $M = 8$ quantization levels with the possible signal values $\pm 1\ \rm V$, $\pm 3\ \rm V$, $\pm 5\ \rm V$ and $\pm 7\ \rm V$. | ||
| + | |||
| + | *For this signal $x_{\rm Q}(t)$ the <u>instantaneous value</u> was considered the decisive signal parameter. | ||
| − | |||
| − | |||
| − | + | [[File:P_ID831_Sig_T_1_2_S4_b_neu.png|left|frame|FSK signal ⇒ continuous–valued, binary–in–frequency]] | |
| − | |||
| − | |||
| − | |||
| − | |||
| − | |||
| − | |||
| − | |||
| − | |||
| − | |||
| + | In an FSK system $($"Frequency Shift Keying"$)$ on the other hand, the <u>instantaneous frequency</u> is the essential signal parameter. | ||
| − | |||
| − | |||
| − | |||
| − | |||
| − | + | Therefore the signal $s_{\rm FSK}(t)$ shown below is also called <u>discrete-valued</u> with level number $M = 2$ and possible frequencies $1 \ \ \rm kHz$ and $5 \ \ \rm kHz$, although the instantaneous value is continuous.}} | |
| − | |||
| − | |||
| − | + | ==Continuous-time and discrete-time signals== | |
| − | + | <br> | |
| − | + | For the signals considered so far, the signal parameter was defined at any given time. Such a signal is called "continuous in time". | |
| − | + | {{BlaueBox|TEXT= | |
| − | + | $\text{Definition:}$ | |
| + | With a »'''discrete-time signal'''« on the contrary, the signal parameter is defined only at the discrete points $t_\nu$. These time points are usually chosen equidistant: | ||
| + | :$$t_\nu = \nu \cdot T_{\rm A}.$$ | ||
| + | *We refer $T_{\rm A}$ as »sampling time interval« and its reciprocal $f_{\rm A} = 1/T_{\rm A}$ as »sampling frequency«. | ||
| − | + | *Such a signal may be created by sampling a »'''continuous-time signal'''«. }} | |
| − | |||
| − | |||
| − | |||
| − | + | {{GraueBox|TEXT= | |
| + | [[File:P_ID355_Sig_T_1_2_S5_neu.png|right|frame|Continuous-time and discrete-time signal]] | ||
| + | $\text{Example 5:}$ | ||
| − | { | + | *The discrete-time signal $x_{\rm A}(t)$ is obtained after sampling the continuous-time and continuous-value signal $x(t)$ with a uniform sampling period $(T_{\rm A})$.<br><br> |
| − | + | *The time plot $x_{\rm R}(t)$ outlined below differs from the real discrete-time representation $x_{\rm A}(t)$ in that the infinitely narrow samples $($mathematically describable with Dirac deltas$)$ are replaced by rectangular pulses of duration $T_{\rm A}$.<br><br> | |
| + | *Such a signal can also be called "discrete-time" according to the above definition.<br><br> | ||
| − | [[ | + | *Furthermore applies: |
| − | [[File: | + | #A discrete-time signal $x(t)$ is completely determined by its series $\left \langle x_\nu \right \rangle$ of sampled values. |
| + | #These sampled values can either be continuous or discrete. | ||
| + | #The mathematical description of discrete-time signals is given in the chapter <br> [[Signal_Representation/Time_Discrete_Signal_Representation|»Discrete-Time Signal Representation«]].}} | ||
| + | <br clear=all> | ||
| + | ==Analog and digital signals== | ||
| + | <br> | ||
| + | [[File:EN_Sig_T_1_2_S6.png|right|frame|Analog and digital signals]] | ||
| + | {{GraueBox|TEXT= | ||
| + | $\text{Example 6:}$ | ||
| + | The signal properties | ||
| + | * "continuous-valued", | ||
| + | * "discret-valued", | ||
| + | * "continuous-time", | ||
| + | * "discrete-time" | ||
| − | |||
| − | |||
| + | are illustrated in the diagram on the right using an example. | ||
| + | <br clear=all>}} | ||
| − | + | <br>In addition, the following specifications apply: | |
| − | + | {{BlaueBox|TEXT= | |
| + | $\text{Definition:}$ | ||
| + | If a signal is both continuous in value <u>and</u> continuous in time, it is called an »'''analog signal'''«. | ||
| − | + | *Such signals represent a continuous process. | |
| − | |||
| − | |||
| + | *Examples are speech signals, music signals and image signals.}} | ||
| − | |||
| − | |||
| − | |||
| − | |||
| + | {{BlaueBox|TEXT= | ||
| + | $\text{Definition:}$ | ||
| + | A »'''digital signal'''« is discrete in value <u>and</u> discrete in time, and the message contained therein consists of symbols from a symbol set. | ||
| + | |||
| + | *For example, it can be a voice signal, music signal or image signal after sampling, quantization, and encoding in any form. | ||
| + | |||
| + | *But also a »data signal« when a file is downloaded from a server on the Internet.}} | ||
| − | |||
| − | |||
| + | Depending on the number of levels, digital signals are also known by other names, for example | ||
| + | * with $M = 2$: binary digital signal or »'''binary signal'''«, | ||
| − | = | + | * with $M = 3$: ternary digital signal or »'''ternary signal'''«, |
| − | + | * with $M = 4$: quaternary digital signal or »'''quaternary signal'''«. | |
| − | |||
| − | |||
| − | |||
| − | + | The following $($German-language$)$ learning video summarizes the classification features discussed in this chapter in a compact way:<br> [[Analoge_und_digitale_Signale_(Lernvideo)|»Analoge und digitale Signale«]] ⇒ "Analog and Digital Signals". | |
| − | |||
| − | |||
| − | |||
| − | |||
| − | |||
| − | |||
| − | |||
| + | ==Exercises for the chapter== | ||
| + | <br> | ||
| + | [[Aufgaben:Exercise_1.2:_Signal_Classification|Exercise 1.2: Signal Classification]] | ||
| − | + | [[Aufgaben:Exercise_1.2Z:_Puls-Code-Modulation|Exercise 1.2Z: Puls Code Modulation]] | |
| − | [[Aufgaben:1. | ||
{{Display}} | {{Display}} | ||
Latest revision as of 13:46, 22 June 2023
Contents
Deterministic and stochastic signals
In every transmission system, both deterministic signals and stochastic signal occur.
$\text{Definition:}$ A »deterministic signal« exists, if its time function $x(t)$ can be described completely in analytical form.
Since the time function $x(t)$ for all times $t$ is known and can be specified unambiguously, there always exists a spectral function $X(f)$ which can be calculated using the »$\text{Fourier series}$« or the »$\text{Fourier transform}$« .
$\text{Definition:}$ One refers to a »stochastic signal« or to a »random signal«, if the signal course $x(t)$ is not – or at least not completely – describable in mathematical form. Such a signal cannot be predicted exactly for the future.
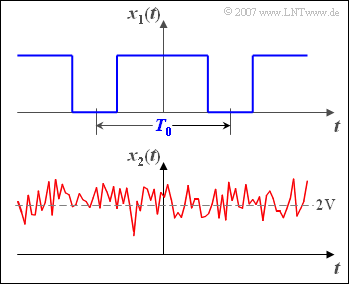
$\text{Example 1:}$ The graph shows the time courses of a deterministic and a stochastic signal:
- At the top a periodic rectangular signal $x_1(t)$ with period duration $T_0$ ⇒ deterministic signal,
- below a Gaussian noise signal $x_2(t)$ with the mean value $2\ \rm V $ ⇒ stochastic signal.
For such a non–deterministic signal $x_2(t)$ no spectral function $X_2(f)$ can be specified, since Fourier series and Fourier transform requires the exact knowledge of the time function for all times $t$.
Information-carrying signals are always of stochastic nature. Their description and the definition of suitable parameters is given in the book »Theory of Stochastic Signals«.
However, deterministic signals are also of great importance for Communications Engineering. Examples of these are:
- Test signals for the design of communication systems,
- carrier signals for frequency multiplex systems, and
- a »Dirac delta comb« for sampling an analog signal or for time regeneration of a digital signal.
Causal and non-causal signals
In Communications Engineering one often reckons with temporally unlimited signals; the definition range of the signal then extends from $t = -\infty$ to $t=+\infty$.
In reality, however, there are no such signals, because every signal had to be switched on at some point. If one chooses – arbitrarily but nevertheless meaningfully – the switch-on time $t = 0$, then one comes to the following classification:
$\text{Definition:}$
- A signal $x(t)$ is called »causal«, if it does not exist for all times $t < 0$ or is identical zero.
- If this condition is not fulfilled, then one speaks of a »non-causal« signal $($or system$)$.
In this book »Signal representation« mostly causal signals and systems are considered. This has the following reasons:
- Non-causal signals $($and systems$)$ are mathematically easier to handle than causal ones. For example, the spectral function can be determined here by means of Fourier transform and one does not need extensive knowledge of function theory as in the Laplace transform.
- Non-causal signals and systems describe the situation completely and correctly, if one ignores the problem of the switch-on process and is therefore only interested in the »steady state«.
- The description of causal signals and systems using the »Laplace Transform« is shown in the book »Linear Time-Invariant Systems«.
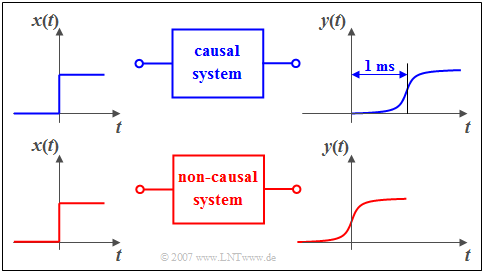
$\text{Example 2:}$ You can see a causal system in the upper graphic:
- If a unit step function $x(t)$ is applied to its input, then the output signal $y(t)$ can only increase from zero to its maximum value after time $t = 0$.
- Otherwise the causal connection that the effect cannot begin before the cause would not be fulfilled.
- In the lower graph the causality is no longer given.
As you can easily see in this example, an additional runtime of one millisecond is enough to change from the non-causal to the causal representation.
Energy–limited and power–limited signals
At this place first two important signal description quantities must be introduced, namely »energy« and »power«.
- In terms of physics, energy corresponds to work and has, for example, the unit "Ws".
- The power is defined as "work per time" and therefore has the unit "W".
According to the elementary laws of Electrical Engineering, both values are dependent on the resistance $R$. In order to eliminate this dependency in Communications Engineering, the resistance $R=1 \,\Omega$ is often used as a basis. Then the following definitions apply:
$\text{Definition:}$ The »energy« of the signal $x(t)$ is to calculate as follows:
- $$E_x=\lim_{T_{\rm M}\to\infty} \int^{T_{\rm M}/2} _{-T_{\rm M}/2} x^2(t)\,{\rm d}t.$$
$\text{Definition:}$ To calculate the $($mean$)$ »power« still has to be divided by the time $T_{\rm M}$ before the boundary crossing:
- $$P_x = \lim_{T_{\rm M} \to \infty} \frac{1}{T_{\rm M} } \cdot \int^{T_{\rm M}/2} _{-T_{\rm M}/2} x^2(t)\,{\rm d}t.$$
- $T_{\rm M}$ is the assumed measurement duration during which the signal is observed, symmetrically with respect to the time origin $(t = 0)$.
- In general, this time interval must be chosen very large; ideally $T_{\rm M}$ should be towards infinity.
If $x(t)$ denotes an electrical voltage curve $($unit: $\text{V)}$, then according to the above equations:
- The signal energy has the unit "$\text{V}^2\text{s}$".
- The signal power has the unit "$\text{V}^2$".
This statement also means: In the above definitions the reference resistance $R=1\,\Omega$ is already implicit.
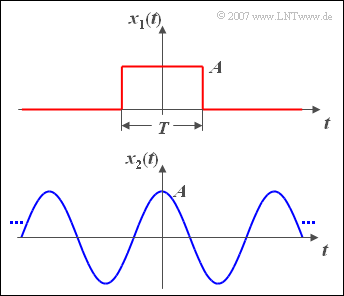
$\text{Example 3:}$ Now the energy and power of two exemplary signals are calculated.
⇒ The upper graph shows a rectangular pulse $x_1(t)$ with amplitude $A$ and duration $T$:
- The signal energy of this pulse is $E_1 = A^2 \cdot T$.
- For the signal power, division by $T_{\rm M}$ and limit formation $(T_{\rm M} \to \infty)$ results in the value $P_1 = 0$.
⇒ For the cosine signal $x_2(t)$ with amplitude $A$ applies according to the sketch below:
- The signal power is $P_2 = A^2/2$, regardless of the frequency.
- The signal energy $E_2$ $($integral over power for all times$)$ is infinite.
- With $A = 4 \ {\rm V}$ results for the power $P_2 = 8 \ {\rm V}^2$.
- With the resistance of $R = 50 \,\,\Omega$ this corresponds to the physical power ${8}/{50} \,\,{\rm V}\hspace{-0.1cm}/{\Omega}= 160\,\, {\rm mW}$.
According to this example there are the following classification characteristics:
$\text{Definition:}$ A signal $x(t)$ with finite energy $E_x$ and infinitely small power $(P_x = 0)$ is called »energy–limited«.
- With pulse-shaped signals like the signal $x_1(t)$ in the above example, the energy is always limited. Mostly, the signal values here are different from zero only for a finite time period. In other words: Such signals are often time-limited, too.
- But even signals that are unlimited in time can have a finite energy. In later chapters you will find more information about energy–limited and therefore aperiodic signals, for example the »Gaussian pulse« and the »exponential pulse«.
$\text{Definition:}$ A signal $x(t)$ with finite power $P_x$ and accordingly infinite energy $(E_x \to \infty)$ is called »power–limited«.
- All power–limited signals are also infinitely extended in time. Examples are the »DC signal» and »harmonic oscillations« such as the cosine signal $x_2(t)$ in $\text{Example 3}$, which are described in detail in chapter »Periodic Signals«.
- Even most of the stochastic signals are power–limited ⇒ see the book »Theory of Stochastic Signals«.
Continuous-valued and discrete-valued signals
$\text{Definitions:}$
- A signal is »continuous in value« or »continuous-valued«, if the decisive signal parameter – for example the instantaneous value – can take all values of a continuum $($e.g. of an interval$)$.
- In contrast, if only countable many different values are possible for the signal parameter, then the signal is »discrete in value« or »discrete-valued«. The number $M$ of possible values is called the »level number« or the »symbol set size«.
- Analog transmission systems always work with continuous-valued signals.
- For digital systems, on the other hand, most but not all signals are discrete-valued.
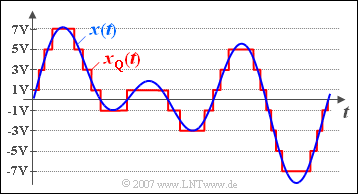
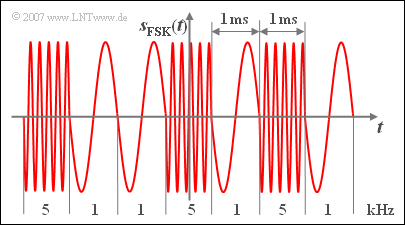
$\text{Example 4:}$ The upper diagram shows in blue a section of a continuous-valued signal $x(t)$, which can take values between $\pm 8\ \rm V$ .
- In red you can see the signal $x_{\rm Q}(t)$ discretized on $M = 8$ quantization levels with the possible signal values $\pm 1\ \rm V$, $\pm 3\ \rm V$, $\pm 5\ \rm V$ and $\pm 7\ \rm V$.
- For this signal $x_{\rm Q}(t)$ the instantaneous value was considered the decisive signal parameter.
In an FSK system $($"Frequency Shift Keying"$)$ on the other hand, the instantaneous frequency is the essential signal parameter.
Therefore the signal $s_{\rm FSK}(t)$ shown below is also called discrete-valued with level number $M = 2$ and possible frequencies $1 \ \ \rm kHz$ and $5 \ \ \rm kHz$, although the instantaneous value is continuous.
Continuous-time and discrete-time signals
For the signals considered so far, the signal parameter was defined at any given time. Such a signal is called "continuous in time".
$\text{Definition:}$
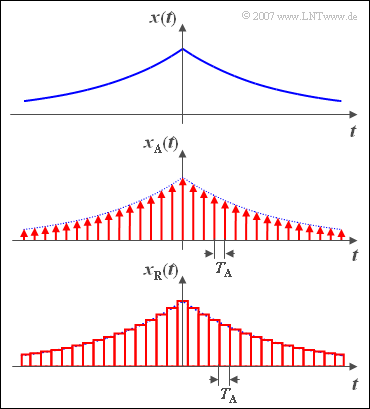
With a »discrete-time signal« on the contrary, the signal parameter is defined only at the discrete points $t_\nu$. These time points are usually chosen equidistant:
- $$t_\nu = \nu \cdot T_{\rm A}.$$
- We refer $T_{\rm A}$ as »sampling time interval« and its reciprocal $f_{\rm A} = 1/T_{\rm A}$ as »sampling frequency«.
- Such a signal may be created by sampling a »continuous-time signal«.
$\text{Example 5:}$
- The discrete-time signal $x_{\rm A}(t)$ is obtained after sampling the continuous-time and continuous-value signal $x(t)$ with a uniform sampling period $(T_{\rm A})$.
- The time plot $x_{\rm R}(t)$ outlined below differs from the real discrete-time representation $x_{\rm A}(t)$ in that the infinitely narrow samples $($mathematically describable with Dirac deltas$)$ are replaced by rectangular pulses of duration $T_{\rm A}$.
- Such a signal can also be called "discrete-time" according to the above definition.
- Furthermore applies:
- A discrete-time signal $x(t)$ is completely determined by its series $\left \langle x_\nu \right \rangle$ of sampled values.
- These sampled values can either be continuous or discrete.
- The mathematical description of discrete-time signals is given in the chapter
»Discrete-Time Signal Representation«.
Analog and digital signals
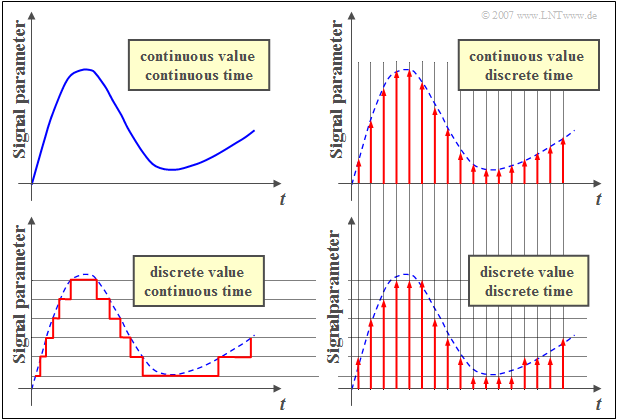
$\text{Example 6:}$ The signal properties
- "continuous-valued",
- "discret-valued",
- "continuous-time",
- "discrete-time"
are illustrated in the diagram on the right using an example.
In addition, the following specifications apply:
$\text{Definition:}$ If a signal is both continuous in value and continuous in time, it is called an »analog signal«.
- Such signals represent a continuous process.
- Examples are speech signals, music signals and image signals.
$\text{Definition:}$ A »digital signal« is discrete in value and discrete in time, and the message contained therein consists of symbols from a symbol set.
- For example, it can be a voice signal, music signal or image signal after sampling, quantization, and encoding in any form.
- But also a »data signal« when a file is downloaded from a server on the Internet.
Depending on the number of levels, digital signals are also known by other names, for example
- with $M = 2$: binary digital signal or »binary signal«,
- with $M = 3$: ternary digital signal or »ternary signal«,
- with $M = 4$: quaternary digital signal or »quaternary signal«.
The following $($German-language$)$ learning video summarizes the classification features discussed in this chapter in a compact way:
»Analoge und digitale Signale« ⇒ "Analog and Digital Signals".
Exercises for the chapter
Exercise 1.2: Signal Classification
Exercise 1.2Z: Puls Code Modulation
