Contents
- 1 Common block diagram for ASK and BPSK
- 2 Noise consideration for the BPSK system
- 3 Error probability of the optimal BPSK system
- 4 Error probability of the optimal ASK system
- 5 Error probabilities for 4–QAM and 4–PSK
- 6 Phase offset between transmitter and receiver
- 7 Baseband model for ASK and BPSK
- 8 Exercises for the chapter
Common block diagram for ASK and BPSK
In the chapter "Linear Digital Modulation" of the book "Modulation Methods" the digital carrier frequency systems
- $\rm ASK$ ("Amplitude Shift Keying") and
- $\rm BPSK$ ("Binary Phase Shift Keying")
have already been described in detail. In this chapter, the bit error probability of these systems is now calculated, assuming the outlined common block diagram. The following assumptions apply again:
- Demodulation always occurs coherently. That means: A carrier signal $z_{\rm E}(t)$ with the same frequency as at the transmitter but with double amplitude is added at the receiver.
- Let the phase offset between the transmitter carrier signal $z(t)$ and the receiver carrier signal $z_{\rm E}(t)$ initially be $\Delta \phi_{\rm T} = 0$.
- For BPSK, the bipolar amplitude coefficients $a_\nu \in \{-1, +1\}$ are assumed and the decision threshold is $E = 0$.
- In contrast, for ASK, $a_\nu \in \{0, 1\}$ is valid. The decision threshold $E$ is to be chosen as best as possible for this unipolar case.
- We always consider the AWGN channel that is
- channel frequency response $H_{\rm K}(f) = 1$, and
- $n(t)$ represents white Gaussian noise with (one-sided) noise power density $N_0$.
- The equalization of linear channel distortions – i.e., the case $H_{\rm K}(f) \ne \rm const.$ – is possible in the same way as for baseband transmission.
For this, please refer to the chapter "Consideration of Channel Distortion and Equalization".
Noise consideration for the BPSK system
We first assume a bipolar rectangular source signal $q(t)$ with the values $\pm s_0$. Its normalized spectrum is: $H_{\rm S}(f) = {\rm sinc}(f T)$. Just as in baseband transmission, the smallest possible bit error probability is with the receiver filter $H_{\rm E}(f) = {H_{\rm S} }^\star(f) = {\rm sinc}(f T)$.
The signal waveforms of this matched filter receiver BPSK system show:
- The signal component $d_{\rm S}(t)$ of the detection signal i.e., without noise component, is always $\pm s_0$ at all detection times $\nu \cdot T$, with the signs determined by the amplitude coefficients $a_\nu \in \{-1, +1\}$.
- As for the comparable baseband system, the error probability is with the "complementary Gaussian error function ${\rm Q}(x)$: $p_{\rm B} = {\rm Q}(s_0/\sigma_d).$
- Different from the baseband system, however, is the noise power. The noise component $b_{\rm N}(t)$ is obtained by multiplying the bandpass noise $n(t)$ by the receiver-side carrier $z_{\rm E}(t) =2 \cdot \cos(2\pi f t)$ and has the noise power density ⇒ red sketch on the right:
- $${\it \Phi}_{b{\rm N}}(f)={\it \Phi}_{n}(f) \star \big[ 1^2 \cdot \delta ( f - f_{\rm T})+ 1^2 \cdot \delta ( f + f_{\rm T})\big].$$
The diagram illustrates this equation using bandlimited white noise $n(t)$ with center frequency $f_{\rm T}$ and bandwidth $B_n$ as an example ⇒ blue sketch on the left:
- While ${\it \Phi}_{n}(f = f_{\rm T}) = N_0/2$ holds, ${\it \Phi}_{b{\rm N}}(f=0) = N_0$.
- The noise components around $\pm 2f_{\rm T}$ are eliminated by the subsequent receiver filter $H_{\rm E}(f)$ and do not matter for further considerations.
- For true white noise, with the $B_n \to \infty$ boundary transition, for all frequencies: ${{\it \Phi}_{n}(f)}={N_0}/{2}, \hspace{0.2cm}{{\it \Phi}_{b{\rm N}}(f)}={N_0}.$
Error probability of the optimal BPSK system
The observations just made show that to calculate the error probability of the BPSK system in the case of AWGN noise,
- one can dispense with the two multiplications by $z(t)$ and $z_{\rm E}(t) = 2 \cdot z(t)$
- if one doubles the (two-sided) power-spectral density of the input noise $n(t)$ from $N_0/2$ to $N_0$.
This results for the noise power before the decision:
- $$\sigma_d^2 = N_0 \cdot \int_{-\infty}^{+\infty} {\rm sinc}^2( f \hspace{0.05cm} T_{\rm B}) \,{\rm d} f = {N_0}/{T_{\rm B}},$$
i.e., twice the value as for baseband transmission.
Note: To allow later comparison with quadrature amplitude modulation $\rm (QAM)$, the symbol duration $T$ has been replaced here by the bit duration $T_{\rm B}$. However, $T_{\rm B}=T$ is valid for $\rm BPSK$ $($and also for $\rm ASK)$.
$\text{Conclusion:}$ Thus, the BPSK error probability with the two usual Gaussian error functions is:
- $$p_{\rm B} = {\rm Q}\left ( \sqrt{\frac{s_0^2 \cdot T_{\rm B} }{N_0 } }\hspace{0.1cm} \right ) = {1}/{2}\cdot {\rm erfc}\left ( \sqrt{\frac{s_0^2 \cdot T_{\rm B} }{2 \cdot N_0 } }\hspace{0.1cm} \right ).$$
- If one further considers that the energy expended per bit with BPSK is
- $$E_{\rm B} = {1}/{2}\cdot s_0^2 \cdot T_{\rm B}$$
- this equation can be transformed as follows:
- $$p_{\rm B} = {\rm Q}\left ( \sqrt{ {2 \cdot E_{\rm B} }/{N_0 } } \hspace{0.1cm}\right ) ={1}/{2}\cdot {\rm erfc}\left ( \sqrt{ {E_{\rm B} }/{N_0 } } \hspace{0.1cm}\right ).$$
- This results in the same formula as for baseband transmission, but where $E_{\rm B} = s_0^2 \cdot T_{\rm B}$ had to be used for the "energy per bit" and not $E_{\rm B} = {1}/{2}\cdot s_0^2 \cdot T_{\rm B}$.
Note: This last equation holds not only for the rectangular source signal
⇒ $H_{\rm S}(f) = {\rm sinc}(f T)$, but for any $H_{\rm S}(f)$, as long as
- the receiver filter $H_{\rm E}(f) = {H_{\rm S} }^\star(f)$ is exactly matched to the transmitter, and
- the product $H_{\rm S}(f) \cdot H_{\rm E}(f)$ satisfies the first Nyquist criterion.
- the receiver filter $H_{\rm E}(f) = {H_{\rm S} }^\star(f)$ is exactly matched to the transmitter, and
Error probability of the optimal ASK system
We now consider an ASK system under the same conditions as the BPSK system. Here:
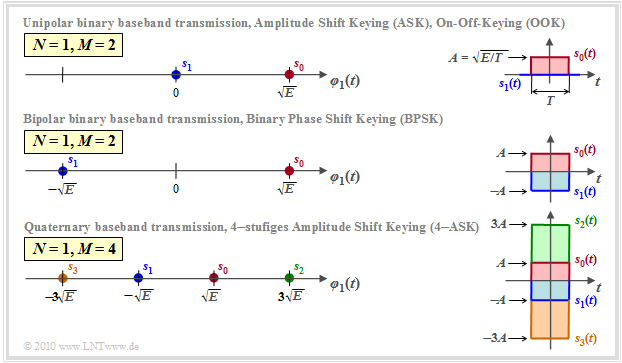
- All signal component values $d_{\rm S}(\nu \cdot T)$ are either $0$ or $s_0$, that means: their distance from the threshold $E = s_0/2$ is in each case $s_0/2$.
- The noise rms value $\sigma_d= \sqrt{N_0}/{T_{\rm B}}$ is exactly the same as for BPSK.
- The energy per bit is only half as large as for BPSK: $E_{\rm B} = {1}/{4}\cdot s_0^2 \cdot T_{\rm B}.$
Thus the equations for the ASK error probability as function of $s_0$ and $E_{\rm B}$ are:
- $$p_{\rm B} = {\rm Q}\left ( \frac{s_0/2}{\sigma_d } \right )= {\rm Q}\left ( \sqrt{\frac{s_0^2 \cdot T_{\rm B} }{4 \cdot N_0 } } \hspace{0.1cm}\right ),$$
- $$p_{\rm B} = {\rm Q}\left ( \sqrt{\frac{E_{\rm B} }{N_0 } } \hspace{0.1cm}\right ) = {1}/{2}\cdot {\rm erfc}\left ( \sqrt{\frac{E_{\rm B} }{2 \cdot N_0 } } \right ).$$
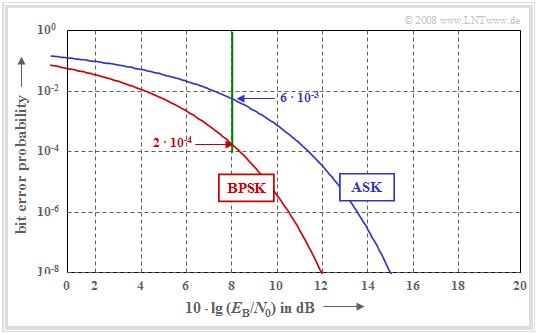
The double–logarithmic diagram shows the bit error probabilities of ASK and BPSK depending on the quotient $E_{\rm B}/N_0$. This plot is suitable for comparison between these binary modulation schemes under the constraint of power limitation.
One can see from this plot:
- The ASK curve is $3 \ \rm dB$ to the right of the BPSK curve.
- For $p_{\rm B} = 10^{-8}$, one needs about $10 \cdot \lg (E_{\rm B}/N_0) = 12 \ \rm dB$ for BPSK, but about $15 \ \rm dB$ for ASK.
- The system comparison at the fixed abscissa value $10 \cdot \lg (E_{\rm B}/N_0) = 8 \ \rm dB$ yields $p_{\rm B} = 2 \cdot 10^{-4}$ for BPSK and $p_{\rm B} = 6 \cdot 10^{-3}$ for ASK.
Error probabilities for 4–QAM and 4–PSK
Quadrature amplitude modulation (QAM) has already been described in detail in the book "Modulation Methods". From the signal space mapping and the signal waveforms it can be seen:
- The 4–QAM can be represented by two mutually orthogonal BPSK systems with cosine and minus–sine carriers, respectively.
- The binary source signal $q(t)$ with bit duration $T_{\rm B}$ ⇒ bit rate $R_{\rm B}$ is split into two sub-signals $q_{\rm I}(t)$ ⇒ in-phase component and $q_{\rm Q}(t)$ ⇒ quadrature component with half rate each (serial–parallel–conversion ). The symbol duration of $q_{\rm I}(t)$ and $q_{\rm Q}(t)$, respectively, is $T = 2\cdot T_{\rm B}$ ; the symbol rate is each $R_{\rm B}/2$.
- The amplitudes of the two mutually orthogonal carrier signals are chosen to be smaller by a factor of $\sqrt{2}$ than in BPSK, so that the envelope of the transmitted signal $s(t)$ is again $s_0$.
The QAM error probability is the same as that of the two orthogonal BPSK systems. Because of the smaller signal amplitude and the lower symbol rate, the following applies:
- $$p_{\rm B} = {\rm Q}\left ( \frac{s_0/\sqrt{2}}{\sigma_d } \right ) \hspace{0.3cm}{\rm with}\hspace{0.3cm}{\sigma_d}^2 = \frac{N_0 }{2 \cdot T_{\rm B}} \hspace{0.3cm}\Rightarrow \hspace{0.3cm}p_{\rm B} = {\rm Q}\left ( \sqrt{\frac{s_0^2 }{2} \cdot \frac{2 \cdot T_{\rm B} }{N_0}}\hspace{0.1cm}\right )= {\rm Q}\left ( \sqrt{{2 \cdot E_{\rm B}}/{N_0 }} \hspace{0.1cm}\right ).$$
$\text{Conclusion:}$
- Although 4–QAM can transmit twice the amount of information compared to BPSK, it results in exactly the same bit error probability $E_{\rm B}/{N_0 }$ as a function of $p_{\rm B}$.
- It is taken into account here that also for 4–QAM the following applies for the average energy per bit: $E_{\rm B} = {1}/{2}\cdot s_0^2 \cdot T_{\rm B}.$
- Since quaternary phase modulation (4–PSK) differs from 4–QAM only by a phase shift of $45^\circ$, the same bit error probability also results for 4–PSK when suitable decision regions are considered.
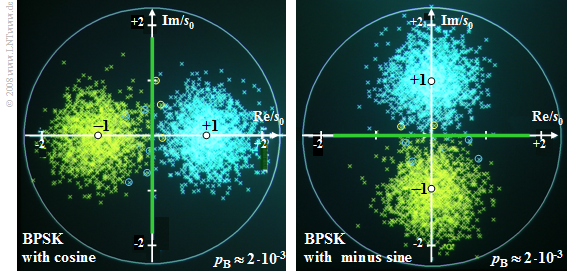
$\text{Example 1:}$ The diagram shows two different phase diagrams of Binary Phase Shift Keying (BPSK):
- The two diagrams differ only in the carrier phase. In both cases, $10 \cdot \lg (E_{\rm B}/N_0) = 6 \ \rm dB$.
- In the left diagram, bit errors (highlighted by circles) are indicated by yellow crosses to the right of the vertical decision threshold and by blue crosses in the left half plane.
- In the right diagram, yellow crosses above the horizontal threshold and blue crosses below indicate bit errors.
- The distance of the useful samples without noise (marked by the white dots) from the respective decision threshold (marked in green) is each $s_0$.
- The variance of the detection samples – recognizable by the radius of the point clouds – is due to $E_{\rm B} = {1}/{2}\cdot s_0^2 \cdot T_{\rm B}$ equal to
- $$\sigma_d^2 = \frac{N_0 }{ T_{\rm B} }= \frac{s_0^2/2 }{ E_{\rm B}/N_0}.$$
- With $10 \cdot \lg (E_{\rm B}/N_0) = 6 \ \rm dB$ ⇒ $E_{\rm B}/N_0 = 10^{0.6} \approx 4$ this gives:
- $$ {\sigma_d^2 }/{ {s_0}^2}= \big [ { 2 \cdot 10^{0.6} }\big ]^{-1} \approx 0.125\hspace{0.3cm}\Rightarrow \hspace{0.3cm} { {\sigma_d} }/{ {s_0} }\approx 0.35 \hspace{0.5cm} \Rightarrow \hspace{0.5cm}p_{\rm B} = {\rm Q}\left ( s_0/{\sigma_d } \right )= {\rm Q}\left ( \sqrt{2 \cdot 10^{0.6} } \hspace{0.08cm}\right ) = {\rm Q}(2.8) \approx 2 \cdot 10^{-3}.$$
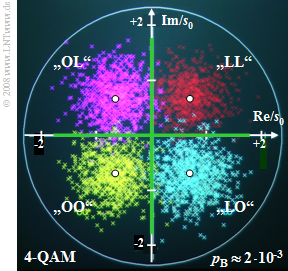
$\text{Example 2:}$ Now we consider a phase diagram of 4–QAM, which can be thought of as two orthogonal BPSK systems with cosine and minus sinusoidal carriers.
- Here, a bit error occurs when the horizontal or the vertical decision threshold is exceeded.
- In the diagram, such a bit error can be recognized when a cross does not match its quadrant in terms of color.
- The distance of the now four useful samples without noise (white dots) from the origin is again $s_0$.
- However, the distance to the decision thresholds is smaller by a factor of $\sqrt{2}$ for 4–QAM than for BPSK.
- The noise rms value $\sigma_d$ is smaller for 4–QAM than for BPSK by the same factor $\sqrt{2}$.
- Thus, the bit error probabilities of 4–QAM and BPSK are the same: $p_{\rm B} \approx 2 \cdot 10^{-3}.$
Phase offset between transmitter and receiver
Prerequisite for the validity of the previous equations is a strict synchronicity between the carrier signals added at the transmitter and receiver. Now, a phase offset $\Delta \phi_{\rm T}$ between the two carrier signals $z(t)$ and $z_{\rm E} (t)$ is assumed, while frequency synchronicity is still assumed.
The diagram shows the phase diagrams for $\Delta \phi_{\rm T} = 30^\circ$. It can be seen:
- For both BPSK (left) and 4–QAM (right), a phase offset by $\Delta \phi_{\rm T}$ causes a corresponding rotation of the phase diagram.
- With BPSK, the phase shift causes a smaller useful signal by $\cos\Delta \phi_{\rm T}$. We have already noticed the same effect with the synchronous demodulator of an analog transmission system.
- Consequently, the distance of the signal component of the detection signal from the decision threshold also becomes smaller by the same factor, which leads to a higher error probability:
- $$p_{\rm B} = {\rm Q}\left ( \sqrt{{2 \cdot E_{\rm B}}/{N_0 }} \hspace{0.1cm}\cdot \cos({\rm \Delta} \phi_{\rm T})\right ) .$$
- With the numerical values underlying here $10 \cdot \lg (E_{\rm B}/N_0) = 6 \ \rm dB$ and $\Delta \phi_{\rm T} = 30^\circ)$, the error probability of the BPSK (left diagram) increases from $p_{\rm B} \approx 0.2\%$ to about $p_{\rm B} \approx 0.6\%$.
- In contrast, for the 4–QAM (right diagram), the error probability increases almost by a factor of $40$ under the same conditions: $p_{\rm B} \approx 8\%$.
- If $|\Delta \phi_{\rm T}| < 45^\circ$, the following general equation holds for the 4–QAM (see Exercise 1.9 ):
- $$p_{\rm B} = 1/2 \cdot {\rm Q}\left ( \sqrt{\frac{2 \cdot E_{\rm B}}{N_0 }} \hspace{0.1cm}\cdot \frac{\cos(45^\circ)}{\cos(45^\circ+{\rm \Delta} \phi_{\rm T})}\right) + 1/2 \cdot {\rm Q}\left ( \sqrt{\frac{2 \cdot E_{\rm B}}{N_0 }} \hspace{0.1cm}\cdot \frac{\cos(45^\circ)}{\cos(45^\circ-{\rm \Delta} \phi_{\rm T})}\right).$$
$\text{Conclusion:}$
- Although 4–QAM can be used to transmit twice the information as BPSK over the same channel, under ideal conditions both systems have the same error probability.
- However, under non-ideal conditions – for example, when there is a phase offset – the error probability of 4–QAM increases much more than that of BPSK.
Baseband model for ASK and BPSK
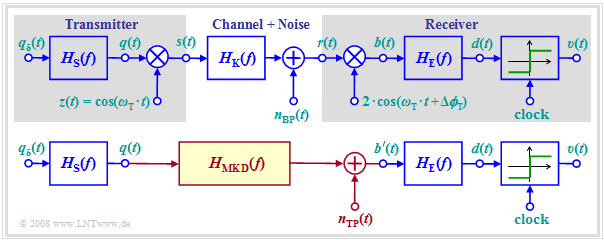
The diagram above shows again the overall block diagram of a carrier frequency system with coherent demodulation, which is valid for ASK (unipolar amplitude coefficients) and BPSK (bipolar coefficients) in the same way.
- Multiplication by the carrier signal $z(t)$ shifts the spectrum $Q(f)$ of the source signal – and accordingly the power-spectral density ${\it \Phi}_q(f)$ – on both sides by the carrier frequency $(\pm f_{\rm T})$.
- After the channel, this shift is reversed by the synchronous demodulator.
If one assumes the equivalent baseband model according to the diagram below, the calculation of the signals after the demodulator can be simplified:
- One virtually truncates the influence of modulator and demodulator and replaces the bandpass channel with the frequency response $H_{\rm K}(f)$ by a suitable lowpass transmission function $H_{\rm MKD}(f)$, where the index stands for "modulator–channel–demodulator" (Modulator–Kanal–Demodulator).
- Considering a phase difference $\Delta \phi_{\rm T}$ between the carrier signals of transmitter and receiver, we obtain for the resulting transmission function:
- $$H_{\rm MKD}(f) = {1}/{2} \cdot \big [ {\rm e}^{\hspace{0.04cm}-{\rm j} \hspace{0.04cm}\cdot \hspace{0.04cm}{\rm \Delta} \phi_{\rm T}} \cdot H_{\rm K}(f-f_{\rm T}) +{\rm e}^{\hspace{0.04cm}{\rm j} \hspace{0.04cm}\cdot \hspace{0.04cm}{\rm \Delta} \phi_{\rm T}} \cdot H_{\rm K}(f+f_{\rm T})\big ] .$$
- For a real channel frequency response $f_{\rm T}$ that is symmetric about the carrier frequency $H_{\rm K}(f)$ – that is, if $H_{\rm K}(f_{\rm T}-f) = H_{\rm K}(f_{\rm T}+f)$ – this equation can be simplified as follows:
- $$H_{\rm MKD}(f) = \frac{\cos({\rm \Delta} \phi_{\rm T})}{2} \cdot \big [ H_{\rm K}(f-f_{\rm T}) + H_{\rm K}(f+f_{\rm T})\big ] .$$
- Thus, the signals $b\hspace{0.08cm}'(t)$ in the lower image and $b(t)$ after the demodulator of the bandpass system in the upper image are identical except for the $±2f_{\rm T}$ components. However, these components are eliminated by the $H_{\rm E}(f)$ receiver filter and need not be considered further.
$\text{Conclusion:}$
- The error probabilities of ASK and BPSK can thus also be computed with the simpler baseband model, and even when a distorting channel $H_{\rm K}(f)$ is present.
- It should be noted that the noise signal $n(t)$ must also be transformed into the lowpass region. For white noise, ${\it \Phi}_n(f) = N_0/2$ must be replaced by ${\it \Phi}_{n,\hspace{0.06cm}{\rm TP} }(f) = N_0$ for this purpose.
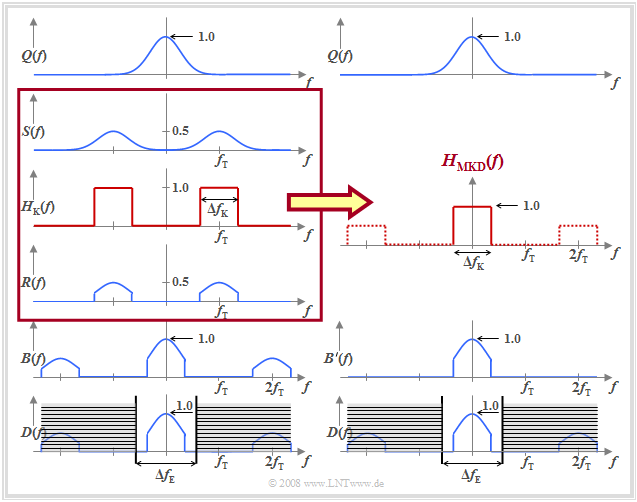
$\text{Example 3:}$ The diagram illustrates the baseband model by means of the amplitude spectra, assuming for simplicity:
- a Gaussian $Q(f)$,
- the BPSK modulation,
- a rectangular bandpass channel $H_{\rm K}(f)$,
- a phase-synchronous demodulation, and
- a likewise rectangular receiver filter $H_{\rm E}(f)$ with $\Delta f_{\rm E} > \Delta f_{\rm K}$.
It can be seen:
- The spectrum $D(f)$ of the detection signal $d(t)$ is correctly reproduced by the equivalent baseband model, although the spectra $B(f)$ and $B\hspace{0.05cm}'(f)$, respectively, differ by twice the carrier frequency.
- The resulting transmission function $H_{\rm MKD}(f)$ also accounts for the band limitation due to the channel, which in this example was assumed to be rectangular around the carrier frequency.
Exercises for the chapter
Exercise 1.08: Comparison of ASK and BPSK
Exercise 1.08Z: BPSK Error Probability
Exercise 1.10: BPSK Baseband Model
Exercise 1.10Z: Gaussian Band-pass


