Contents
- 1 Common block diagram for ASK and BPSK
- 2 Noise consideration for the BPSK system
- 3 Error probability of the optimal BPSK system
- 4 Error probability of the optimal ASK system
- 5 Error probabilities for 4–QAM and 4–PSK
- 6 Phase offset between transmitter and receiver
- 7 Basisbandmodell für ASK und BPSK
- 8 Aufgaben zum Kapitel
Common block diagram for ASK and BPSK
In the chapter Linear Digital Modulation of the book "Modulation Methods" the digital carrier frequency systems
have already been described in detail. In this chapter, the bit error probability of these systems is now calculated, assuming the outlined common block diagram.
In the following, the following assumptions apply again:
- Demodulation always occurs coherently. That means: A carrier signal $z_{\rm E}(t)$ with the same frequency as at the transmitter but with double amplitude is added at the receiver. Let the phase offset between the transmitter carrier signal $z(t)$ and the receiver carrier signal $z_{\rm E}(t)$ initially be $\Delta \phi_{\rm T} = 0$.
- For BPSK, the bipolar amplitude coefficients $a_\nu \in \{-1, +1\}$ are assumed and the decision threshold is $E = 0$. In contrast, for ASK, $a_\nu \in \{0, 1\}$ is valid. The decision threshold $E$ is to be chosen as best as possible for this unipolar case.
- We always consider the AWGN channel, that is, for the channel frequency response $H_{\rm K}(f) = 1$ and $n(t)$ represents white Gaussian noise with (one-sided) noise power density $N_0$.
- The equalization of linear channel distortions – i.e., the case $H_{\rm K}(f) \ne \rm const.$ – is possible in the same way as for baseband transmission. For this, please refer to the chapter Consideration of Channel Distortion and Equalization.
Noise consideration for the BPSK system
We first assume a bipolar rectangular source signal $q(t)$ with the values $\pm s_0$. Its normalized spectrum is: $H_{\rm S}(f) = {\rm si}(\pi f T)$.
Just as in baseband transmission, the smallest possible bit error probability for the receiver filter is $H_{\rm E}(f) = {H_{\rm S} }^\star(f) = {\rm si}(\pi f T)$. The signal waveforms of this matched filter receiver BPSK system show:
- The signal component of the detection signal $d_{\rm S}(t)$ – i.e., without noise component – is always $\pm s_0$ at all detection times $\nu \cdot T$, with the signs determined by the amplitude coefficients $a_\nu \in \{-1, +1\}$.
- As for the comparable baseband system, the error probability is $p_{\rm B} = {\rm Q}(s_0/\sigma_d)$, with the complementary Gaussian error interval ${\rm Q}(x)$.
Different from the baseband system, however, is the noise power. The noise component $b_{\rm N}(t)$ is obtained by multiplying the bandpass noise $n(t)$ by the receiver-side carrier $z_{\rm E}(t) =2 \cdot \cos(2\pi f t)$ and has the noise power density
- $${\it \Phi}_{b{\rm N}}(f)={\it \Phi}_{n}(f) \star \big[ 1^2 \cdot \delta ( f - f_{\rm T})+ 1^2 \cdot \delta ( f + f_{\rm T})\big].$$
The diagram illustrates this equation using bandlimited white noise with bandwidth $B_n$ as an example:
- While ${\it \Phi}_{n}(f = f_{\rm T}) = N_0/2$ holds, ${\it \Phi}_{b{\rm N}}(f=0) = N_0$.
- The components around $\pm 2f_{\rm T}$ are eliminated by the subsequent receiver filter $H_{\rm E}(f)$ and do not matter for further considerations.
- For true white noise, with the $B_n \to \infty$ boundary transition, for all frequencies:
- $${{\it \Phi}_{n}(f)}={N_0}/{2}, \hspace{0.3cm}{{\it \Phi}_{b{\rm N}}(f)}={N_0}.$$
Error probability of the optimal BPSK system
The observations just made show that to calculate the error probability of the BPSK system, one can dispense with the two multiplications by $z(t)$ and $z_{\rm E}(t) = 2 \cdot z(t)$ if one doubles the noise power.
This results in AWGN noise for the noise power before the decision:
- $$\sigma_d^2 = N_0 \cdot \int_{-\infty}^{+\infty} {\rm si}^2(\pi \hspace{0.01cm} f \hspace{0.05cm} T_{\rm B}) \,{\rm d} f = {N_0}/{T_{\rm B}},$$
i.e., twice the value as for baseband transmission. Note: To allow later comparison with quadrature amplitude modulation (QAM), the symbol duration $T$ has been replaced here by the bit duration $T_{\rm B}$. However, $T_{\rm B}=T$ is valid for BPSK (and also for ASK).
$\text{Conclusion:}$ Thus, the BPSK error probability with the two usual Gaussian error functions is:
- $$p_{\rm B} = {\rm Q}\left ( \sqrt{\frac{s_0^2 \cdot T_{\rm B} }{N_0 } }\hspace{0.1cm} \right ) = {1}/{2}\cdot {\rm erfc}\left ( \sqrt{\frac{s_0^2 \cdot T_{\rm B} }{2 \cdot N_0 } }\hspace{0.1cm} \right ).$$
If one further considers that the energy expended per bit with BPSK is
- $$E_{\rm B} = {1}/{2}\cdot s_0^2 \cdot T_{\rm B}$$
this equation can be transformed as follows:
- $$p_{\rm B} = {\rm Q}\left ( \sqrt{ {2 \cdot E_{\rm B} }/{N_0 } } \hspace{0.1cm}\right ) ={1}/{2}\cdot {\rm erfc}\left ( \sqrt{ {E_{\rm B} }/{N_0 } } \hspace{0.1cm}\right ).$$
This results in exactly the same formula as for baseband transmission, but where $E_{\rm B} = s_0^2 \cdot T_{\rm B}$ had to be used for the "energy per bit" and not $E_{\rm B} = {1}/{2}\cdot s_0^2 \cdot T_{\rm B}$.
Note: This last equation holds not only for rectangular source signal
⇒ $H_{\rm S}(f) = {\rm si}(\pi f T)$, but for any $H_{\rm S}(f)$, as long as
- the receiver filter $H_{\rm E}(f) = {H_{\rm S} }^\star(f)$ is exactly matched to the transmitter, and
- the product $H_{\rm S}(f) \cdot H_{\rm E}(f)$ satisfies the first Nyquist criterion.
Error probability of the optimal ASK system
We now consider an ASK system under the same conditions as the BPSK system. Here
- all signal component values of the detection signal $d_{\rm S}(\nu \cdot T)$ are either $0$ or $s_0$,
- accordingly their distance from the threshold $E = s_0/2$ is in each case $s_0/2$,
- the noise rms value $\sigma_d= \sqrt{N_0}/{T_{\rm B}}$ is exactly the same as for BPSK,
- the energy per bit is only half as large as for BPSK: $E_{\rm B} = {1}/{4}\cdot s_0^2 \cdot T_{\rm B}.$
$\text{Conclusion:}$ Thus the corresponding equations for the ASK error probability as a function of $s_0$ and of $E_{\rm B}$ are:
- $$p_{\rm B} = {\rm Q}\left ( \frac{s_0/2}{\sigma_d } \right )= {\rm Q}\left ( \sqrt{\frac{s_0^2 \cdot T_{\rm B} }{4 \cdot N_0 } } \hspace{0.1cm}\right ),\hspace{1cm}p_{\rm B} = {\rm Q}\left ( \sqrt{\frac{E_{\rm B} }{N_0 } } \hspace{0.1cm}\right ) = {1}/{2}\cdot {\rm erfc}\left ( \sqrt{\frac{E_{\rm B} }{2 \cdot N_0 } } \right ).$$
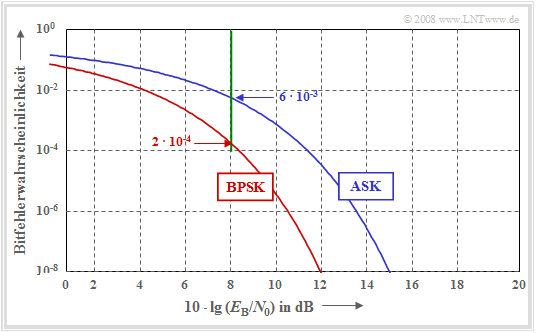
The diagram shows the bit error probabilities of ASK and BPSK depending on the quotient $E_{\rm B}/N_0$. This plot is suitable for comparison between these binary modulation schemes under the constraint of power limitation:
One can see from this double logarithmic plot:
- The ASK curve is $3 \ \rm dB$ to the right of the BPSK curve.
- For the error probability $p_{\rm B} = 10^{-8}$, one needs about $10 \cdot \lg (E_{\rm B}/N_0) = 12 \ \rm dB$ for BPSK, but about $15 \ \rm dB$ for ASK.
- The system comparison at the fixed abscissa value $10 \cdot \lg (E_{\rm B}/N_0) = 8 \ \rm dB$ yields $p_{\rm B} = 2 \cdot 10^{-4}$ for BPSK and $p_{\rm B} = 6 \cdot 10^{-3}$ for ASK.
Error probabilities for 4–QAM and 4–PSK
Quadrature amplitude modulation (QAM) has already been described in detail in the book "Modulation Methods". From the signal space mapping and the signal waveforms it can be seen:
- The 4–QAM can be represented by two mutually orthogonal BPSK systems with cosine and minus–sine carriers, respectively.
- The binary source signal $q(t)$ with bit duration $T_{\rm B}$ ⇒ bit rate $R_{\rm B}$ is split into two sub-signals $q_{\rm I}(t)$ ⇒ in-phase component and $q_{\rm Q}(t)$ ⇒ quadrature component with half rate each (serial–parallel–conversion ). The symbol duration of $q_{\rm I}(t)$ and $q_{\rm Q}(t)$, respectively, is $T = 2\cdot T_{\rm B}$ ; the symbol rate is each $R_{\rm B}/2$.
- The amplitudes of the two mutually orthogonal carrier signals are chosen to be smaller by a factor of $\sqrt{2}$ than in BPSK, so that the envelope of the transmitted signal $s(t)$ is again $s_0$.
The QAM error probability is the same as that of the two orthogonal BPSK systems. Because of the smaller signal amplitude and the lower symbol rate, the following applies:
- $$p_{\rm B} = {\rm Q}\left ( \frac{s_0/\sqrt{2}}{\sigma_d } \right ) \hspace{0.3cm}{\rm with}\hspace{0.3cm}{\sigma_d}^2 = \frac{N_0 }{2 \cdot T_{\rm B}} \hspace{0.3cm}\Rightarrow \hspace{0.3cm}p_{\rm B} = {\rm Q}\left ( \sqrt{\frac{s_0^2 }{2} \cdot \frac{2 \cdot T_{\rm B} }{N_0}}\hspace{0.1cm}\right )= {\rm Q}\left ( \sqrt{{2 \cdot E_{\rm B}}/{N_0 }} \hspace{0.1cm}\right ).$$
$\text{Conclusion:}$
- Although 4–QAM can transmit twice the amount of information compared to BPSK, it results in exactly the same bit error probability $E_{\rm B}/{N_0 }$ as a function of $p_{\rm B}$.
- It is taken into account here that also for 4–QAM the following applies for the average energy per bit: $E_{\rm B} = {1}/{2}\cdot s_0^2 \cdot T_{\rm B}.$
- Since quaternary phase modulation (4–PSK) differs from 4–QAM only by a phase shift of $45^\circ$, the same bit error probability also results for 4–PSK when suitable decision regions are considered.
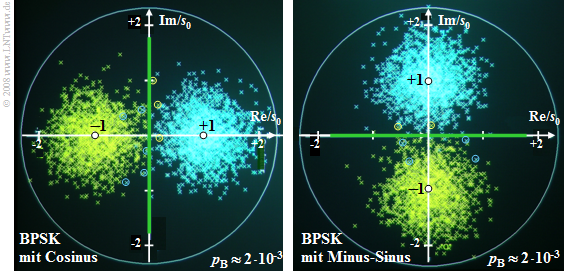
$\text{Example 1:}$ The diagram shows two different phase diagrams of Binary Phase Shift Keying (BPSK):
- The two diagrams differ only in the carrier phase. In both cases, $10 \cdot \lg (E_{\rm B}/N_0) = 6 \ \rm dB$.
- In the left diagram, bit errors (highlighted by circles) are indicated by yellow crosses to the right of the vertical decision threshold and by blue crosses in the left half plane.
- In the right diagram, yellow crosses above the horizontal threshold and blue crosses below indicate bit errors.
- The distance of the useful samples without noise (marked by the white dots) from the respective decision threshold (marked in green) is each $s_0$.
- The variance of the detection samples – recognizable by the radius of the point clouds – is due to $E_{\rm B} = {1}/{2}\cdot s_0^2 \cdot T_{\rm B}$ equal to
- $$\sigma_d^2 = \frac{N_0 }{ T_{\rm B} }= \frac{s_0^2/2 }{ E_{\rm B}/N_0}.$$
- With $10 \cdot \lg (E_{\rm B}/N_0) = 6 \ \rm dB$ ⇒ $E_{\rm B}/N_0 = 10^{0.6} \approx 4$ this gives:
- $$ {\sigma_d^2 }/{ {s_0}^2}= \big [ { 2 \cdot 10^{0.6} }\big ]^{-1} \approx 0.125\hspace{0.3cm}\Rightarrow \hspace{0.3cm} { {\sigma_d} }/{ {s_0} }\approx 0.35 \hspace{0.5cm} \Rightarrow \hspace{0.5cm}p_{\rm B} = {\rm Q}\left ( s_0/{\sigma_d } \right )= {\rm Q}\left ( \sqrt{2 \cdot 10^{0.6} } \hspace{0.08cm}\right ) = {\rm Q}(2.8) \approx 2 \cdot 10^{-3}.$$
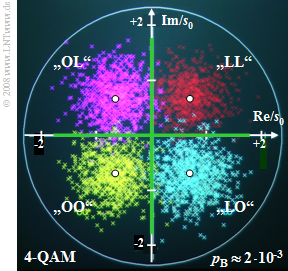
$\text{Example 2:}$ Now we consider a phase diagram of 4–QAM, which can be thought of as two orthogonal BPSK systems with cosine and minus sinusoidal carriers.
- Here, a bit error occurs when the horizontal or the vertical decision threshold is exceeded.
- In the diagram, such a bit error can be recognized when a cross does not match its quadrant in terms of color.
- The distance of the now four useful samples without noise (white dots) from the origin is again $s_0$.
- However, the distance to the decision thresholds is smaller by a factor of $\sqrt{2}$ for 4–QAM than for BPSK.
- The noise rms value $\sigma_d$ is smaller for 4–QAM than for BPSK by the same factor $\sqrt{2}$.
- Thus, the bit error probabilities of 4–QAM and BPSK are the same: $p_{\rm B} \approx 2 \cdot 10^{-3}.$
Phase offset between transmitter and receiver
Voraussetzung für die Gültigkeit der bisherigen Gleichungen ist eine strenge Synchronität zwischen den bei Sender und Empfänger zugesetzten Trägersignalen. Nun wird ein Phasenversatz $\Delta \phi_{\rm T}$ zwischen den beiden Trägersignalen $z(t)$ und $z_{\rm E} (t)$ angenommen, während weiterhin von Frequenzsynchronität ausgegangen wird.
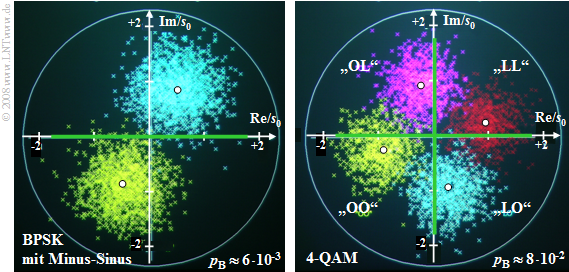
Die Grafik zeigt die Phasendiagramme für $\Delta \phi_{\rm T} = 30^\circ$. Man erkennt:
- Sowohl bei BPSK (links) als auch bei der 4–QAM (rechts) bewirkt ein Phasenversatz um $\Delta \phi_{\rm T}$ eine entsprechende Drehung des Phasendiagramms.
- Bei BPSK bewirkt der Phasenversatz ein um $\cos\Delta \phi_{\rm T}$ kleineres Nutzsignal. Den gleichen Effekt haben wir bereits beim Synchrondemodulator eines analogen Übertragungssystems festgestellt.
- Demzufolge wird auch der Abstand des Detektionsnutzsignals von der Entscheiderschwelle um den gleichen Faktor geringer, was zu einer höheren Fehlerwahrscheinlichkeit führt:
- $$p_{\rm B} = {\rm Q}\left ( \sqrt{{2 \cdot E_{\rm B}}/{N_0 }} \hspace{0.1cm}\cdot \cos({\rm \Delta} \phi_{\rm T})\right ) .$$
- Mit den hier zugrundeliegenden Zahlenwerten $10 \cdot \lg (E_{\rm B}/N_0) = 6 \ \rm dB$ und $\Delta \phi_{\rm T} = 30^\circ)$ erhöht sich die Fehlerwahrscheinlichkeit der BPSK (linkes Diagramm) von $p_{\rm B} \approx 0.2\%$ auf etwa $p_{\rm B} \approx 0.6\%$.
- Dagegen wird bei der 4–QAM (rechtes Diagramm) die Fehlerwahrscheinlichkeit bei gleichen Bedingungen nahezu um den Faktor $40$ größer: $p_{\rm B} \approx 8\%$.
- Falls $|\Delta \phi_{\rm T}| < 45^\circ$ ist, gilt für die 4–QAM folgende allgemeine Gleichung (siehe Aufgabe 1.9 ):
- $$p_{\rm B} = 1/2 \cdot {\rm Q}\left ( \sqrt{\frac{2 \cdot E_{\rm B}}{N_0 }} \hspace{0.1cm}\cdot \frac{\cos(45^\circ)}{\cos(45^\circ+{\rm \Delta} \phi_{\rm T})}\right) + 1/2 \cdot {\rm Q}\left ( \sqrt{\frac{2 \cdot E_{\rm B}}{N_0 }} \hspace{0.1cm}\cdot \frac{\cos(45^\circ)}{\cos(45^\circ-{\rm \Delta} \phi_{\rm T})}\right).$$
$\text{Fazit:}$
- Obwohl man mit der 4–QAM über den gleichen Kanal die doppelte Information wie bei BPSK übertragen kann, weisen bei idealen Bedingungen beide Systeme die gleiche Fehlerwahrscheinlichkeit auf.
- Bei nicht idealen Bedingungen – zum Beispiel bei einem Phasenversatz – steigt allerdings die Fehlerwahrscheinlichkeit der 4–QAM sehr viel stärker an als bei BPSK.
Basisbandmodell für ASK und BPSK
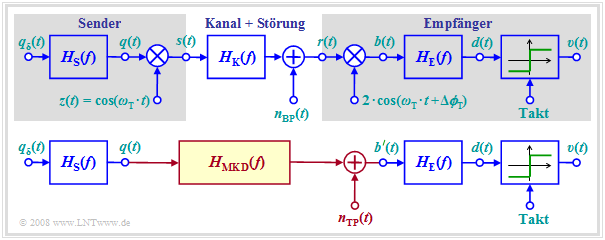
Die Grafik zeigt oben nochmals das Gesamtblockschaltbild eines Trägerfrequenzsystems mit kohärenter Demodulation, das für ASK (unipolare Amplitudenkoeffizienten) und BPSK (bipolare Koeffizienten) in gleicher Weise gültig ist.
- Durch die Multiplikation mit dem Trägersignal $z(t)$ wird das Spektrum $Q(f)$ des Quellensignals – und dementsprechend auch das Leistungsdichtespektrum ${\it \Phi}_q(f)$ – beidseitig um die Trägerfrequenz $(\pm f_{\rm T})$ verschoben.
- Nach dem Kanal wird diese Verschiebung durch den Synchrondemodulator wieder rückgängig gemacht.
Geht man vom äquivalenten Basisbandmodell entsprechend der unteren Grafik aus, so lässt sich die Berechnung der Signale nach dem Demodulator vereinfachen:
- Man kürzt quasi den Einfluss von Modulator und Demodulator und ersetzt den Bandpasskanal mit dem Frequenzgang $H_{\rm K}(f)$ durch eine geeignete Tiefpass–Übertragungsfunktion $H_{\rm MKD}(f)$, wobei der Index für "Modulator–Kanal–Demodulator" steht.
- Unter Berücksichtigung einer Phasendifferenz $\Delta \phi_{\rm T}$ zwischen den Trägersignalen von Sender und Empfänger erhält man für die resultierende Übertragungsfunktion:
- $$H_{\rm MKD}(f) = {1}/{2} \cdot \big [ {\rm e}^{\hspace{0.04cm}-{\rm j} \hspace{0.04cm}\cdot \hspace{0.04cm}{\rm \Delta} \phi_{\rm T}} \cdot H_{\rm K}(f-f_{\rm T}) +{\rm e}^{\hspace{0.04cm}{\rm j} \hspace{0.04cm}\cdot \hspace{0.04cm}{\rm \Delta} \phi_{\rm T}} \cdot H_{\rm K}(f+f_{\rm T})\big ] .$$
- Bei einem reellen und um die Trägerfrequenz $f_{\rm T}$ symmetrischen Kanalfrequenzgang $H_{\rm K}(f)$ – also falls $H_{\rm K}(f_{\rm T}-f) = H_{\rm K}(f_{\rm T}+f)$ gilt – kann man diese Gleichung wie folgt vereinfachen:
- $$H_{\rm MKD}(f) = \frac{\cos({\rm \Delta} \phi_{\rm T})}{2} \cdot \big [ H_{\rm K}(f-f_{\rm T}) + H_{\rm K}(f+f_{\rm T})\big ] .$$
- Die Signale $b\hspace{0.08cm}'(t)$ im unteren Bild und $b(t)$ nach dem Demodulator des Bandpass–Systems im oberen Bild sind somit bis auf die $±2f_{\rm T}$–Anteile identisch. Diese Anteile werden jedoch durch das Empfangsfilter $H_{\rm E}(f)$ eliminiert und müssen nicht weiter berücksichtigt werden.
$\text{Fazit:}$
- Die Fehlerwahrscheinlichkeiten von ASK und BPSK können somit auch mit dem einfacheren Basisbandmodell berechnet werden, und zwar auch dann, wenn ein verzerrender Kanal $H_{\rm K}(f)$ vorliegt.
- Zu beachten ist, dass auch das Rauschsignal $n(t)$ in den Tiefpassbereich transformiert werden muss. Bei weißem Rauschen muss hierzu ${\it \Phi}_n(f) = N_0/2$ durch ${\it \Phi}_{n,\hspace{0.06cm}{\rm TP} }(f) = N_0$ ersetzt werden.
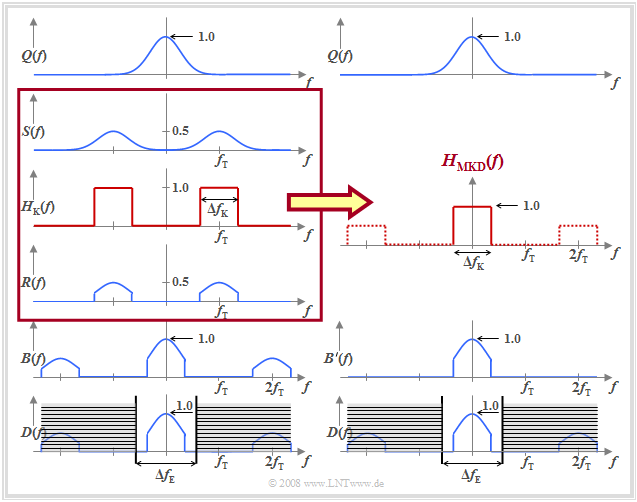
$\text{Beispiel 3:}$ Die Grafik verdeutlicht das Basisbandmodell anhand der Amplitudenspektren, wobei vereinfachend vorausgesetzt wird:
- ein gaußförmiges $Q(f)$,
- die BPSK–Modulation,
- ein rechteckförmiger Bandpasskanal $H_{\rm K}(f)$,
- eine phasensynchrone Demodulation, und
- ein ebenfalls rechteckförmiges Empfangsfilter $H_{\rm E}(f)$ mit $\Delta f_{\rm E} > \Delta f_{\rm K}$.
Man erkennt:
- Das Spektrum $D(f)$ des Detektionssignals $d(t)$ wird durch das äquivalente Basisbandmodell richtig wiedergegeben, obwohl sich die Spektren $B(f)$ bzw. $B\hspace{0.05cm}'(f)$ um die doppelte Trägerfrequenz unterscheiden.
- Die resultierende Übertragungsfunktion $H_{\rm MKD}(f)$ berücksichtigt auch die Bandbegrenzung durch den Kanal, der in diesem Beispiel als rechteckförmig um die Trägerfrequenz angenommen wurde.
Aufgaben zum Kapitel
Aufgabe 1.8: Vergleich ASK und BPSK
Aufgabe 1.8Z: BPSK-Fehlerwahrscheinlichkeit
Aufgabe 1.10: BPSK–Basisbandmodell


