Difference between revisions of "Information Theory/AWGN Channel Capacity for Discrete-Valued Input"
| (130 intermediate revisions by 8 users not shown) | |||
| Line 1: | Line 1: | ||
{{LastPage}} | {{LastPage}} | ||
{{Header | {{Header | ||
| − | |Untermenü= | + | |Untermenü=Information Theory for Continuous Random Variables |
| − | |Vorherige Seite= | + | |Vorherige Seite=AWGN Channel Capacity for Continuous Input |
|Nächste Seite= | |Nächste Seite= | ||
}} | }} | ||
| − | == | + | ==AWGN model for discrete-time band-limited signals== |
| + | <br> | ||
| + | At the end of the [[Information_Theory/AWGN–Kanalkapazität_bei_wertkontinuierlichem_Eingang#Channel_capacity_of_the_AWGN_channel|"last chapter"]], the AWGN model was used according to the left graph, characterized by the two random variables $X$ and $Y$ at the input and output and the stochastic noise $N$ as the result of a mean-free Gaussian random process ⇒ "white noise" with variance $σ_N^2$. The noise power $P_N$ is also equal to $σ_N^2$. | ||
| − | + | [[File:EN_Inf_T_4_3_S1a.png|right|frame|Two largely equivalent models for the AWGN channel<br><br><br><br>]] | |
| − | + | *The maximum mutual information $I(X; Y)$ between input and output ⇒ channel capacity $C$ is obtained when there is a Gaussian input PDF $f_X(x)$. | |
| − | + | *With the transmission power $P_X = σ_X^2$ ⇒ variance of the random variable $X$, the channel capacity equation is: | |
| − | $$C = 1/2 \cdot {\rm log}_2 \hspace{0.1cm} ( 1 + {P_X}/{P_N}) | + | :$$C = 1/2 \cdot {\rm log}_2 \hspace{0.1cm} ( 1 + {P_X}/{P_N}) |
\hspace{0.05cm}.$$ | \hspace{0.05cm}.$$ | ||
| − | + | *Now we describe the AWGN channel model according to the sketch on the right, where the sequence $〈X_ν〉$ is applied to the channel input, where the distance between successive values is $T_{\rm A}$. | |
| − | |||
| − | + | *This sequence is the discrete-time equivalent of the continuous-time signal $X(t)$ after band-limiting and sampling. | |
| − | + | *The relationship between the two models can be established by means of a graph, which is described in more detail below. | |
| − | * | ||
| − | |||
| − | + | {{BlaueBox|TEXT= $\text{The main findings at the outset:}$ | |
| − | + | *In the right-hand model, the same relationship $Y_ν = X_ν + N_ν$ applies at the sampling times $ν·T_{\rm A}$ as in the left-hand model. | |
| − | $$X_{\delta}(t) = T_{\rm A} \cdot \hspace{-0.1cm} \sum_{\nu = - \infty }^{+\infty} X_{\nu} \cdot | + | |
| + | *The noise component $N_ν$ is now to be modelled by band-limited $(±B)$ white noise with the two-sided power density ${\it Φ}_N(f) = N_0/2$, where $B = 1/(2T_{\rm A})$ must hold ⇒ see [[Signal_Representation/Discrete-Time_Signal_Representation#Sampling_theorem|"sampling theorem"]].}} | ||
| + | |||
| + | |||
| + | $\text{ Interpretation:}$ | ||
| + | |||
| + | In the modified model, we assume an infinite sequence $〈X_ν〉$ of Gaussian random variables impressed on a [[Signal_Representation/Discrete-Time_Signal_Representation#Time_domain_representation|"Dirac comb"]] $p_δ(t)$. The resulting discrete-time signal is thus: | ||
| + | |||
| + | :$$X_{\delta}(t) = T_{\rm A} \cdot \hspace{-0.1cm} \sum_{\nu = - \infty }^{+\infty} X_{\nu} \cdot | ||
\delta(t- \nu \cdot T_{\rm A} | \delta(t- \nu \cdot T_{\rm A} | ||
)\hspace{0.05cm}.$$ | )\hspace{0.05cm}.$$ | ||
| + | [[File:EN_Inf_T_4_3_S1b_v2.png|right|frame| AWGN model considering time discretization and band-limitation]] | ||
| − | + | The spacing of all $($weighted$)$ "Dirac delta functions" is uniform $T_{\rm A}$. Through the interpolation filter with the impulse response $h(t)$ as well as the frequency response $H(f)$, where | |
| − | |||
| − | $$h(t) = 1/T_{\rm A} \cdot {\rm | + | :$$h(t) = 1/T_{\rm A} \cdot {\rm sinc}(t/T_{\rm A}) \quad \circ\!\!\!-\!\!\!-\!\!\!-\!\!\bullet \quad H(f) = |
| − | \left\{ \begin{array}{c} 1 \\ 0 \\ \end{array} \right. \begin{array}{*{20}c} {\rm{ | + | \left\{ \begin{array}{c} 1 \\ 0 \\ \end{array} \right. \begin{array}{*{20}c} {\rm{for}} \hspace{0.3cm} |f| \le B, \\ {\rm{for}} \hspace{0.3cm} |f| > B, \\ \end{array},$$ |
| − | + | ||
| + | where the (one-sided) bandwidth $B = 1/(2T_{\rm A})$, the continuous-time signal $X(t)$ is obtained with the following properties: | ||
| + | *The samples $X(ν·T_{\rm A})$ are identical to the input values $X_ν$ for all integers $ν$, which can be justified by the equidistant zeros of the [[Signal_Representation/Special_Cases_of_Pulses#Rectangular_pulse| $\text{function $\text{sinc}(x) = \sin(\pi x)/(\pi x)$}$]]. | ||
| + | *According to the sampling theorem, $X(t)$ is ideally band-limited to the spectral range ⇒ rectangular frequency response $H(f)$ of the one-sided bandwidth $B$. | ||
| − | |||
| − | |||
| − | |||
| − | + | {{BlaueBox|TEXT= | |
| + | $\text{Noise power:}$ After adding the noise component $N(t)$ with the (two-sided) power density ${\it Φ}_N(t) = N_0/2$, the matched filter $\rm (MF)$ with sinc–shaped impulse response follows. The following then applies to the »'''noise power at the matched filter output'''«: | ||
| − | $$P_N = {\rm E}[N_\nu^2] = \frac{N_0}{2T_{\rm A}} = N_0 \cdot B\hspace{0.05cm}.$$ | + | :$$P_N = {\rm E}\big[N_\nu^2 \big] = \frac{N_0}{2T_{\rm A} } = N_0 \cdot B\hspace{0.05cm}.$$}} |
| + | |||
| − | {{ | + | {{BlaueBox|TEXT= |
| − | + | $\text{Proof:}$ | |
| + | With $B = 1/(2T_{\rm A} )$ one obtains for the impulse response $h_{\rm E}(t)$ and the spectral function $H_{\rm E}(f)$: | ||
| − | $$h_{\rm E}(t) = 2B \cdot {\rm si}(2\pi \cdot B \cdot t) \quad \circ\!\!\!-\!\!\!-\!\!\!-\!\!\bullet \quad H_{\rm E}(f) = | + | :$$h_{\rm E}(t) = 2B \cdot {\rm si}(2\pi \cdot B \cdot t) \quad \circ\!\!\!-\!\!\!-\!\!\!-\!\!\bullet \quad H_{\rm E}(f) = |
| − | \left\{ \begin{array}{c} 1 \\ 0 \\ \end{array} \right. \begin{array}{*{20}c} | + | \left\{ \begin{array}{c} 1 \\ 0 \\ \end{array} \right. |
| + | \begin{array}{*{20}c} \text{for} \hspace{0.3cm} \vert f \vert \le B, \\ \text{for} \hspace{0.3cm} \vert f \vert > B. \\ \end{array} | ||
| + | $$ | ||
| − | + | It follows, according to the insights of the book [[Theory_of_Stochastic_Signals/Stochastic_System_Theory#System_model_and_problem_definition|"Theory of Stochastic Signals"]]: | |
| − | $$P_N = | + | :$$P_N = |
\int_{-\infty}^{+\infty} | \int_{-\infty}^{+\infty} | ||
| − | \hspace{-0.3cm} {\it \Phi}_N (f) \cdot | + | \hspace{-0.3cm} {\it \Phi}_N (f) \cdot \vert H_{\rm E}(f)\vert^2 |
\hspace{0.15cm}{\rm d}f = \int_{-B}^{+B} | \hspace{0.15cm}{\rm d}f = \int_{-B}^{+B} | ||
\hspace{-0.3cm} {\it \Phi}_N (f) | \hspace{-0.3cm} {\it \Phi}_N (f) | ||
\hspace{0.15cm}{\rm d}f = \frac{N_0}{2} \cdot 2B = N_0 \cdot B | \hspace{0.15cm}{\rm d}f = \frac{N_0}{2} \cdot 2B = N_0 \cdot B | ||
| + | \hspace{0.05cm}.$$}} | ||
| + | |||
| + | |||
| + | Further: | ||
| + | *If one samples the matched filter output at equidistant intervals $T_{\rm A}$, the same constellation $Y_ν = X_ν + N_ν$ as before results for the time instants $ν ·T_{\rm A}$. | ||
| + | |||
| + | *The noise component $N_ν$ in the discrete-time output $Y_ν$ is thus "band-limited" and "white". The channel capacity equation thus needs to be adjusted only slightly. | ||
| + | |||
| + | *With $E_{\rm S} = P_X \cdot T_{\rm A}$ ⇒ transmission energy within a symbol duration $T_{\rm A}$ ⇒ »'''energy per symbol'''« then holds: | ||
| + | |||
| + | :$$C = {1}/{2} \cdot {\rm log}_2 \hspace{0.1cm} ( 1 + \frac {P_X}{N_0 \cdot B}) | ||
| + | = {1}/{2} \cdot {\rm log}_2 \hspace{0.1cm} ( 1 + \frac {2 \cdot P_X \cdot T_{\rm A}}{N_0}) | ||
| + | = {1}/{2} \cdot {\rm log}_2 \hspace{0.1cm} ( 1 + \frac {2 \cdot E_{\rm S}}{N_0}) | ||
\hspace{0.05cm}.$$ | \hspace{0.05cm}.$$ | ||
| − | |||
| − | + | ||
| − | + | ==The channel capacity $C$ as a function of $E_{\rm S}/N_0$ == | |
| − | + | <br> | |
| − | $ | + | {{GraueBox|TEXT= |
| − | = | + | $\text{Example 1:}$ The graphic shows the variation of the AWGN channel capacity as a function of the quotient $E_{\rm S}/N_0$, where the left axis and the red labels are valid: |
| − | + | [[File:EN_Inf_T_4_3_S2a.png|right|frame|Channel capacities $C$ and $C^{\hspace{0.05cm}*}$ as a function of $E_{\rm S}/N_0$]] | |
| + | :$$C = {1}/{2} \cdot {\rm log}_2 \hspace{0.1cm} ( 1 + \frac { 2 \cdot E_{\rm S} }{N_0}); | ||
| + | \hspace{0.5cm}{\rm unit\hspace{-0.15cm}: \hspace{0.05cm}bit/channel\hspace{0.15cm}use} | ||
\hspace{0.05cm}.$$ | \hspace{0.05cm}.$$ | ||
| − | $ | + | The $($pseudo–$)$unit "bit/channel use" is sometimes also referred to |
| + | *as "bit/source symbol" | ||
| + | |||
| + | *or "bit/symbol" for short. | ||
| + | |||
| − | + | ⇒ The right $($blue$)$ axis label takes into account the result of the "sampling theorem" ⇒ $B = 1/(2T_{\rm A})$ and | |
| + | *thus provides an upper bound for the bit rate $R$ of a digital system | ||
| − | + | *that is still possible for this AWGN channel: | |
| − | $$C = \frac{ | + | :$$C^{\hspace{0.05cm}*} = \frac{C}{T_{\rm A} } = B \cdot {\rm log}_2 \hspace{0.1cm} ( 1 + \frac { 2 \cdot E_{\rm S} }{N_0}); |
| − | \hspace{0.5cm}{\rm | + | \hspace{0.5cm}{\rm unit\hspace{-0.15cm}: \hspace{0.05cm}bit/second} |
| − | + | \hspace{0.05cm}.$$}} | |
| + | |||
| − | |||
| − | [[File: | + | {{GraueBox|TEXT= |
| + | $\text{Example 2:}$ | ||
| + | Often one gives the quotient of symbol energy $(E_{\rm S})$ and AWGN noise power density $(N_0)$ logarithmically. | ||
| + | [[File:EN_Inf_T_4_3_S2b.png|right|frame|AWGN channel capacities $C$ and $C^{\hspace{0.05cm}*}$ as a function of $10 \cdot \lg \ E_{\rm S}/N_0$]] | ||
| − | |||
| − | $$C^{\hspace{0.05cm}*} | + | This graph shows the channel capacities $C$ resp. $C^{\hspace{0.05cm}*}$ |
| − | + | *as a function of $10 · \lg (E_{\rm S}/N_0)$ | |
| − | |||
| − | + | *in the range from $-20 \ \rm dB$ to $+30 \ \rm dB$. | |
| − | |||
| − | |||
| − | |||
| − | |||
| − | |||
| − | + | From about $10 \ \rm dB$ onwards, a $($nearly$)$ linear curve results here. | |
| − | |||
| − | |||
| − | |||
| − | + | }} | |
| − | + | ||
| − | + | ==System model for the interpretation of the AWGN channel capacity== | |
| − | + | <br> | |
| + | In order to discuss the [[Information_Theory/Anwendung_auf_die_Digitalsignalübertragung#Definition_and_meaning_of_channel_capacity|"Channel Coding Theorem"]] in the context of the AWGN channel, | ||
| + | [[File:EN_Inf_T_4_3_S3.png|right|frame|Model for the interpretation of the AWGN channel capacity]] | ||
| − | $$ | + | *we still need an "encoder", |
| − | + | ||
| − | + | *but here the "encoder" is characterized in information-theoretic terms by the code rate $R$ alone. | |
| + | |||
| + | |||
| + | The graph describes the transmission system considered by Shannon with the blocks source, encoder, AWGN channel, decoder and receiver. In the background you can see an original figure from a paper about the Shannon theory. We have drawn in red some designations and explanations for the following text: | ||
| + | *The source symbol $U$ comes from an alphabet with $M_U = |U| = 2^k$ symbols and can be represented by $k$ equally probable statistically independent binary symbols. | ||
| − | * | + | *The alphabet of the code symbol $X$ has the symbol set size $M_X = |X| = 2^n$, where $n$ results from the code rate $R = k/n$ . |
| − | |||
| − | $ | ||
| − | |||
| − | |||
| − | + | *Thus, for code rate $R = 1$ ⇒ $n = k$. The case $n > k$ leads to a code rate $R < 1$. | |
| + | <br clear=all> | ||
| + | {{BlaueBox|TEXT= $\text{Channel Coding Theorem}$ | ||
| + | This states that there is $($at least$)$ one code of rate $R$ that leads to symbol error probability $p_{\rm S} = \text{Pr}(V ≠ U) \equiv 0$ if the following conditions are satisfied: | ||
| + | *The code rate $R$ is not larger than the channel capacity $C$. | ||
| − | + | *Such a suitable code is infinitely long: $n → ∞$. Therefore, a Gaussian distribution $f_X(x)$ at the channel input is indeed possible, which has always been the basis of the previous calculation of the AWGN channel capacity: | |
| + | :$$C = {1}/{2} \cdot {\rm log}_2 \hspace{0.1cm} ( 1 + \frac { 2 \cdot E_{\rm S} }{N_0}) | ||
| + | \hspace{1.2cm}{\rm unit\hspace{-0.15cm}: \hspace{0.05cm}\text{bit/channel use} } | ||
| + | \hspace{0.05cm}.$$ | ||
| + | *Thus, the channel input quantity $X$ is continuous in value. The same is true for $U$ and for the quantities $Y$ and $V$ after the AWGN channel. | ||
| − | + | *For a system comparison, however, the "energy per symbol" $(E_{\rm S} )$ is unsuitable. | |
| − | * | + | |
| + | *A comparison should rather be based on the "energy per information bit" $(E_{\rm B})$ ⇒ "energy per bit" for short. Thus, with $E_{\rm B} = E_{\rm S}/R$ also holds: | ||
| − | $$C = | + | :$$C = {1}/{2} \cdot {\rm log}_2 \hspace{0.1cm} ( 1 + \frac { 2 \cdot R \cdot E_{\rm B} }{N_0}) |
| − | \hspace{0. | + | \hspace{0.7cm}{\rm unit\hspace{-0.15cm}: bit/channel \hspace{0.15cm}use} |
\hspace{0.05cm}.$$ | \hspace{0.05cm}.$$ | ||
| − | + | These two equations are discussed in the next section.}} | |
| − | + | ||
| − | $$C = | + | |
| − | \hspace{ | + | |
| + | ==The channel capacity $C$ as a function of $E_{\rm B}/N_0$== | ||
| + | <br> | ||
| + | {{GraueBox|TEXT= | ||
| + | $\text{Example 3:}$ This graph shows the AWGN channel capacity $C$ | ||
| + | [[File:EN_Inf_T_4_3_S4.png|right|frame|The AWGN channel capacitance in two different representations.<br> The pseudo–unit "bit/symbol" is identical to "bit/channel use".]] | ||
| + | ⇒ as a function of $10 · \lg (E_{\rm S}/N_0)$ ⇒ <u>red curve</u>: | ||
| + | ::$$C = {1}/{2} \cdot {\rm log}_2 \hspace{0.1cm} ( 1 + \frac { 2 \cdot E_{\rm S} }{N_0}) | ||
| + | \hspace{1.5cm}{\rm unit\hspace{-0.15cm}: \hspace{0.05cm}bit/symbol} | ||
\hspace{0.05cm}.$$ | \hspace{0.05cm}.$$ | ||
| + | Red numbers: Capacity $C$ in "bit/symbol" for abscissas <br> | ||
| + | :$$10 · \lg (E_{\rm S}/N_0) = -20 \ \rm dB, -15 \ \rm dB$, ... , $+30\ \rm dB:$$ | ||
| − | + | ⇒ as a function of $10 · \lg (E_{\rm B}/N_0)$ ⇒ <u>green curve</u>: | |
| + | ::$$C = {1}/{2} \cdot {\rm log}_2 \hspace{0.1cm} ( 1 + \frac { 2 \cdot R \cdot E_{\rm B} }{N_0}) | ||
| + | \hspace{1.0cm}{\rm unit\hspace{-0.15cm}: \hspace{0.05cm}bit/symbol} | ||
| + | \hspace{0.05cm}.$$ | ||
| + | Green numbers: Required $10 · \lg (E_{\rm B}/N_0)$ in "dB" for ordinate $($in "bit/symbol"$)$. | ||
| + | :$$C = 0,\ 1, \text{...} , 5.$$ | ||
| + | ⇒ The detailed $C(E_{\rm B}/N_0)$ calculation can be found in [[Aufgaben:Exercise_4.8:_Numerical_Analysis_of_the_AWGN_Channel_Capacity|"Exercise 4.8"]]. | ||
| + | <br clear=all> | ||
| + | In the following, we interpret the green $C(E_{\rm B}/N_0)$ result in comparison to the red $C(E_{\rm S}/N_0)$ curve: | ||
| + | #Because of $E_{\rm S} = R · E_{\rm B}$, the Intersection of both curves is at $C (= R) = 1$ bit/symbol. Required are $10 · \lg (E_{\rm S}/N_0) =10 · \lg (E_{\rm B}/N_0) = 1.76$ dB.<br> | ||
| + | #For $C > 1$ the green curve always lies above the red curve, e.g. for $10 · \lg (E_{\rm B}/N_0) = 20$ dB ⇒ $C ≈ 5$; for $10 · \lg (E_{\rm S}/N_0) = 20$ dB ⇒ $C = 3.83$.<br> | ||
| + | #Comparison in horizontal direction: $C = 3$ bit/symbol is already achievable with $10 · \lg (E_{\rm B}/N_0) \approx 10$ dB, but one needs $10 · \lg (E_{\rm S}/N_0) \approx 15$ dB. | ||
| + | #For $C < 1$ , the red curve is always above the green one. For any $E_{\rm S}/N_0 > 0$ ⇒ $C > 0$. | ||
| + | #Thus, for logarithmic abscissa as in the present plot, the red curve extends to "minus infinity". | ||
| + | #The green curve ends at $E_{\rm B}/N_0 = \ln (2) = 0.693$ ⇒ $10 · \lg (E_{\rm B}/N_0)= -1.59$ dB ⇒ absolute limit for $($error-free$)$ transmission over AWGN.}} | ||
| − | |||
| − | + | ==AWGN channel capacity for binary input signals == | |
| − | + | <br> | |
| − | + | In the previous sections of this chapter we always assumed a Gaussian distributed,nbsp; i.e. a continuous-valued AWGN input $X$ according to Shannon theory. | |
| − | + | [[File:EN_Inf_T_4_3_S5a_v2.png|right|frame|Calculation of the AWGN channel capacity for BPSK]] | |
| − | + | [[File:EN_Inf_T_4_3_S5b.png|right|frame|Conditional PDF for $X=-1$ $($red$)$ and $X=+1$ $($blue$)$ ]] | |
| − | |||
| + | Now we consider the binary case and thus only now do justice to the title of the chapter "AWGN channel capacity for discrete-valued input”. The graph shows the underlying block diagram for [[Digital_Signal_Transmission/Linear_Digital_Modulation_-_Coherent_Demodulation#Common_block_diagram_for_ASK_and_BPSK|"Binary Phase Shift Keying"]] $\rm (BPSK)$ with binary input $U$ and binary output $V$. | ||
| + | *The best possible encoding is to achieve that the bit error probability becomes vanishingly small: $\text{Pr}(V ≠ U) \to 0 $ . | ||
| − | == | + | *The encoder output is characterized by the random variable $X \hspace{0.03cm}' = \{0, 1\}$ ⇒ $M_{X'} = 2$. The AWGN output $Y$ remains continuous-valued: $M_Y → ∞$. |
| − | + | *Mapping $X = 1 - 2X\hspace{0.03cm} '$ takes us from the unipolar representation to the bipolar description more suitable for BPSK: :$$X\hspace{0.03cm} ' = 0 → \ X = +1; \hspace{0.5cm} X\hspace{0.03cm} ' = 1 → X = -1.$$ | |
| − | + | *The AWGN channel is characterized by two conditional probability density functions $\rm (PDFs)$: | |
| + | :$$f_{Y\hspace{0.05cm}|\hspace{0.03cm}{X}}(y\hspace{0.05cm}|\hspace{0.03cm}{X}=+1) =\frac{1}{\sqrt{2\pi\sigma^2}} \cdot {\rm e}^{-{(y - 1)^2}/(2 \sigma^2)} \hspace{0.05cm}\hspace{0.05cm},\hspace{0.5cm}\text{short form:} \ \ f_{Y\hspace{0.05cm}|\hspace{0.03cm}{X}}(y\hspace{0.05cm}|\hspace{0.03cm}+1)\hspace{0.05cm},$$ | ||
| + | :$$f_{Y\hspace{0.05cm}|\hspace{0.03cm}{X}}(y\hspace{0.05cm}|\hspace{0.03cm}{X}=-1) =\frac{1}{\sqrt{2\pi\sigma^2}} \cdot {\rm e}^{-{(y + 1)^2}/(2 \sigma^2)} \hspace{0.05cm}\hspace{0.05cm},\hspace{0.5cm}\text{short form:} \ \ f_{Y\hspace{0.05cm}|\hspace{0.03cm}{X}}(y\hspace{0.05cm}|\hspace{0.03cm}-1)\hspace{0.05cm}.$$ | ||
| + | *Since here the signal $X$ is normalized to $±1$ ⇒ power $1$ instead of $P_X$, the variance of the AWGN noise $N$ must be normalized in the same way: $σ^2 = P_N/P_X$. | ||
| − | + | *The receiver makes a [[Channel_Coding/Channel_Models_and_Decision_Structures#Maximum-likelihood_decision_at_the_AWGN_channel|"maximum likelihood decision"]] from the real-valued random variable $Y$ $($at the AWGN channel output$)$ ⇒ the receiver output $V$ is binary $(0$ or $1)$. | |
| − | |||
| − | |||
| − | |||
| − | + | Based on this model, we now calculate the channel capacity of the AWGN channel. For a binary input variable $X$, this is generally | |
| + | :$$\text{Pr}(X = -1) = 1 - \text{Pr}(X = +1) \hspace{0.3cm} \Rightarrow \hspace{0.3cm} C_{\rm BPSK} = \max_{ {\rm Pr}({X} =+1)} \hspace{-0.15cm} I(X;Y) \hspace{0.05cm}.$$ | ||
| + | Due to the symmetrical channel, it is obvious that the input probabilities | ||
| − | $$ | + | :$${\rm Pr}(X =+1) = {\rm Pr}(X =-1) = 0.5 $$ |
| − | |||
| − | |||
| − | + | will lead to the optimum. According to the section [[Information_Theory/AWGN–Kanalkapazität_bei_wertkontinuierlichem_Eingang#Calculation_of_mutual_information_with_additive_noise|"Calculation of mutual information with additive noise"]], there are several calculation possibilities: | |
| − | + | ||
| − | + | *$ C_{\rm BPSK} = h(X) + h(Y) - h(XY)\hspace{0.05cm},$ | |
| − | + | *$C_{\rm BPSK} = h(Y) - h(Y|X)\hspace{0.05cm},$ | |
| − | + | *$C_{\rm BPSK} = h(X) - h(X|Y)\hspace{0.05cm}. $ | |
| − | |||
| − | |||
| − | |||
| − | \hspace{0.05cm}. | ||
| − | |||
| − | |||
| − | |||
| − | + | [[File:EN_Inf_T_4_3_S6a.png|right|frame|Comparison of the channel capacity limits $C_{\rm BPSK}$ and $C_{\rm Gaussian}$; here, $10 · \lg (SNR)$ is drawn as a second, additional abscissa axis; "SNR" stands for "signal-to-noise ratio" ]] | |
| − | |||
| − | $ | ||
| − | C_{\rm | ||
| − | |||
| − | + | All results still have to be supplemented by the pseudo-unit "bit/channel use". We choose the middle equation here: | |
| − | * | + | *The conditional differential entropy required for this is equal to |
| − | + | :$$h(Y\hspace{0.03cm}|\hspace{0.03cm}X) = h(N) = 1/2 \cdot {\rm log}_2 \hspace{0.1cm}(2\pi{\rm e}\cdot \sigma^2) | |
| − | $$h(Y|X) = h(N) = 1/2 \cdot {\rm log}_2 \hspace{0.1cm}(2\pi{\rm e}\cdot \sigma^2) | ||
\hspace{0.05cm}. $$ | \hspace{0.05cm}. $$ | ||
| − | * | + | *The differential entropy $h(Y)$ is completely given by the PDF $f_Y(y)$. Using the conditional PDFs defined and sketched in the second graph on this page, we obtain: |
| − | + | :$$f_Y(y) = {1}/{2} \cdot \big [ f_{Y\hspace{0.03cm}|\hspace{0.03cm}{X}}(y\hspace{0.05cm}|\hspace{0.05cm}{X}=-1) + f_{Y\hspace{0.03cm}|\hspace{0.03cm}{X}}(y\hspace{0.05cm}|\hspace{0.05cm}{X}=+1) \big ]$$ | |
| − | $$f_Y(y) = | + | :$$\Rightarrow \hspace{0.3cm} h(Y) \hspace{-0.01cm}=\hspace{0.05cm} |
| − | |||
| − | $$\Rightarrow \hspace{0.3cm} h(Y) \hspace{-0.01cm}=\hspace{0.05cm} | ||
-\hspace{-0.7cm} \int\limits_{y \hspace{0.05cm}\in \hspace{0.05cm}{\rm supp}(f_Y)} \hspace{-0.65cm} f_Y(y) \cdot {\rm log}_2 \hspace{0.1cm} [f_Y(y)] \hspace{0.1cm}{\rm d}y | -\hspace{-0.7cm} \int\limits_{y \hspace{0.05cm}\in \hspace{0.05cm}{\rm supp}(f_Y)} \hspace{-0.65cm} f_Y(y) \cdot {\rm log}_2 \hspace{0.1cm} [f_Y(y)] \hspace{0.1cm}{\rm d}y | ||
\hspace{0.05cm}.$$ | \hspace{0.05cm}.$$ | ||
| − | + | *It is obvious that $h(Y)$ can only be determined by numerical integration, especially if we consider that $f_Y(y)$ in the overlap region results from the sum of two Gaussian functions. | |
| + | <br clear=all> | ||
| + | In the graph on the right, three curves are shown above the abscissa $10 · \lg (E_{\rm B}/N_0)$: | ||
| + | *the channel capacity $C_{\rm Gaussian}$, drawn in blue, valid for a Gaussian input quantity $X$ ⇒ $M_X → ∞$, | ||
| − | + | *the channel capacity $C_{\rm BPSK}$ drawn in green for the random quantity $X = (+1, –1)$, and | |
| − | + | *the red horizontal line marked "BPSK without coding". | |
| − | |||
| − | |||
| − | |||
| − | |||
| − | |||
| − | [[ | + | These curves can be interpreted as follows: |
| + | #The green curve $C_{\rm BPSK}$ indicates the maximum permissible code rate $R$ of "Binary Phase Shift Keying" at which the bit error probability $p_{\rm B} \equiv 0$ is possible for the given $E_{\rm B}/N_0$ by best possible coding. | ||
| + | #For all BPSK systems with coordinates $(10 · \lg \ E_{\rm B}/N_0, \ R)$ in the "green range" ⇒ $p_{\rm B} \equiv 0$ is achievable in principle. It is the task of communications engineers to find suitable codes for this. | ||
| + | #The BPSK curve always lies below the absolute Shannon limit curve $C_{\rm Gaussian}$ for $M_X → ∞$ $($blue curve$)$. In the lower range, $C_{\rm BPSK} ≈ C_{\rm Gaussian}$. For example, a BPSK system with $R = 1/2$ only has to provide a $0.1\ \rm dB$ larger $E_{\rm B}/N_0$ than required by the $($absolute$)$ channel capacity $C_{\rm Gaussian}$. | ||
| + | #If $E_{\rm B}/N_0$ is finite, $C_{\rm BPSK} < 1$ always applies ⇒ see [[Aufgaben:Exercise_4.9Z:_Is_Channel_Capacity_C_≡_1_possible_with_BPSK%3F|"Exercise 4.9Z"]]. BPSK with $R = 1$ $($and thus without coding$)$ will therefore always result in a bit error probability $p_{\rm B} > 0$. | ||
| + | #The bit error probabilities of such a BPSK system without coding $(R = 1)$ are indicated on the red horizontal line. To achieve $p_{\rm B} ≤ 10^{–5}$, one needs at least $10 · \lg (E_{\rm B}/N_0) = 9.6\ \rm dB$. According to the chapter [[Digital_Signal_Transmission/Linear_Digital_Modulation_-_Coherent_Demodulation#Error_probability_of_the_optimal_BPSK_system|"Error probability of the optimal BPSK system"]], these probabilities result in | ||
| − | + | :::$$p_{\rm B} = {\rm Q} \left ( {\rm \sqrt{SNR}}\right ) \hspace{0.45cm} {\rm with } \hspace{0.45cm} | |
| − | + | {\rm SNR }= 2\cdot E_{\rm B}/{N_0} | |
| − | + | \hspace{0.05cm}. $$ | |
| − | |||
| − | |||
| − | |||
| − | + | ==Comparison between theory and practice== | |
| + | <br> | ||
| + | Two graphs are used to show how far established channel codes approach the BPSK channel capacity $($green curve$)$. The rate $R = k/n$ of these codes or the capacity $C$ $($if the pseudo-unit "bit/channel use" is added$)$ is plotted as the ordinate. Provided is: | ||
| + | *the AWGN channel, marked by $10 · \lg (E_{\rm B}/N_0)$ in dB, and | ||
| − | $ | + | *for the realized codes marked by crosses, a [[Digital_Signal_Transmission/Error_Probability_for_Baseband_Transmission#Definition_of_the_bit_error_rate|"bit error rate"]] of $\rm BER=10^{–5}$. |
| − | |||
| − | |||
| − | |||
| + | Note that the channel capacity curves are always for $n → ∞$ and $\rm BER \equiv 0$. | ||
| + | *If one were to apply this strict requirement "error-free" also to the channel codes of finite code length $n$, $10 · \lg \ (E_{\rm B}/N_0) \to \infty$ would always be required. | ||
| + | |||
| + | *However, this is a rather academic problem, i.e. of little practical relevance. For $\text{BER} = 10^{–10}$, a qualitatively similar graph would result. | ||
| − | |||
| − | + | {{GraueBox|TEXT= | |
| − | + | $\text{Example 4:}$ | |
| − | + | The graph shows the characteristics of early systems with channel coding and classical decoding. Some explanations of the data follow, which were taken from the lecture [Liv10]<ref name = 'Liv10'>Liva, G.: Channel Coding. Lecture manuscript, Chair of Communications Engineering, TU München and DLR Oberpfaffenhofen, 2010.</ref>. The links in these explanations often refer to the $\rm LNTwww$ book [[Channel_Coding|"Channel Coding"]]. | |
| − | + | [[File:EN_Inf_T_4_3_S6a_v2.png|right|frame|Rates and required $E_{\rm B}/{N_0}$ of different channel codes]] | |
| − | [[ | + | #Points $\rm A$, $\rm B$, $\rm C$ marks [[Channel_Coding/Examples_of_Binary_Block_Codes#Hamming_Codes|"Hamming codes"]] of rates $R = 4/7 ≈ 0.57$, $R ≈ 0.73$ and $R ≈ 0.84$, resp. |
| + | #For $\text{BER} = 10^{–5}$, these very early codes $($from the 1950s$)$ all require $10 · \lg (E_{\rm B}/N_0) > 8\ \rm dB$. | ||
| + | #Point $\rm D$ indicates the binary [https://en.wikipedia.org/wiki/Binary_Golay_code "Golay code"] with rate $R = 1/2$ and point $\rm E$ a [https://en.wikipedia.org/wiki/Reed%E2%80%93Muller_code "Reed–Muller code"]. This very low-rate code was already used in 1971 on the [https://en.wikipedia.org/wiki/Mariner_program "Mariner 9 space probe"] . | ||
| + | #The [[Channel_Coding/Definition_and_Properties_of_Reed-Solomon_Codes#Generator_matrix_of_Reed-Solomon_codes|"Reed–Solomon codes"]] from the 1960s are a class of cyclic block codes. $\rm F$ marks an RS code of rate $223/255 \approx 0.875$ and a required $E_{\rm B}/N_0 < 6 \ \rm dB$. | ||
| + | #$\rm G$ and $\rm H$ denote two [[Channel_Coding/Grundlagen_der_Faltungscodierung|"convolutional codes"]] $\rm (CC)$ of medium rate. The code $\rm G$ was already used in 1972 for the [https://en.wikipedia.org/wiki/Pioneer_10 "Pioneer 10 mission"]. | ||
| + | #The channel coding of the [https://voyager.jpl.nasa.gov/mission/ "Voyager mission"] at the end of the 1970s is marked $\rm I$ . It is the [[Channel_Coding/Soft-in_Soft-Out_Decoder#Basic_structure_of_concatenated_coding_systems|"concatenation"]] of a $\text{CC(2, 1, 7)}$ with a Reed-Solomon code. | ||
| − | |||
| − | |||
| − | |||
| − | |||
| − | |||
| − | |||
| − | + | It should be noted that in the convolutional codes the third parameter has a different meaning than in the block codes. For example, the identifier $\text{(2, 1, 32)}$ indicates the memory $m = 32$ .}} | |
| − | |||
| − | |||
| + | {{GraueBox|TEXT= | ||
| + | $\text{Example 5:}$ | ||
| + | The early channel codes mentioned in $\text{Example 4}$ are still relatively far away from the channel capacity curve. This was probably also a reason why the author of this learning tutorial was unaware of the also great practical significance of information theory when he became acquainted with it in his studies in the early 1970s. The view changed significantly when very long channel codes together with iterative decoding appeared in the 1990s. The new marker points are much closer to the capacity limit curve. | ||
| + | <br clear=all> | ||
| + | [[File:EN_Inf_T_4_3_S6b_v2.png|right|frame|Rates and required $E_{\rm B}/{N_0}$ of iterative coding methods]] | ||
| + | Here are a few more explanations of this graph: | ||
| + | #Red crosses mark the so-called [https://en.wikipedia.org/wiki/Turbo_code "turbo codes"] according $\rm CCSDS$ $($"Consultative Committee for Space Data Systems"$)$ with $k = 6920$ information bits each and different code lengths $n = k/R$. | ||
| + | #These codes, invented by [https://en.wikipedia.org/wiki/Claude_Berrou $\text{Claude Berrou}$] around 1990, can be decoded iteratively. The $($red$)$ markings are each less than $1 \ \rm dB$ away from the Shannon bound. | ||
| + | #The [https://en.wikipedia.org/wiki/Low-density_parity-check_code "LDPC codes"] ("Low Density Parity–check Codes") with constant code length $n = 64800$ ⇒ white rectangles have been used since 2006 for [https://en.wikipedia.org/wiki/DVB-S "DVB–S2"] ("Digital Video Broadcast over Satellite"). | ||
| + | #They are very well suited for iterative decoding by means of [https://en.wikipedia.org/wiki/Factor_graph "text{Factor Graph"] and [https://en.wikipedia.org/wiki/EXIT_chart "Exit Charts"] due to the sparse one assignment of the check matrix. | ||
| + | #Black dots mark the [https://en.wikipedia.org/wiki/Low-density_parity-check_code "LDPC codes"] specified by $\rm CCSDS$ with constant number of information bits $(k = 16384)$ and variable word length $n = k/R$. This code class requires a similar $E_{\rm B}/N_0$ to the red crosses and white rectangles. | ||
| + | #Around the year 2000, many researchers had the ambition to approach the Shannon limit to within fractions of a $\rm dB$ . The yellow cross marks such a result $(0.0045 \ \rm dB)$ of [CFRU01]<ref name='CFRU01'> | ||
| + | Chung S.Y; Forney Jr., G.D.; Richardson, T.J.; Urbanke, R.: On the Design of Low-Density Parity- Check Codes within 0.0045 dB of the Shannon Limit. – <br>In: IEEE Communications Letters, vol. 5, no. 2 (2001), pp. 58–60.</ref> with an irregular LDPC code of rate $ R =1/2$ and length $n = 10^7$.}} | ||
| − | |||
| − | [ | + | {{BlaueBox|TEXT= |
| + | $\text{Conclusion:}$ | ||
| + | At this point, the brilliance and farsightedness of [https://en.wikipedia.org/wiki/Claude_Shannon $\text{Claude E. Shannon}$] should be emphasized once again: | ||
| + | *In 1948, he developed a theory that had not been known before, showing the possibilities, but also the limits of digital signal transmission. | ||
| − | + | *At that time, the first thoughts on digital signal transmission were only ten years old ⇒ [[Modulation_Methods/Pulscodemodulation|"pulse code modulation"]] [https://en.wikipedia.org/wiki/Alec_Reeves $\text{(Alec Reeves}$], 1938$)$ and even the pocket calculator did not arrive until more than twenty years later. | |
| − | * | ||
| − | |||
| − | |||
| + | *Shannon's work shows us that great things can also be done without gigantic computers.}} | ||
| − | |||
| − | |||
| + | == Channel capacity of the complex AWGN channel== | ||
| + | <br> | ||
| + | Higher-level modulation methods can each be represented by an "in-phase" and a "quadrature component". These include, for example | ||
| + | *the [[Modulation_Methods/Quadrature_Amplitude_Modulation#Quadratic_QAM_signal_space_constellations|$\text{M–QAM}$]] ⇒ quadrature amplitude modulation; $M ≥ 4$ quadrature signal space points, | ||
| − | + | *the [[Modulation_Methods/Quadrature_Amplitude_Modulation#Other_signal_space_constellations|$\text{M–PSK}$]] ⇒ $M ≥ 4$ signal space points arranged in a circle. | |
| − | |||
| − | |||
| − | |||
| − | + | The two components can also be described in the [[Signal_Representation/Equivalent_Low-Pass_Signal_and_its_Spectral_Function|"equivalent low-pass range"]] as the "real part" and the "imaginary part" of a complex noise term $N$, respectively. | |
| − | + | *All the above methods are two-dimensional. | |
| + | |||
| + | *The $($complex$)$ AWGN channel thus provides $K = 2$ independent Gaussian channels. | ||
| − | $$C_{\ | + | *According to the section [[Information_Theory/AWGN–Kanalkapazität_bei_wertkontinuierlichem_Eingang#Parallel_Gaussian_channels|"Parallel Gaussian channels"]], the capacity of such a channel is therefore given by: |
| + | [[File:P_ID2955__Inf_T_4_3_S7.png|right|frame|2D–PDF of complex Gaussian noise]] | ||
| + | :$$C_{\text{ Gaussian, complex} }= C_{\rm total} ( K=2) | ||
= {\rm log}_2 \hspace{0.1cm} ( 1 + \frac{P_X/2}{\sigma^2}) | = {\rm log}_2 \hspace{0.1cm} ( 1 + \frac{P_X/2}{\sigma^2}) | ||
\hspace{0.05cm}.$$ | \hspace{0.05cm}.$$ | ||
| + | *$P_X$ denotes the total useful power of the inphase and the quadrature components. | ||
| − | * | + | *In contrast, the variance $σ^2$ of the perturbation refers to only one dimension: $σ^2 = σ_{\rm I}^2 = σ_{\rm Q}^2$. |
| − | |||
| − | |||
| − | + | The sketch on the right shows the two-dimensional PDF $f_N(n)$ of the Gaussian noise process $N$ over the two axes: | |
| − | * $ | + | * $N_{\rm I}$ $($inphase component, real component$)$ and |
| − | |||
| − | + | * $N_{\rm Q}$ $($quadrature component, imaginary part$)$. | |
| + | |||
| + | |||
| + | Darker areas of the rotationally symmetrical PDF $f_N(n)$ around the zero point indicate more noise components. The following relationship applies to the variance of the complex Gaussian noise $N$ due to the rotational invariance $(σ_{\rm I} = σ_{\rm Q})$: | ||
| + | :$$\sigma_N^2 = \sigma_{\rm I}^2 + \sigma_{\rm Q}^2 = 2\cdot \sigma^2 | ||
| + | \hspace{0.05cm}.$$ | ||
| + | |||
| + | Thus, the channel capacity can also be expressed as follows: | ||
| − | $$\ | + | :$$C_{\text{ Gaussian, complex} }= {\rm log}_2 \hspace{0.1cm} ( 1 + \frac{P_X}{\sigma_N^2}) = {\rm log}_2 \hspace{0.1cm} ( 1 + SNR) |
\hspace{0.05cm}.$$ | \hspace{0.05cm}.$$ | ||
| − | + | The equation is evaluated numerically in the next section. However, we can already say that for the signal-to-noise power ratio will be: | |
| − | + | :$$\rm SNR = {P_X}/{\sigma_N^2} | |
| − | $$ | ||
\hspace{0.05cm}.$$ | \hspace{0.05cm}.$$ | ||
| − | + | ==Maximum code rate for QAM structures== | |
| − | + | <br> | |
| − | $$ | + | [[File:EN_Inf_T_4_3_S8a_neu.png|right|frame|Channel capacity of $\rm BPSK$ and $M\text{–QAM}$]] |
| + | The graph shows the capacity of the complex AWGN channel as a red curve: | ||
| + | :$$C_{\text{ Gaussian, complex} }= {\rm log}_2 \hspace{0.1cm} ( 1 + \rm SNR) | ||
\hspace{0.05cm}.$$ | \hspace{0.05cm}.$$ | ||
| + | *The unit of this channel capacity is "bit/channel use" or "bit/source symbol". | ||
| + | |||
| + | *The abscissa denotes the signal-to-interference power ratio $10 · \lg \rm (SNR)$ with $\rm {SNR} = P_X/σ_N^2$. | ||
| + | |||
| + | *The graph was taken from [Göb10]<ref name='Göb10'>Göbel, B.: Information–Theoretic Aspects of Fiber–Optic Communication Channels. Dissertation. TU München. <br>Verlag Dr. Hut, Reihe Informationstechnik, ISBN 978-3-86853-713-0, 2010.</ref>. We would like to thank our former colleague [[Biographies_and_Bibliographies/Beteiligte_der_Professur_Leitungsgebundene_Übertragungstechnik#Dr.-Ing._Bernhard_Göbel_(at_LÜT_from_2004-2010)|$\text{Bernhard Göbel}$]] for his permission to use this figure and for his great support of our learning tutorial during his entire active time. | ||
| + | |||
| − | |||
| − | + | According to Shannon theory, the red curve is again based on a Gaussian distribution $f_X(x)$ at the input. Additionally drawn in are ten further capacitance curves for discrete-valued input: | |
| + | *the curve for [[Modulation_Methods/Linear_Digital_Modulation#BPSK_.E2.80.93_Binary_Phase_Shift_Keying|"Binary Phase Shift Keying"]] $(\rm BPSK$, marked with "1" ⇒ $K = 1)$, | ||
| − | $$ | + | *the curve for [[Modulation_Methods/Quadrature_Amplitude_Modulation#Quadratic_QAM_signal_space_constellations|"$M$-step quadrature amplitude modulation"]] $($with $M = 2^K,\ K = 2$, ... , $10)$. |
| − | |||
| − | |||
| − | |||
| − | |||
| − | |||
| − | |||
| − | |||
| − | |||
| + | One can see from this representation: | ||
| + | #All curves $($BPSK and M–QAM$)$ lie right of the red "Shannon limit" curve. | ||
| + | #At low SNR, however, all curves are almost indistinguishable from the red curve. | ||
| + | #The final value of all curves for discrete-valued input signals is $K = \log_2 (M)$. For example, for $\rm SNR \to ∞$: $C_{\rm BPSK} = 1$ $($bit/use$)$, $C_{\rm 4-QAM} = C_{\rm QPSK} = 2$. | ||
| + | #The blue markings show that a $\rm 2^{10}–QAM$ with $10 · \lg \rm (SNR) ≈ 27 \ \rm dB$ allows a code rate of $R ≈ 8.2$. Distance to the Shannon curve: $1.53\ \rm dB$. | ||
| + | #Therefor the "shaping gain" is $10 · \lg (π \cdot {\rm e}/6) = 1.53 \ \rm dB$. This improvement can be achieved by changing the position of the $2^{10} = 32^2$ square signal space points to give a Gaussian-like input PDF ⇒ "signal shaping". | ||
| − | |||
| − | |||
| − | |||
| − | |||
| − | |||
| − | + | {{BlaueBox|TEXT= | |
| − | * | + | $\text{Conclusion:}$ |
| − | + | [[Aufgaben:Exercise_4.Ten:_QPSK_Channel_Capacity|"Exercise 4.10"]] discusses the AWGN capacity curves of BPSK and QPSK: | |
| − | $$C_{\rm QPSK} | + | *Starting from the abscissa $10 · \lg (E_{\rm B}/N_0)$ with $E_{\rm B}$ $($energy per information <u>bit</u>$)$ one arrives at the QPSK curve by doubling the BPSK curve: |
| + | :$$C_{\rm QPSK}\big [10 \cdot {\rm lg} \hspace{0.1cm}(E_{\rm B}/{N_0})\big ] | ||
= | = | ||
| − | 2 \cdot C_{\rm BPSK} | + | 2 \cdot C_{\rm BPSK}\big [10 \cdot {\rm lg} \hspace{0.1cm}(E_{\rm B}/{N_0}) \big ] .$$ |
| − | |||
| − | |||
| − | $$C_{\rm QPSK} | + | *However, if we compare BPSK and QPSK at the same energy $E_{\rm S}$ per information <u>symbol</u>, then: |
| + | :$$C_{\rm QPSK}[10 \cdot {\rm lg} \hspace{0.1cm}(E_{\rm S}/{N_0})] | ||
= | = | ||
| − | 2 \cdot C_{\rm BPSK} | + | 2 \cdot C_{\rm BPSK}[10 \cdot {\rm lg} \hspace{0.1cm}(E_{\rm S}/{N_0}) - 3\,{\rm dB}] .$$ |
| − | + | :This takes into account that with QPSK the energy in one dimension is only $E_{\rm S}/2$ .}} | |
| − | == Aufgaben | + | == Exercises for the chapter == |
| + | <br> | ||
| + | [[Aufgaben:Exercise_4.8:_Numerical_Analysis_of_the_AWGN_Channel_Capacity|Exercise 4.8: Numerical Analysis of the AWGN Channel Capacity]] | ||
| + | |||
| + | [[Aufgaben:Exercise_4.8Z:_What_does_the_AWGN_Channel_Capacity_Curve_say%3F|Exercise 4.8Z: What does the AWGN Channel Capacity Curve say?]] | ||
| + | |||
| + | [[Aufgaben:Exercise_4.9:_Higher-Level_Modulation|Exercise 4.9: Higher-Level Modulation]] | ||
| + | |||
| + | [[Aufgaben:Exercise_4.9Z:_Is_Channel_Capacity_C_≡_1_possible_with_BPSK%3F|Exercise 4.9Z: Is Channel Capacity C ≡ 1 possible with BPSK?]] | ||
| + | |||
| + | [[Aufgaben:Exercise_4.Ten:_QPSK_Channel_Capacity|Exercise 4.10: QPSK Channel Capacity]] | ||
| + | == References== | ||
{{Display}} | {{Display}} | ||
Latest revision as of 16:28, 28 February 2023
Contents
- 1 AWGN model for discrete-time band-limited signals
- 2 The channel capacity $C$ as a function of $E_{\rm S}/N_0$
- 3 System model for the interpretation of the AWGN channel capacity
- 4 The channel capacity $C$ as a function of $E_{\rm B}/N_0$
- 5 AWGN channel capacity for binary input signals
- 6 Comparison between theory and practice
- 7 Channel capacity of the complex AWGN channel
- 8 Maximum code rate for QAM structures
- 9 Exercises for the chapter
- 10 References
AWGN model for discrete-time band-limited signals
At the end of the "last chapter", the AWGN model was used according to the left graph, characterized by the two random variables $X$ and $Y$ at the input and output and the stochastic noise $N$ as the result of a mean-free Gaussian random process ⇒ "white noise" with variance $σ_N^2$. The noise power $P_N$ is also equal to $σ_N^2$.
- The maximum mutual information $I(X; Y)$ between input and output ⇒ channel capacity $C$ is obtained when there is a Gaussian input PDF $f_X(x)$.
- With the transmission power $P_X = σ_X^2$ ⇒ variance of the random variable $X$, the channel capacity equation is:
- $$C = 1/2 \cdot {\rm log}_2 \hspace{0.1cm} ( 1 + {P_X}/{P_N}) \hspace{0.05cm}.$$
- Now we describe the AWGN channel model according to the sketch on the right, where the sequence $〈X_ν〉$ is applied to the channel input, where the distance between successive values is $T_{\rm A}$.
- This sequence is the discrete-time equivalent of the continuous-time signal $X(t)$ after band-limiting and sampling.
- The relationship between the two models can be established by means of a graph, which is described in more detail below.
$\text{The main findings at the outset:}$
- In the right-hand model, the same relationship $Y_ν = X_ν + N_ν$ applies at the sampling times $ν·T_{\rm A}$ as in the left-hand model.
- The noise component $N_ν$ is now to be modelled by band-limited $(±B)$ white noise with the two-sided power density ${\it Φ}_N(f) = N_0/2$, where $B = 1/(2T_{\rm A})$ must hold ⇒ see "sampling theorem".
$\text{ Interpretation:}$
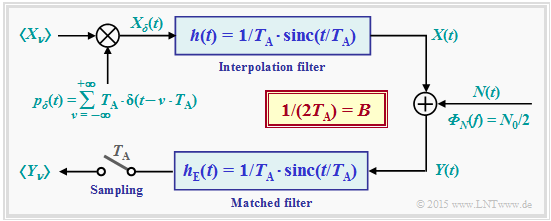
In the modified model, we assume an infinite sequence $〈X_ν〉$ of Gaussian random variables impressed on a "Dirac comb" $p_δ(t)$. The resulting discrete-time signal is thus:
- $$X_{\delta}(t) = T_{\rm A} \cdot \hspace{-0.1cm} \sum_{\nu = - \infty }^{+\infty} X_{\nu} \cdot \delta(t- \nu \cdot T_{\rm A} )\hspace{0.05cm}.$$
The spacing of all $($weighted$)$ "Dirac delta functions" is uniform $T_{\rm A}$. Through the interpolation filter with the impulse response $h(t)$ as well as the frequency response $H(f)$, where
- $$h(t) = 1/T_{\rm A} \cdot {\rm sinc}(t/T_{\rm A}) \quad \circ\!\!\!-\!\!\!-\!\!\!-\!\!\bullet \quad H(f) = \left\{ \begin{array}{c} 1 \\ 0 \\ \end{array} \right. \begin{array}{*{20}c} {\rm{for}} \hspace{0.3cm} |f| \le B, \\ {\rm{for}} \hspace{0.3cm} |f| > B, \\ \end{array},$$
where the (one-sided) bandwidth $B = 1/(2T_{\rm A})$, the continuous-time signal $X(t)$ is obtained with the following properties:
- The samples $X(ν·T_{\rm A})$ are identical to the input values $X_ν$ for all integers $ν$, which can be justified by the equidistant zeros of the $\text{function $\text{sinc}(x) = \sin(\pi x)/(\pi x)$}$.
- According to the sampling theorem, $X(t)$ is ideally band-limited to the spectral range ⇒ rectangular frequency response $H(f)$ of the one-sided bandwidth $B$.
$\text{Noise power:}$ After adding the noise component $N(t)$ with the (two-sided) power density ${\it Φ}_N(t) = N_0/2$, the matched filter $\rm (MF)$ with sinc–shaped impulse response follows. The following then applies to the »noise power at the matched filter output«:
- $$P_N = {\rm E}\big[N_\nu^2 \big] = \frac{N_0}{2T_{\rm A} } = N_0 \cdot B\hspace{0.05cm}.$$
$\text{Proof:}$ With $B = 1/(2T_{\rm A} )$ one obtains for the impulse response $h_{\rm E}(t)$ and the spectral function $H_{\rm E}(f)$:
- $$h_{\rm E}(t) = 2B \cdot {\rm si}(2\pi \cdot B \cdot t) \quad \circ\!\!\!-\!\!\!-\!\!\!-\!\!\bullet \quad H_{\rm E}(f) = \left\{ \begin{array}{c} 1 \\ 0 \\ \end{array} \right. \begin{array}{*{20}c} \text{for} \hspace{0.3cm} \vert f \vert \le B, \\ \text{for} \hspace{0.3cm} \vert f \vert > B. \\ \end{array} $$
It follows, according to the insights of the book "Theory of Stochastic Signals":
- $$P_N = \int_{-\infty}^{+\infty} \hspace{-0.3cm} {\it \Phi}_N (f) \cdot \vert H_{\rm E}(f)\vert^2 \hspace{0.15cm}{\rm d}f = \int_{-B}^{+B} \hspace{-0.3cm} {\it \Phi}_N (f) \hspace{0.15cm}{\rm d}f = \frac{N_0}{2} \cdot 2B = N_0 \cdot B \hspace{0.05cm}.$$
Further:
- If one samples the matched filter output at equidistant intervals $T_{\rm A}$, the same constellation $Y_ν = X_ν + N_ν$ as before results for the time instants $ν ·T_{\rm A}$.
- The noise component $N_ν$ in the discrete-time output $Y_ν$ is thus "band-limited" and "white". The channel capacity equation thus needs to be adjusted only slightly.
- With $E_{\rm S} = P_X \cdot T_{\rm A}$ ⇒ transmission energy within a symbol duration $T_{\rm A}$ ⇒ »energy per symbol« then holds:
- $$C = {1}/{2} \cdot {\rm log}_2 \hspace{0.1cm} ( 1 + \frac {P_X}{N_0 \cdot B}) = {1}/{2} \cdot {\rm log}_2 \hspace{0.1cm} ( 1 + \frac {2 \cdot P_X \cdot T_{\rm A}}{N_0}) = {1}/{2} \cdot {\rm log}_2 \hspace{0.1cm} ( 1 + \frac {2 \cdot E_{\rm S}}{N_0}) \hspace{0.05cm}.$$
The channel capacity $C$ as a function of $E_{\rm S}/N_0$
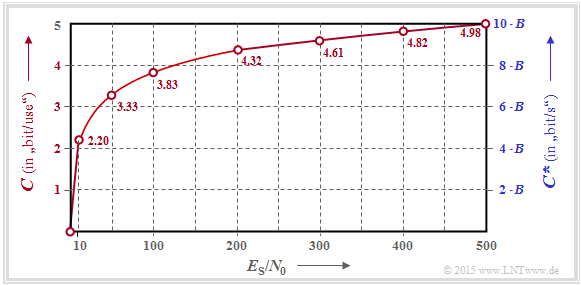
$\text{Example 1:}$ The graphic shows the variation of the AWGN channel capacity as a function of the quotient $E_{\rm S}/N_0$, where the left axis and the red labels are valid:
- $$C = {1}/{2} \cdot {\rm log}_2 \hspace{0.1cm} ( 1 + \frac { 2 \cdot E_{\rm S} }{N_0}); \hspace{0.5cm}{\rm unit\hspace{-0.15cm}: \hspace{0.05cm}bit/channel\hspace{0.15cm}use} \hspace{0.05cm}.$$
The $($pseudo–$)$unit "bit/channel use" is sometimes also referred to
- as "bit/source symbol"
- or "bit/symbol" for short.
⇒ The right $($blue$)$ axis label takes into account the result of the "sampling theorem" ⇒ $B = 1/(2T_{\rm A})$ and
- thus provides an upper bound for the bit rate $R$ of a digital system
- that is still possible for this AWGN channel:
- $$C^{\hspace{0.05cm}*} = \frac{C}{T_{\rm A} } = B \cdot {\rm log}_2 \hspace{0.1cm} ( 1 + \frac { 2 \cdot E_{\rm S} }{N_0}); \hspace{0.5cm}{\rm unit\hspace{-0.15cm}: \hspace{0.05cm}bit/second} \hspace{0.05cm}.$$
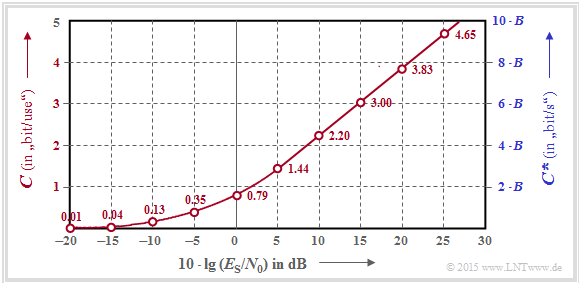
$\text{Example 2:}$ Often one gives the quotient of symbol energy $(E_{\rm S})$ and AWGN noise power density $(N_0)$ logarithmically.
This graph shows the channel capacities $C$ resp. $C^{\hspace{0.05cm}*}$
- as a function of $10 · \lg (E_{\rm S}/N_0)$
- in the range from $-20 \ \rm dB$ to $+30 \ \rm dB$.
From about $10 \ \rm dB$ onwards, a $($nearly$)$ linear curve results here.
System model for the interpretation of the AWGN channel capacity
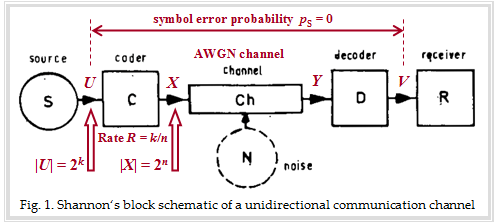
In order to discuss the "Channel Coding Theorem" in the context of the AWGN channel,
- we still need an "encoder",
- but here the "encoder" is characterized in information-theoretic terms by the code rate $R$ alone.
The graph describes the transmission system considered by Shannon with the blocks source, encoder, AWGN channel, decoder and receiver. In the background you can see an original figure from a paper about the Shannon theory. We have drawn in red some designations and explanations for the following text:
- The source symbol $U$ comes from an alphabet with $M_U = |U| = 2^k$ symbols and can be represented by $k$ equally probable statistically independent binary symbols.
- The alphabet of the code symbol $X$ has the symbol set size $M_X = |X| = 2^n$, where $n$ results from the code rate $R = k/n$ .
- Thus, for code rate $R = 1$ ⇒ $n = k$. The case $n > k$ leads to a code rate $R < 1$.
$\text{Channel Coding Theorem}$
This states that there is $($at least$)$ one code of rate $R$ that leads to symbol error probability $p_{\rm S} = \text{Pr}(V ≠ U) \equiv 0$ if the following conditions are satisfied:
- The code rate $R$ is not larger than the channel capacity $C$.
- Such a suitable code is infinitely long: $n → ∞$. Therefore, a Gaussian distribution $f_X(x)$ at the channel input is indeed possible, which has always been the basis of the previous calculation of the AWGN channel capacity:
- $$C = {1}/{2} \cdot {\rm log}_2 \hspace{0.1cm} ( 1 + \frac { 2 \cdot E_{\rm S} }{N_0}) \hspace{1.2cm}{\rm unit\hspace{-0.15cm}: \hspace{0.05cm}\text{bit/channel use} } \hspace{0.05cm}.$$
- Thus, the channel input quantity $X$ is continuous in value. The same is true for $U$ and for the quantities $Y$ and $V$ after the AWGN channel.
- For a system comparison, however, the "energy per symbol" $(E_{\rm S} )$ is unsuitable.
- A comparison should rather be based on the "energy per information bit" $(E_{\rm B})$ ⇒ "energy per bit" for short. Thus, with $E_{\rm B} = E_{\rm S}/R$ also holds:
- $$C = {1}/{2} \cdot {\rm log}_2 \hspace{0.1cm} ( 1 + \frac { 2 \cdot R \cdot E_{\rm B} }{N_0}) \hspace{0.7cm}{\rm unit\hspace{-0.15cm}: bit/channel \hspace{0.15cm}use} \hspace{0.05cm}.$$
These two equations are discussed in the next section.
The channel capacity $C$ as a function of $E_{\rm B}/N_0$
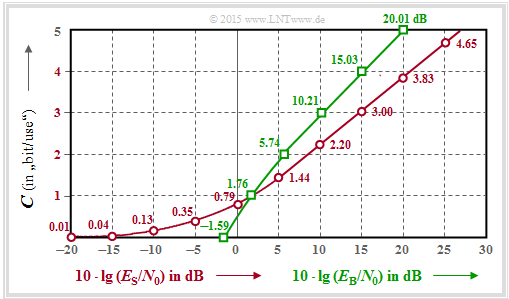
$\text{Example 3:}$ This graph shows the AWGN channel capacity $C$
⇒ as a function of $10 · \lg (E_{\rm S}/N_0)$ ⇒ red curve:
- $$C = {1}/{2} \cdot {\rm log}_2 \hspace{0.1cm} ( 1 + \frac { 2 \cdot E_{\rm S} }{N_0}) \hspace{1.5cm}{\rm unit\hspace{-0.15cm}: \hspace{0.05cm}bit/symbol} \hspace{0.05cm}.$$
Red numbers: Capacity $C$ in "bit/symbol" for abscissas
- $$10 · \lg (E_{\rm S}/N_0) = -20 \ \rm dB, -15 \ \rm dB$, ... , $+30\ \rm dB:$$
⇒ as a function of $10 · \lg (E_{\rm B}/N_0)$ ⇒ green curve:
- $$C = {1}/{2} \cdot {\rm log}_2 \hspace{0.1cm} ( 1 + \frac { 2 \cdot R \cdot E_{\rm B} }{N_0}) \hspace{1.0cm}{\rm unit\hspace{-0.15cm}: \hspace{0.05cm}bit/symbol} \hspace{0.05cm}.$$
Green numbers: Required $10 · \lg (E_{\rm B}/N_0)$ in "dB" for ordinate $($in "bit/symbol"$)$.
- $$C = 0,\ 1, \text{...} , 5.$$
⇒ The detailed $C(E_{\rm B}/N_0)$ calculation can be found in "Exercise 4.8".
In the following, we interpret the green $C(E_{\rm B}/N_0)$ result in comparison to the red $C(E_{\rm S}/N_0)$ curve:
- Because of $E_{\rm S} = R · E_{\rm B}$, the Intersection of both curves is at $C (= R) = 1$ bit/symbol. Required are $10 · \lg (E_{\rm S}/N_0) =10 · \lg (E_{\rm B}/N_0) = 1.76$ dB.
- For $C > 1$ the green curve always lies above the red curve, e.g. for $10 · \lg (E_{\rm B}/N_0) = 20$ dB ⇒ $C ≈ 5$; for $10 · \lg (E_{\rm S}/N_0) = 20$ dB ⇒ $C = 3.83$.
- Comparison in horizontal direction: $C = 3$ bit/symbol is already achievable with $10 · \lg (E_{\rm B}/N_0) \approx 10$ dB, but one needs $10 · \lg (E_{\rm S}/N_0) \approx 15$ dB.
- For $C < 1$ , the red curve is always above the green one. For any $E_{\rm S}/N_0 > 0$ ⇒ $C > 0$.
- Thus, for logarithmic abscissa as in the present plot, the red curve extends to "minus infinity".
- The green curve ends at $E_{\rm B}/N_0 = \ln (2) = 0.693$ ⇒ $10 · \lg (E_{\rm B}/N_0)= -1.59$ dB ⇒ absolute limit for $($error-free$)$ transmission over AWGN.
AWGN channel capacity for binary input signals
In the previous sections of this chapter we always assumed a Gaussian distributed,nbsp; i.e. a continuous-valued AWGN input $X$ according to Shannon theory.
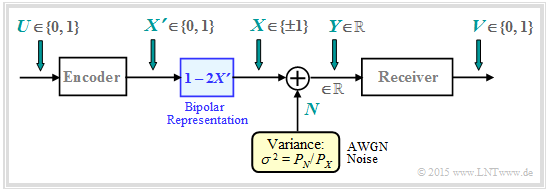
Now we consider the binary case and thus only now do justice to the title of the chapter "AWGN channel capacity for discrete-valued input”. The graph shows the underlying block diagram for "Binary Phase Shift Keying" $\rm (BPSK)$ with binary input $U$ and binary output $V$.
- The best possible encoding is to achieve that the bit error probability becomes vanishingly small: $\text{Pr}(V ≠ U) \to 0 $ .
- The encoder output is characterized by the random variable $X \hspace{0.03cm}' = \{0, 1\}$ ⇒ $M_{X'} = 2$. The AWGN output $Y$ remains continuous-valued: $M_Y → ∞$.
- Mapping $X = 1 - 2X\hspace{0.03cm} '$ takes us from the unipolar representation to the bipolar description more suitable for BPSK: :$$X\hspace{0.03cm} ' = 0 → \ X = +1; \hspace{0.5cm} X\hspace{0.03cm} ' = 1 → X = -1.$$
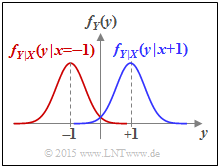
- The AWGN channel is characterized by two conditional probability density functions $\rm (PDFs)$:
- $$f_{Y\hspace{0.05cm}|\hspace{0.03cm}{X}}(y\hspace{0.05cm}|\hspace{0.03cm}{X}=+1) =\frac{1}{\sqrt{2\pi\sigma^2}} \cdot {\rm e}^{-{(y - 1)^2}/(2 \sigma^2)} \hspace{0.05cm}\hspace{0.05cm},\hspace{0.5cm}\text{short form:} \ \ f_{Y\hspace{0.05cm}|\hspace{0.03cm}{X}}(y\hspace{0.05cm}|\hspace{0.03cm}+1)\hspace{0.05cm},$$
- $$f_{Y\hspace{0.05cm}|\hspace{0.03cm}{X}}(y\hspace{0.05cm}|\hspace{0.03cm}{X}=-1) =\frac{1}{\sqrt{2\pi\sigma^2}} \cdot {\rm e}^{-{(y + 1)^2}/(2 \sigma^2)} \hspace{0.05cm}\hspace{0.05cm},\hspace{0.5cm}\text{short form:} \ \ f_{Y\hspace{0.05cm}|\hspace{0.03cm}{X}}(y\hspace{0.05cm}|\hspace{0.03cm}-1)\hspace{0.05cm}.$$
- Since here the signal $X$ is normalized to $±1$ ⇒ power $1$ instead of $P_X$, the variance of the AWGN noise $N$ must be normalized in the same way: $σ^2 = P_N/P_X$.
- The receiver makes a "maximum likelihood decision" from the real-valued random variable $Y$ $($at the AWGN channel output$)$ ⇒ the receiver output $V$ is binary $(0$ or $1)$.
Based on this model, we now calculate the channel capacity of the AWGN channel. For a binary input variable $X$, this is generally
- $$\text{Pr}(X = -1) = 1 - \text{Pr}(X = +1) \hspace{0.3cm} \Rightarrow \hspace{0.3cm} C_{\rm BPSK} = \max_{ {\rm Pr}({X} =+1)} \hspace{-0.15cm} I(X;Y) \hspace{0.05cm}.$$
Due to the symmetrical channel, it is obvious that the input probabilities
- $${\rm Pr}(X =+1) = {\rm Pr}(X =-1) = 0.5 $$
will lead to the optimum. According to the section "Calculation of mutual information with additive noise", there are several calculation possibilities:
- $ C_{\rm BPSK} = h(X) + h(Y) - h(XY)\hspace{0.05cm},$
- $C_{\rm BPSK} = h(Y) - h(Y|X)\hspace{0.05cm},$
- $C_{\rm BPSK} = h(X) - h(X|Y)\hspace{0.05cm}. $
All results still have to be supplemented by the pseudo-unit "bit/channel use". We choose the middle equation here:
- The conditional differential entropy required for this is equal to
- $$h(Y\hspace{0.03cm}|\hspace{0.03cm}X) = h(N) = 1/2 \cdot {\rm log}_2 \hspace{0.1cm}(2\pi{\rm e}\cdot \sigma^2) \hspace{0.05cm}. $$
- The differential entropy $h(Y)$ is completely given by the PDF $f_Y(y)$. Using the conditional PDFs defined and sketched in the second graph on this page, we obtain:
- $$f_Y(y) = {1}/{2} \cdot \big [ f_{Y\hspace{0.03cm}|\hspace{0.03cm}{X}}(y\hspace{0.05cm}|\hspace{0.05cm}{X}=-1) + f_{Y\hspace{0.03cm}|\hspace{0.03cm}{X}}(y\hspace{0.05cm}|\hspace{0.05cm}{X}=+1) \big ]$$
- $$\Rightarrow \hspace{0.3cm} h(Y) \hspace{-0.01cm}=\hspace{0.05cm} -\hspace{-0.7cm} \int\limits_{y \hspace{0.05cm}\in \hspace{0.05cm}{\rm supp}(f_Y)} \hspace{-0.65cm} f_Y(y) \cdot {\rm log}_2 \hspace{0.1cm} [f_Y(y)] \hspace{0.1cm}{\rm d}y \hspace{0.05cm}.$$
- It is obvious that $h(Y)$ can only be determined by numerical integration, especially if we consider that $f_Y(y)$ in the overlap region results from the sum of two Gaussian functions.
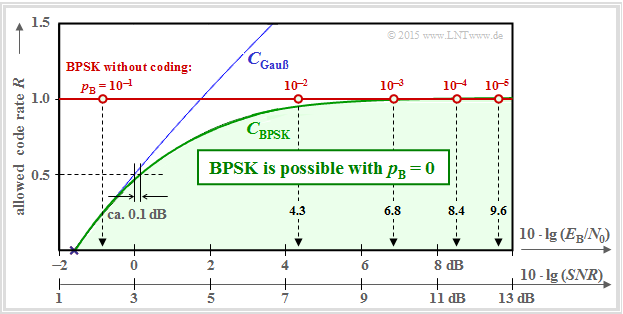
In the graph on the right, three curves are shown above the abscissa $10 · \lg (E_{\rm B}/N_0)$:
- the channel capacity $C_{\rm Gaussian}$, drawn in blue, valid for a Gaussian input quantity $X$ ⇒ $M_X → ∞$,
- the channel capacity $C_{\rm BPSK}$ drawn in green for the random quantity $X = (+1, –1)$, and
- the red horizontal line marked "BPSK without coding".
These curves can be interpreted as follows:
- The green curve $C_{\rm BPSK}$ indicates the maximum permissible code rate $R$ of "Binary Phase Shift Keying" at which the bit error probability $p_{\rm B} \equiv 0$ is possible for the given $E_{\rm B}/N_0$ by best possible coding.
- For all BPSK systems with coordinates $(10 · \lg \ E_{\rm B}/N_0, \ R)$ in the "green range" ⇒ $p_{\rm B} \equiv 0$ is achievable in principle. It is the task of communications engineers to find suitable codes for this.
- The BPSK curve always lies below the absolute Shannon limit curve $C_{\rm Gaussian}$ for $M_X → ∞$ $($blue curve$)$. In the lower range, $C_{\rm BPSK} ≈ C_{\rm Gaussian}$. For example, a BPSK system with $R = 1/2$ only has to provide a $0.1\ \rm dB$ larger $E_{\rm B}/N_0$ than required by the $($absolute$)$ channel capacity $C_{\rm Gaussian}$.
- If $E_{\rm B}/N_0$ is finite, $C_{\rm BPSK} < 1$ always applies ⇒ see "Exercise 4.9Z". BPSK with $R = 1$ $($and thus without coding$)$ will therefore always result in a bit error probability $p_{\rm B} > 0$.
- The bit error probabilities of such a BPSK system without coding $(R = 1)$ are indicated on the red horizontal line. To achieve $p_{\rm B} ≤ 10^{–5}$, one needs at least $10 · \lg (E_{\rm B}/N_0) = 9.6\ \rm dB$. According to the chapter "Error probability of the optimal BPSK system", these probabilities result in
- $$p_{\rm B} = {\rm Q} \left ( {\rm \sqrt{SNR}}\right ) \hspace{0.45cm} {\rm with } \hspace{0.45cm} {\rm SNR }= 2\cdot E_{\rm B}/{N_0} \hspace{0.05cm}. $$
Comparison between theory and practice
Two graphs are used to show how far established channel codes approach the BPSK channel capacity $($green curve$)$. The rate $R = k/n$ of these codes or the capacity $C$ $($if the pseudo-unit "bit/channel use" is added$)$ is plotted as the ordinate. Provided is:
- the AWGN channel, marked by $10 · \lg (E_{\rm B}/N_0)$ in dB, and
- for the realized codes marked by crosses, a "bit error rate" of $\rm BER=10^{–5}$.
Note that the channel capacity curves are always for $n → ∞$ and $\rm BER \equiv 0$.
- If one were to apply this strict requirement "error-free" also to the channel codes of finite code length $n$, $10 · \lg \ (E_{\rm B}/N_0) \to \infty$ would always be required.
- However, this is a rather academic problem, i.e. of little practical relevance. For $\text{BER} = 10^{–10}$, a qualitatively similar graph would result.
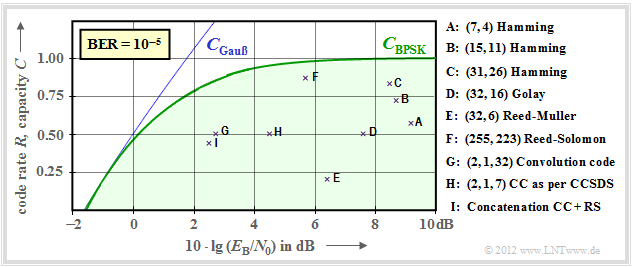
$\text{Example 4:}$ The graph shows the characteristics of early systems with channel coding and classical decoding. Some explanations of the data follow, which were taken from the lecture [Liv10][1]. The links in these explanations often refer to the $\rm LNTwww$ book "Channel Coding".
- Points $\rm A$, $\rm B$, $\rm C$ marks "Hamming codes" of rates $R = 4/7 ≈ 0.57$, $R ≈ 0.73$ and $R ≈ 0.84$, resp.
- For $\text{BER} = 10^{–5}$, these very early codes $($from the 1950s$)$ all require $10 · \lg (E_{\rm B}/N_0) > 8\ \rm dB$.
- Point $\rm D$ indicates the binary "Golay code" with rate $R = 1/2$ and point $\rm E$ a "Reed–Muller code". This very low-rate code was already used in 1971 on the "Mariner 9 space probe" .
- The "Reed–Solomon codes" from the 1960s are a class of cyclic block codes. $\rm F$ marks an RS code of rate $223/255 \approx 0.875$ and a required $E_{\rm B}/N_0 < 6 \ \rm dB$.
- $\rm G$ and $\rm H$ denote two "convolutional codes" $\rm (CC)$ of medium rate. The code $\rm G$ was already used in 1972 for the "Pioneer 10 mission".
- The channel coding of the "Voyager mission" at the end of the 1970s is marked $\rm I$ . It is the "concatenation" of a $\text{CC(2, 1, 7)}$ with a Reed-Solomon code.
It should be noted that in the convolutional codes the third parameter has a different meaning than in the block codes. For example, the identifier $\text{(2, 1, 32)}$ indicates the memory $m = 32$ .
$\text{Example 5:}$
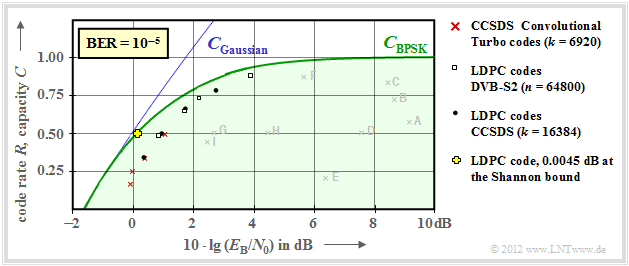
The early channel codes mentioned in $\text{Example 4}$ are still relatively far away from the channel capacity curve. This was probably also a reason why the author of this learning tutorial was unaware of the also great practical significance of information theory when he became acquainted with it in his studies in the early 1970s. The view changed significantly when very long channel codes together with iterative decoding appeared in the 1990s. The new marker points are much closer to the capacity limit curve.
Here are a few more explanations of this graph:
- Red crosses mark the so-called "turbo codes" according $\rm CCSDS$ $($"Consultative Committee for Space Data Systems"$)$ with $k = 6920$ information bits each and different code lengths $n = k/R$.
- These codes, invented by $\text{Claude Berrou}$ around 1990, can be decoded iteratively. The $($red$)$ markings are each less than $1 \ \rm dB$ away from the Shannon bound.
- The "LDPC codes" ("Low Density Parity–check Codes") with constant code length $n = 64800$ ⇒ white rectangles have been used since 2006 for "DVB–S2" ("Digital Video Broadcast over Satellite").
- They are very well suited for iterative decoding by means of "text{Factor Graph" and "Exit Charts" due to the sparse one assignment of the check matrix.
- Black dots mark the "LDPC codes" specified by $\rm CCSDS$ with constant number of information bits $(k = 16384)$ and variable word length $n = k/R$. This code class requires a similar $E_{\rm B}/N_0$ to the red crosses and white rectangles.
- Around the year 2000, many researchers had the ambition to approach the Shannon limit to within fractions of a $\rm dB$ . The yellow cross marks such a result $(0.0045 \ \rm dB)$ of [CFRU01][2] with an irregular LDPC code of rate $ R =1/2$ and length $n = 10^7$.
$\text{Conclusion:}$ At this point, the brilliance and farsightedness of $\text{Claude E. Shannon}$ should be emphasized once again:
- In 1948, he developed a theory that had not been known before, showing the possibilities, but also the limits of digital signal transmission.
- At that time, the first thoughts on digital signal transmission were only ten years old ⇒ "pulse code modulation" $\text{(Alec Reeves}$, 1938$)$ and even the pocket calculator did not arrive until more than twenty years later.
- Shannon's work shows us that great things can also be done without gigantic computers.
Channel capacity of the complex AWGN channel
Higher-level modulation methods can each be represented by an "in-phase" and a "quadrature component". These include, for example
- the $\text{M–QAM}$ ⇒ quadrature amplitude modulation; $M ≥ 4$ quadrature signal space points,
- the $\text{M–PSK}$ ⇒ $M ≥ 4$ signal space points arranged in a circle.
The two components can also be described in the "equivalent low-pass range" as the "real part" and the "imaginary part" of a complex noise term $N$, respectively.
- All the above methods are two-dimensional.
- The $($complex$)$ AWGN channel thus provides $K = 2$ independent Gaussian channels.
- According to the section "Parallel Gaussian channels", the capacity of such a channel is therefore given by:
- $$C_{\text{ Gaussian, complex} }= C_{\rm total} ( K=2) = {\rm log}_2 \hspace{0.1cm} ( 1 + \frac{P_X/2}{\sigma^2}) \hspace{0.05cm}.$$
- $P_X$ denotes the total useful power of the inphase and the quadrature components.
- In contrast, the variance $σ^2$ of the perturbation refers to only one dimension: $σ^2 = σ_{\rm I}^2 = σ_{\rm Q}^2$.
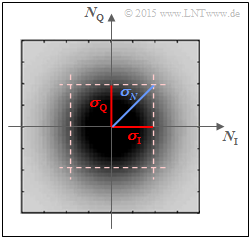
The sketch on the right shows the two-dimensional PDF $f_N(n)$ of the Gaussian noise process $N$ over the two axes:
- $N_{\rm I}$ $($inphase component, real component$)$ and
- $N_{\rm Q}$ $($quadrature component, imaginary part$)$.
Darker areas of the rotationally symmetrical PDF $f_N(n)$ around the zero point indicate more noise components. The following relationship applies to the variance of the complex Gaussian noise $N$ due to the rotational invariance $(σ_{\rm I} = σ_{\rm Q})$:
- $$\sigma_N^2 = \sigma_{\rm I}^2 + \sigma_{\rm Q}^2 = 2\cdot \sigma^2 \hspace{0.05cm}.$$
Thus, the channel capacity can also be expressed as follows:
- $$C_{\text{ Gaussian, complex} }= {\rm log}_2 \hspace{0.1cm} ( 1 + \frac{P_X}{\sigma_N^2}) = {\rm log}_2 \hspace{0.1cm} ( 1 + SNR) \hspace{0.05cm}.$$
The equation is evaluated numerically in the next section. However, we can already say that for the signal-to-noise power ratio will be:
- $$\rm SNR = {P_X}/{\sigma_N^2} \hspace{0.05cm}.$$
Maximum code rate for QAM structures
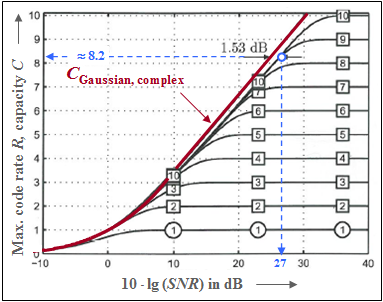
The graph shows the capacity of the complex AWGN channel as a red curve:
- $$C_{\text{ Gaussian, complex} }= {\rm log}_2 \hspace{0.1cm} ( 1 + \rm SNR) \hspace{0.05cm}.$$
- The unit of this channel capacity is "bit/channel use" or "bit/source symbol".
- The abscissa denotes the signal-to-interference power ratio $10 · \lg \rm (SNR)$ with $\rm {SNR} = P_X/σ_N^2$.
- The graph was taken from [Göb10][3]. We would like to thank our former colleague $\text{Bernhard Göbel}$ for his permission to use this figure and for his great support of our learning tutorial during his entire active time.
According to Shannon theory, the red curve is again based on a Gaussian distribution $f_X(x)$ at the input. Additionally drawn in are ten further capacitance curves for discrete-valued input:
- the curve for "Binary Phase Shift Keying" $(\rm BPSK$, marked with "1" ⇒ $K = 1)$,
- the curve for "$M$-step quadrature amplitude modulation" $($with $M = 2^K,\ K = 2$, ... , $10)$.
One can see from this representation:
- All curves $($BPSK and M–QAM$)$ lie right of the red "Shannon limit" curve.
- At low SNR, however, all curves are almost indistinguishable from the red curve.
- The final value of all curves for discrete-valued input signals is $K = \log_2 (M)$. For example, for $\rm SNR \to ∞$: $C_{\rm BPSK} = 1$ $($bit/use$)$, $C_{\rm 4-QAM} = C_{\rm QPSK} = 2$.
- The blue markings show that a $\rm 2^{10}–QAM$ with $10 · \lg \rm (SNR) ≈ 27 \ \rm dB$ allows a code rate of $R ≈ 8.2$. Distance to the Shannon curve: $1.53\ \rm dB$.
- Therefor the "shaping gain" is $10 · \lg (π \cdot {\rm e}/6) = 1.53 \ \rm dB$. This improvement can be achieved by changing the position of the $2^{10} = 32^2$ square signal space points to give a Gaussian-like input PDF ⇒ "signal shaping".
$\text{Conclusion:}$ "Exercise 4.10" discusses the AWGN capacity curves of BPSK and QPSK:
- Starting from the abscissa $10 · \lg (E_{\rm B}/N_0)$ with $E_{\rm B}$ $($energy per information bit$)$ one arrives at the QPSK curve by doubling the BPSK curve:
- $$C_{\rm QPSK}\big [10 \cdot {\rm lg} \hspace{0.1cm}(E_{\rm B}/{N_0})\big ] = 2 \cdot C_{\rm BPSK}\big [10 \cdot {\rm lg} \hspace{0.1cm}(E_{\rm B}/{N_0}) \big ] .$$
- However, if we compare BPSK and QPSK at the same energy $E_{\rm S}$ per information symbol, then:
- $$C_{\rm QPSK}[10 \cdot {\rm lg} \hspace{0.1cm}(E_{\rm S}/{N_0})] = 2 \cdot C_{\rm BPSK}[10 \cdot {\rm lg} \hspace{0.1cm}(E_{\rm S}/{N_0}) - 3\,{\rm dB}] .$$
- This takes into account that with QPSK the energy in one dimension is only $E_{\rm S}/2$ .
Exercises for the chapter
Exercise 4.8: Numerical Analysis of the AWGN Channel Capacity
Exercise 4.8Z: What does the AWGN Channel Capacity Curve say?
Exercise 4.9: Higher-Level Modulation
Exercise 4.9Z: Is Channel Capacity C ≡ 1 possible with BPSK?
Exercise 4.10: QPSK Channel Capacity
References
- ↑ Liva, G.: Channel Coding. Lecture manuscript, Chair of Communications Engineering, TU München and DLR Oberpfaffenhofen, 2010.
- ↑
Chung S.Y; Forney Jr., G.D.; Richardson, T.J.; Urbanke, R.: On the Design of Low-Density Parity- Check Codes within 0.0045 dB of the Shannon Limit. –
In: IEEE Communications Letters, vol. 5, no. 2 (2001), pp. 58–60. - ↑ Göbel, B.: Information–Theoretic Aspects of Fiber–Optic Communication Channels. Dissertation. TU München.
Verlag Dr. Hut, Reihe Informationstechnik, ISBN 978-3-86853-713-0, 2010.

