Contents
- 1 Motivation for describing in the equivalent low-pass range
- 2 Definition in the frequency domain
- 3 Description in the time domain
- 4 Definition of the "Locality Curve"
- 5 Representing with magnitude and phase
- 6 Relation between equivalent low-pass signal and band-pass signal
- 7 Why multiple representations of the same signal exist
- 8 Representation according to real and imaginary part
- 9 Determination of the equivalent low-pass signal from the band-pass signal
- 10 Power and energy of a band-pass signal
- 11 Exercises for the chapter
Motivation for describing in the equivalent low-pass range
The following figure shows a possible structure of a transmission system:
- Often the low-frequency source signal $q(t)$ is converted into a band-pass signal $s(t)$ ⇒ »modulation«.
- After transmission, the received signal $r(t)$ – compared to the transmitted signal $s(t)$ possibly distorted and with interference $($noise$)$ applied – must be reset to the original frequency range ⇒ »demodulation«.
- The sink signal $v(t)$, which should match the source signal $q(t)$ as closely as possible, is then again a low-pass signal.
Modulation and demodulation are therefore fundamental components of a transmission system, which are dealt in detail in the book »Modulation Methods«. A short summary can be found in the first chapter »Principles of Communication« of this book.
The investigation, simulation, optimization, and dimensioning of band-pass systems are mostly done in the »equivalent low-pass range}«, for which the following reasons can be given:
- If quality characteristics $($bandwidth efficiency, signal-to-noise ratio, bit error rate, etc.$)$ of a low-pass system are known, the corresponding values of related band-pass systems can be derived from them relatively easily. Examples are the digital modulation methods »Amplitude Shift Keying« $\text{(ASK)}$ and »Binary Phase Shift Keying« $\text{(BPSK)}$, whose performance variables can be "extrapolated" from the comparable »baseband system» $($i.e., without modulator and demodulator$)$.
- Individual subchannels in a so-called »Frequency Division Multiplex« system, which differ by different carrier frequencies, can often be considered qualitatively equivalent. Therefore, it is sufficient to limit the calculation and dimensioning to a single channel and to perform these investigations in the equivalent low-pass range – i.e. without considering the specific carrier frequency.
- It is often the case that the bandwidth of a communication connection is orders of magnitude smaller than the carrier frequency. For example, in the »GSM standard« the individual channels are located in the frequency range around $900\ \rm MHz$ $($»D-Network«$)$ and $1800\ \rm MHz$ $($»E-Network«$)$, while each channel has only a small bandwidth of $200\ \rm kHz$. Therefore a simulation in the equivalent low-pass range is much less complex than a simulation of the corresponding band-pass signals.
Definition in the frequency domain
We consider a real band-pass signal $x(t)$ with the spectrum $X(f)$. Furthermore, the following shall apply:
- The band-pass signal $x(t)$ is said to result from the modulation of a low-frequency source signal $q(t)$ with the carrier signal $z(t)$ of frequency $f_{\rm T}$. The type of modulation $($whether analog or digital, amplitude or angle modulation, single-sideband or double-sideband$)$ is not specified.
- The spectral function $X_+(f)$ of the corresponding analytical signal $x_+(t)$ exists only for positive frequencies and is twice as large as $X(f)$. For the derivation of $X_+(f)$ the carrier frequency $f_{\rm T}$ $($German: "Trägerfrequenz" ⇒ "$\rm T$"$)$ of the system does not need to be known.
$\text{Definition:}$ If the spectrum of the analytical signal $x_+(t)$ is shifted to the left by $f_{\rm T}$, the result is called the »equivalent low-pass spectrum«:
- $$X_{\rm TP}(f) = X_{\rm +}(f + f_{\rm T}).$$
Note:
- The identifier "$\rm TP$" stands for "low-pass" $($German: "Tiefpass"$)$ and the identifier "$\rm T$" stands for "carrier" $($German: Träger$)$.
- In general: $X(f)$, $X_+(f)$ and $X_{\rm TP}(f)$ are complex-valued.
- However, if $X(f)$ is real, then the spectral functions $X_+(f)$ and $X_{\rm TP}(f)$ are real too, because they result from $X(f)$ only with the linear operations »truncate«, »double«, and »frequency shift«.
- In contrast to $X_+(f)$, for the calculation of the equivalent low-pass spectrum $X_{\rm TP}(f)$ the knowledge of the carrier frequency $f_{\rm T}$ is absolutely necessary. For other values of $f_{\rm T}$ other low-pass spectra will result.
If one transforms the above equation into the time domain, one obtains after applying the »Shifting Theorem«:
- $$x_{\rm TP}(t) = x_{\rm +}(t)\cdot {\rm e}^{-{\rm j} \hspace{0.05cm}\cdot \hspace{0.05cm}2 \pi \cdot f_{\rm T}\cdot \hspace{0.05cm}t}.$$
The relation $x(t) = \text{Re}\big[x_+(t)\big]$ yields the procedure to determine the actual physical band-pass signal from the equivalent low-pass signal:
- $$x(t) = {\rm Re}\big [x_{\rm +}(t)\big] = {\rm Re}\big[x_{\rm TP}(t)\cdot {\rm e}^{\hspace{0.05cm}{\rm j} \hspace{0.05cm} \cdot 2\pi \hspace{0.05cm}\cdot\hspace{0.05cm} f_{\rm T}\hspace{0.05cm} \cdot \hspace{0.05cm} \hspace{0.05cm}t}\big].$$
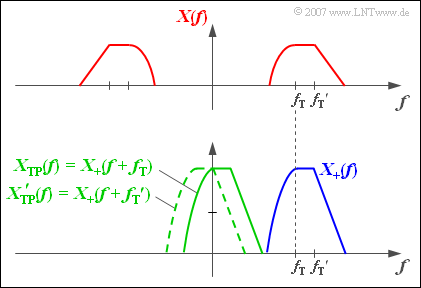
$\text{Example 1:}$ The upper figure shows the real spectral function $X(f)$ of a band-pass signal $x(t)$ which is the result of modulating a low-frequency signal $q(t)$ with the carrier frequency $f_{\rm T}$.
Below the two likewise real spectral functions $X_+(f)$ and $X_{\rm TP}(f)$ are shown:
- Due to the asymmetries concerning the frequency origin $(f = 0)$ the corresponding time functions are complex.
- The solid-green spectral function $X_{\rm TP}(f)$ is shifted to the left with respect to $X_{+}(f)$ by the carrier frequency $f_{\rm T}$.
- If $X(f)$ is the modulation result of another source signal $q\hspace{0.05cm}'(t)$ with a different carrier frequency ${f_{\rm T} }\hspace{0.05cm}'$, this would result in another equivalent low-pass spectrum ${X\hspace{0.05cm}'_{\rm TP} }(f)$.
- An exemplary function ${X\hspace{0.05cm}'_{\rm TP} }(f)$ is drawn in the graphic with green-dashed lines.
Description in the time domain
To simplify the presentation we now assume a line spectrum so that the analytical signal can be represented as »pointer group« ⇒ sum of complex rotating pointers:
- $$X_{+}(f) = \sum_{i=1}^{I} {A_i} \cdot {\rm e}^{-{\rm j}\hspace{0.05cm}\cdot \hspace{0.05cm} \varphi_i}\cdot\delta (f - f_i) \hspace{0.3cm}\bullet\!\!-\!\!\!-\!\!\!-\!\!\circ\, \hspace{0.3cm} x_{+}(t) = \sum_{i=1}^{I} A_i \cdot {\rm e}^{{\rm j}\hspace{0.05cm}\cdot \hspace{0.05cm}( 2 \pi \hspace{0.05cm}\cdot \hspace{0.05cm}f_i\hspace{0.05cm}\cdot \hspace{0.05cm} t \hspace{0.05cm}-\hspace{0.05cm} \varphi_i)}.$$
- By shifting the frequency by $f_{\rm T}$ to the left, the equivalent low-pass signal in frequency and time domain is:
- $$X_{\rm TP}(f) = \sum_{i=1}^{I} {A_i} \cdot {\rm e}^{-{\rm j}\hspace{0.05cm}\cdot \hspace{0.05cm} \varphi_i}\cdot\delta (f - \nu_i)\hspace{0.3cm}\bullet\!\!-\!\!\!-\!\!\!-\!\!\circ\, \hspace{0.3cm} x_{\rm TP}(t) = \sum_{i=1}^{I} A_i \cdot {\rm e}^{{\rm j}\hspace{0.05cm}\cdot \hspace{0.05cm}( 2 \pi \hspace{0.05cm}\cdot \hspace{0.05cm} \nu_i \hspace{0.05cm}\cdot \hspace{0.05cm} t \hspace{0.05cm}-\hspace{0.05cm} \varphi_i)}.$$
- The following relation is valid between the frequency values $f_i$ and $\nu_i$ $(i = 1, \ \text{...} \ , I)$:
- $$\nu_i = f_i - f_{\rm T} .$$
- These equations can be interpreted as follows:
- At time $t = 0$ the equivalent low-pass signal is identical to the analytical signal: $x_{\rm TP}(t = 0) = x_{\rm +}(t = 0)= \sum_{i=1}^{I} A_i \cdot {\rm e}^{{-\rm j}\hspace{0.05cm}\cdot \hspace{0.05cm} \varphi_i}.$
- At this time, the "pointer group" is defined by the $I$ amplitude parameter $A_i$ and the $I$ phase positions $\varphi_i$ alone.
- All pointers of the analytical signal $x_+(t)$ rotate for $t > 0$ corresponding to the $($always positive$)$ frequencies $f_i$ counterclockwise.
- For the equivalent low-pass signal, the rotation speeds are lower.
- Pointers with $\nu_i > 0$ turn in mathematically positive direction $($counterclockwise$)$, those with $\nu_i < 0$ in opposite direction $($clockwise$)$.
- If the frequency parameter for a pointer is $\nu_i = 0$, this pointer rests in the complex plane corresponding to its initial position.
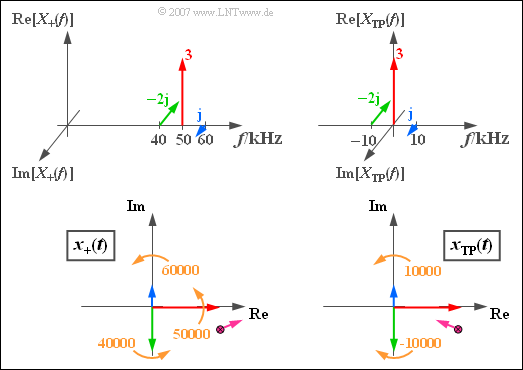
$\text{Example 2:}$ We consider a spectrum $X_+(f)$ consisting of three spectral lines at $40\,\text{kHz}$, $50\,\text{kHz}$ and $60\,\text{kHz}$. With the amplitude and phase parameters recognizable from the graph you obtain the analytical signal $x_+(t)$ corresponding to the lower left sketch.
The snapshot of the lower left graph ⇒ »analytical signal« $x_+(t)$ applies to the time $t = 0$. All pointers then turn counterclockwise at a constant circular velocity.
- The blue pointer rotates with $60000$ rotations per second $($it is the fastest pointer$)$. The green pointer is the slowest; it rotates with the circular frequency $\omega_{40} = 2\pi \cdot 40000 \hspace{0.1cm} 1/\text{s}$.
- The violet sum point of all three pointers moves for $t > 0$ in the complex plane in a complicated manner, for the above numerical values first roughly in the drawn direction.
⇒ The graphics on the right describe the »equivalent low-pass signal« in the frequency domain $($top$)$ and in the time domain $($bottom$)$, valid for the carrier frequency $f_{\rm T} = 50\,\text{kHz}$.
- The carrier is now at $f = 0$; the corresponding red pointer does not move.
- The blue pointer $($"upper sideband"$)$ rotates counterclockwise with $\omega_{10} = 2\pi \cdot 10000 \hspace{0.1cm}1/\text{s}$.
- The green pointer $($"lower sideband"$)$ rotates clockwise at the same angular velocity ($-\omega_{10}$).
Definition of the "Locality Curve"
$\text{Definition:}$ As »locality curve« we call the curve on which the »equivalent low-pass signal« $x_{\rm TP}(t)$ moves in the complex plane.
Notes: In other technical literature the term "locality curve" is rarely used. Therefore, initially, an example is given.
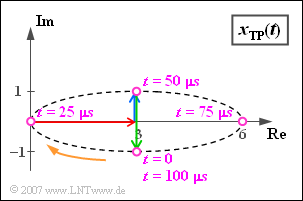
$\text{Example 3:}$ We consider the equivalent low-pass signal $x_{\rm TP}(t)$ of $\text{Example 2}$, consisting of
- the resting $($red$)$ pointer of length $3$,
- the $($blue$)$ pointer rotating with $\omega_{10} = 2\pi \cdot 10000 \hspace{0.1cm} 1/\text{s}$ in mathematical positive direction, complex value $\rm j$,
- the $($green) pointer of length $2$, which is currently $(t = 0)$ in the direction of the negative imaginary axis;
this rotates with the same circular velocity $\omega_{10}$ as the blue pointer, but in the opposite direction ($-\omega_{10}$).
The blue and the green pointer each require exactly one period duration $T_0 = 100 \,{\rm µ}\text{s}$ for one rotation. The further course of the process can be seen in the above illustration:
- The violet pointer sum at time $t = 0$ is equal to $x_{\rm TP}(t=0) = 3 - \text{j}$.
- After $t = T_0/4 = 25 \,{\rm µ}\text{s}$ the resulting pointer group has the value $0$, since now the two rotating pointers lie in the opposite direction to the carrier and compensate it exactly.
- After one period $(t = T_0 = 100 \,{\rm µ}\text{s})$ the initial state is reached again: $x_{\rm TP}(t = T_0) = x_{\rm TP}(t=0) = 3 - \text{j}$.
In this example the »locality curve« is an ellipse, which is traversed by the equivalent low-pass signal once per period.
- The representation applies to the »Double Sideband Amplitude Modulation with carrier« of a sinusoidal $10\ \rm kHz$ signal with a cosinusoidal carrier of any frequency, where the upper sideband $($blue pointer$)$ is attenuated.
- If the lengths of the blue and the green rotating pointer were equal, the locality curve would be a horizontal one on the real axis – see $\text{Exercise 4.5}$.
- In the chapter »Envelope Demodulation« the locality curves of different system variants are treated in detail.
Representing with magnitude and phase
The equivalent low-pass signal of the band-pass signal $x(t)$ is generally complex and can therefore be expressed in the form
- $$x_{\rm TP}(t) = a(t) \cdot {\rm e}^{{\rm j}\hspace{0.05cm}\cdot \hspace{0.05cm} \phi(t)}.$$
Note the plus sign in the argument of the exponential function, which differs from the »complex Fourier series«. This is because the equation with the positive sign for the phase is usually used to describe the modulation method for the physical signal as well:
- $$x(t) = a(t) \cdot {\cos} ( 2 \pi f_{\rm T} t + \phi(t)).$$
- In many textbooks this equation is used with plus or minus signs depending on the application, but always with the same "phase identifier".
- By using two different symbols $(\varphi$ and $\phi)$ we try to avoid this ambiguity in our e–learning tool.
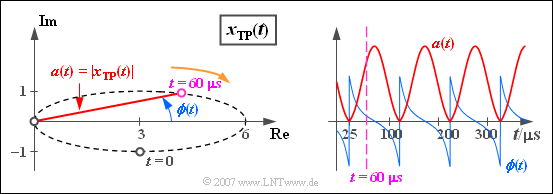
$\text{Example 4:}$ The same prerequisites apply as in $\text{Example 2}$ and in $\text{Example 3}$. However, instead of the complex function $x_{\rm TP}(t)$ the two real functions $a(t)$ and $\phi(t)$ are now displayed in the graph. It should be noted with regard to this representation:
- The »magnitude function« shows the time-dependent pointer length:
- $$a(t)= \vert x_{\rm TP}(t)\vert =\sqrt{ {\rm Re}\left[x_{\rm TP}(t)\right]^2 + {\rm Im}\left[x_{\rm TP}(t)\right]^2 }.$$
- In this example the magnitude function $a(t)$ is like the complex equivalent low-pass signal $x_{\rm TP}(t)$ periodic with $T_0$ and takes values between $0$ and $6$.
- The »phase function« describes the time-dependent angle of the equivalent low-pass signal $x_{\rm TP}(t)$, related to the coordinate origin:
- $$\phi(t)= {\rm arc} \left[x_{\rm TP}(t)\right]= {\rm arctan} \hspace{0.1cm}\frac{ {\rm Im}\left[x_{\rm TP}(t)\right]}{ {\rm Re}\left[x_{\rm TP}(t)\right]}.$$
Here are some numerical results for the phase values:
- The phase at start time is $\phi (t = 0) =\hspace{0.1cm} -\arctan (1/3) ≈ \hspace{0.1cm} -18.43^{\circ} = \hspace{0.1cm}-0.32\,\text{rad}$.
- At $t = 25\,{\rm µ}\text{s}$ it holds $x_{\rm TP}(t ) = 0$, so that at this time the phase function $\phi(t)$ changes abruptly from $-\pi /2$ to $+\pi /2$ .
- The same result is obtained for all equidistant times at distance $T_0 = 100 \,{\rm µ}\text{s}$.
- At time $t = 60\,{\rm µ}\text{s}$ the phase function has a slightly positive value.
Relation between equivalent low-pass signal and band-pass signal
A band-pass signal $x(t)$ resulting from the modulation of a low-frequency source signal $q(t)$ with a carrier signal $z(t)$ of frequency $f_{\rm T}$ can be represented as follows:
- $$x(t) = a(t) \cdot {\cos} ( 2 \pi f_{\rm T} t + \phi(t)) \hspace{0.3cm}\Rightarrow\hspace{0.3cm} x_{\rm TP}(t) = a(t) \cdot {\rm e}^{{\rm j}\hspace{0.05cm}\cdot \hspace{0.05cm} \phi(t)}.$$
It should be noted here:
- $a(t)$ is the time-dependent amplitude ⇒ »magnitude function« or »envelope curve«. This is equal to the magnitude $|x_{\rm TP}(t)|$ of the equivalent low-pass signal.
- $\phi(t)$ is the »phase function«, i.e. the time-dependent phase, which can also be determined from $x_{\rm TP}(t)$ as angle to the coordinate origin of the complex plane.
- In the physical $($band-pass$)$ signal $x(t)$, the phase function $\phi(t)$ can be recognized by the »zero crossings«.
- With $\phi(t) > 0$ the zero crossing occurs in $x(t)$ $t$ earlier than in the carrier signal $z(t)$. In contrast, $\phi(t) < 0$ means a shift of the zero crossing to a later time.
$\text{Definitions:}$
- One speaks of »Amplitude Modulation« if all information about the source signal $q(t)$ is contained in the magnitude function $a(t)$ while $\phi(t)$ is constant.
- Conversely, with »Phase Modulation« the phase function $\phi(t)$ contains all information about the source signal $q(t)$, while $a(t)$ is constant.
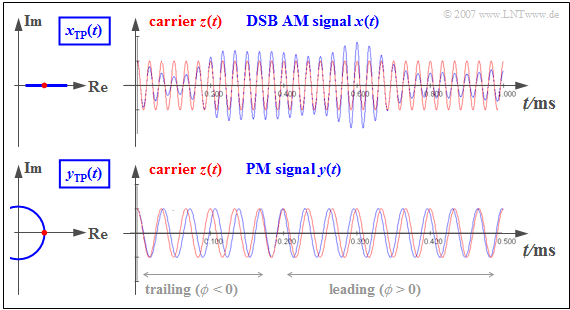
$\text{Example 5:}$ The upper part of the following figure describes the »Double-Sideband Amplitude Modulation $\text{(DSB-AM)}$ with carrier«:
- The equivalent low-pass signal $x_{\rm TP}(t)$ is always real
⇒ the locality curve is a horizontal straight line.
- Therefore the zero crossings of the blue DSB-AM signal $x(t)$ correspond exactly to those of the red carrier signal $z(t)$.
- This means: The phase function $\phi(t)$ is identical to zero ⇒ the magnitude function $a(t)$ contains all information about $q(t)$.
The lower part of the graphic applies to the »Phase Modulation« $\text{(PM)}$:
- The PM signal $y(t)$ always has a constant envelope $($magnitude function$)$ ⇒ the locality curve is a circle.
- At $t \approx 0$ it holds $\phi (t) < 0$ ⇒ the zero crossings in $y(t)$ occur later than those in $z(t)$ ⇒ here, the zero crossings are »trailers«.
- For $\phi (t) > 0$ ⇒ the zero crossings in $y(t)$ occur earlier than those in $z(t)$ ⇒ here, the zero crossings are »precursors«.
- Therefore, with phase modulation, all information about the source signal $q(t)$ is contained in the positions of the zero crossings.
Why multiple representations of the same signal exist
Finally, and hopefully not too late, we want to turn to the question why the two complex and less comprehensible signals $x_+(t)$ and $x_{\rm TP}(t)$ are necessary to describe the actual band-pass signal $x(t)$. They were not introduced in Communications Engineering in order to unsettle students, but:
$\text{Conclusions:}$
- The magnitude function $a(t)$ and the phase function $\phi (t)$ can be extracted directly and easily from the physical band-pass signal $x(t)$ only in some special cases.
- The real non existing equivalent low-pass signal $x_{\rm TP}(t)$ is a mathematical tool to determine the functions $a(t)$ and $\phi (t)$ by simple geometrical considerations.
- The analytical signal $x_+(t)$ is an intermediate step in the transition from $x(t)$ to $x_{\rm TP}(t)$. While $x_+(t)$ is always complex, $x_{\rm TP}(t)$ can be real in special cases, for example, with ideal amplitude modulation according to the chapter »Double-Sideband Amplitude Modulation« $\text{(DSB-AM)}$.
$\text{The same principle applies as often used in the natural sciences and technologies:}$
- The introduction of $x_+(t)$ and $x_{\rm TP}(t)$ brings rather a complication for simple problems.
- The advantages of this approach can only be seen in more difficult problems, which could not be solved with the signal $x(t)$ alone or only with much more effort.
For further clarification we provide two interactive applets:
- »Physical and Analytical Signal« ⇒ "Pointer Diagram",
- »Physical and Equivalent Low-Pass Signal« ⇒ "Locality Curve".
Representation according to real and imaginary part
Especially for the description of »Quadrature Amplitude Modulation« $\text{(QAM)}$, the representation of the equivalent low-pass signal according to real and imaginary part is suitable:
- $$x_{\rm TP}(t) = x_{\rm I}(t)+ {\rm j} \cdot x_{\rm Q}(t).$$
In this representation,
- the real part $x_{\rm I}(t)$ describes the »in-phase component« $($"normal component"$)$ of $x_{\rm TP}(t)$,
- whereas the imaginary part $x_{\rm Q}(t)$ describes the »quadrature component«.
With the magnitude function function $a(t) = |x_{\rm TP}(t)|$ and the phase function $\phi (t) = \text{arc}\,x_{\rm TP}(t)$ according to the definitions in the previous sections:
- $$\begin{align*}x_{\rm I}(t) & = {\rm Re}[x_{\rm TP}(t)] = a(t) \cdot \cos (\phi(t)),\\ x_{\rm Q}(t) & = {\rm Im}[x_{\rm TP}(t)] = a(t) \cdot \sin (\phi(t)).\end{align*}$$
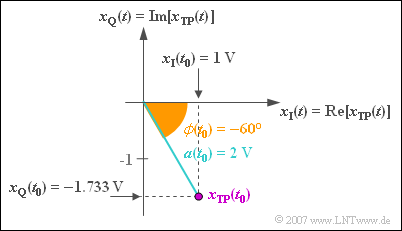
$\text{Example 6:}$ At the considered time $t_0$ applies to the equivalent low-pass signal:
- $$x_{\rm TP}(t = t_0) = 2\,{\rm V} \cdot {\rm e}^{- {\rm j \hspace{0.05cm}\cdot \hspace{0.05cm} 60 ^\circ} }.$$
- With »Euler's Theorem«, this can be written:
- $$x_{\rm TP}(t = t_0) = 2\,{\rm V} \cdot \cos(60 ^\circ) - {\rm j} \cdot 2\,{\rm V} \cdot \sin(60 ^\circ).$$
- This applies to the "in-phase" and "quadrature component":
- $$x_{\rm I}(t = t_0) = 2\,{\rm V} \cdot \cos(60 ^\circ) = 1\text{V}, $$
- $$x_{\rm Q}(t = t_0) = \hspace{0.05cm} - {\rm j} \cdot 2\,{\rm V} \cdot \sin(60^\circ) =\hspace{0.05cm}-1.733\text{V}.$$
By applying trigonometric transformations it can be shown that the real $($physical$)$ band-pass signal can also be represented in the following way:
- $$x(t) = a(t) \cdot \cos (2 \pi \cdot f_{\rm T} \cdot t + \phi(t)) = x_{\rm I}(t)\cdot \cos (2 \pi \cdot f_{\rm T} \cdot t )-x_{\rm Q}(t)\cdot \sin (2 \pi \cdot f_{\rm T} \cdot t ). $$
- The minus sign results from the use of the phase function $\phi (t)$. A comparison with the section »Representation with cosine and sine components« in the second main chapter shows that instead of the difference, the sum results when referring to $\varphi (t) = -\phi (t)$. Adapted to our example, you then get
- $$x(t) = a(t) \cdot \cos (2 \pi \cdot f_{\rm T} \cdot t - \varphi(t)) = x_{\rm I}(t)\cdot \cos (2 \pi \cdot f_{\rm T} \cdot t )+x_{\rm Q}(t)\cdot \sin (2 \pi \cdot f_{\rm T} \cdot t ).$$
- The quadrature component $x_{\rm Q}(t)$ thus differs from the above equation in the sign.
Determination of the equivalent low-pass signal from the band-pass signal
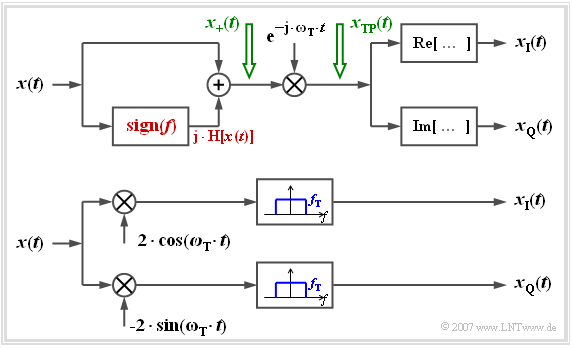
The figure shows two arrangements to determine the complex low-pass signal split into inphase and quadrature components from the real band-pass signal $x(t)$, for example for display on an oscilloscope. Let us first look at the upper model:
- The analytical signal $x_+(t)$ is first generated here by adding the »Hilbert Transform«.
- Multiplication with the complex exponential function $($with negative exponent!$)$ yields the equivalent low-pass signal $x_{\rm TP}(t)$.
- The sought components $x_{\rm I}(t)$ and $x_{\rm Q}(t)$ are then obtained by forming the real and the imaginary part.
⇒ With the lower $($more practical$)$ arrangement, you get for the upper and the lower branch after the respective multiplications:
$$a(t)\cdot \cos (\omega_{\rm T} t + \phi(t)) \cdot 2 \cdot \cos (\omega_{\rm T} t ) = a(t)\cdot \cos ( \phi(t)) + \varepsilon_{\rm 1}(t),$$ $$a(t)\cdot \cos (\omega_{\rm T} t + \phi(t)) \cdot (-2) \cdot \sin (\omega_{\rm T} t ) = a(t)\cdot \sin ( \phi(t)) + \varepsilon_{\rm 2}(t)).$$
⇒ The respective second parts are in the range around twice the carrier frequency and are removed by low-pass filters with cut-off frequency $f_{\rm T}$ :
- $$\varepsilon_{\rm 1}(t) = a(t)\cdot \cos (2\omega_{\rm T} \cdot t + \phi(t)),$$
- $$\varepsilon_{\rm 2}(t) = - a(t)\cdot \sin (2\omega_{\rm T} \cdot t + \phi(t)).$$
⇒ A comparison with the above equations shows that the desired components $x_{\rm I}(t)$ and $x_{\rm Q}(t)$ can be tapped at the output:
- $$x_{\rm I}(t) = a(t)\cdot \cos ( \phi(t)) ,$$
- $$x_{\rm Q}(t) = a(t)\cdot \sin ( \phi(t)) .$$
Power and energy of a band-pass signal
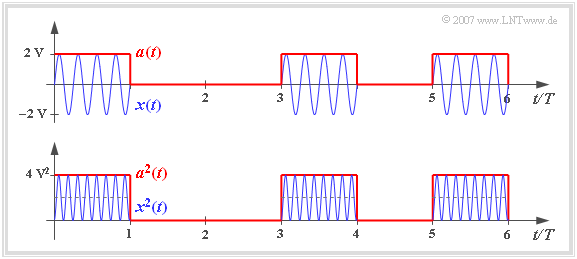
We look at the $($blue$)$ band-pass signal $x(t)$ according to the graph, which results e.g. from »Binary Amplitude Shift Keying« $\text{(2ASK)}$. This digital modulation method is also known as »On-Off keying«.
- The signal power related to $1 \,\Omega$ is given by the explanations in section »Energy–limited and power–limited signals« as
- $$P_x = \lim_{T_{\rm M} \to \infty} \frac{1}{T_{\rm M}} \cdot \int^{+T_{\rm M}/2} _{-T_{\rm M}/2}\hspace{-0.1cm} x^2(t)\,{\rm d}t.$$
- If the binary "zeros" and "ones" are equally probable, then the infinite integration range and the boundary crossing can be omitted, and you get for the above sketched pattern signal:
- $$P_x = \frac{1}{2T} \cdot \int ^{2T} _{0} x^2(t)\,{\rm d}t = \frac{4\,{\rm V}^2}{2T} \cdot \int^{T} _{0} \cos^2(\omega_{\rm T} \cdot t)\,{\rm d}t= 1\,{\rm V}^2.$$
- From the sketch below you can see that by averaging over the squared envelope $a^2(t)$ – i.e. over the »magnitude square of the equivalent low-pass signal« $x_{\rm TP}(t)$ – you get a result twice as large.
- Therefore the same holds here likewise:
- $$P_x = { {1}/{2} \hspace{0.08cm}\cdot }\lim_{T_{\rm M} \to \infty} \frac{1}{T_{\rm M}} \cdot \int^{T_{\rm M}/2} _{-T_{\rm M}/2} |x_{\rm TP}(t)|^2\,{\rm d}t = {{1}/{2} \hspace{0.08cm}\cdot }\lim_{T_{\rm M} \to \infty} \frac{1}{T_{\rm M}} \cdot \int^{T_{\rm M}/2} _{-T_{\rm M}/2} a^2(t)\,{\rm d}t.$$
- This result can be generalized and applied to energy limited signals. In this case, the energy according to section »Energy–limited and power–limited signals«:
- $$E_x = \int ^{+\infty} _{-\infty} x^2(t)\,{\rm d}t = { {1}/{2} \hspace{0.08cm}\cdot }\int ^{+\infty} _{-\infty} |x_{\rm TP}(t)|^2\,{\rm d}t = { {1}/{2} \hspace{0.08cm}\cdot }\int ^{+\infty} _{-\infty} a^2(t)\,{\rm d}t.$$
However, this equation only applies exactly if the carrier frequency $f_{\rm T}$ is much larger than the bandwidth $B_{\rm BP}$ of the band-pass.
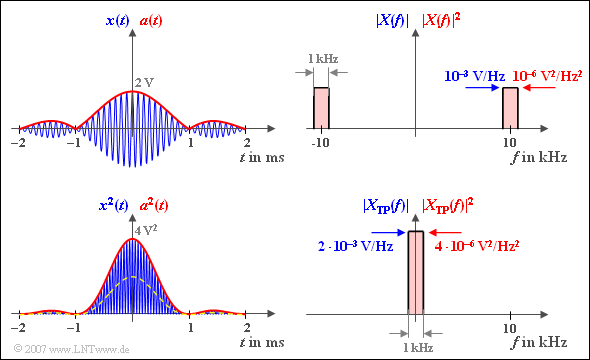
$\text{Example 7:}$ We look at the band-pass signal $x(t)$ with $A = 2\,\text{V}$, $B = 1\,\text{kHz}$ and $f_{\rm T} = 10\,\text{kHz}$:
- $$x(t) = A \cdot {\rm sinc}(B \cdot t) \cdot \cos(2 \pi \cdot f_{\rm T}\cdot \hspace{0.05cm}t + \phi(t)).$$
The magnitude spectrum $\vert X(f) \vert$ belonging to the signal $x(t)$ is displayed in the upper right corner. The blue label applies:
- $X(f)$ is purely real due to the symmetry relations:
- $$\vert X(f) \vert = X(f).$$
- $\vert X(f) \vert$ is thus composed of two rectangles around $\pm f_{\rm T}$ . In the range around the carrier frequency applies:
- $$\vert X(f) \vert = A/(2B) = 10^{-3}\text{V/Hz}.$$
⇒ The energy of this band-pass signal could in principle be calculated by the following equation:
$$E_x = \int^{+\infty} _{-\infty} A^2 \cdot \frac{ {\rm sin}^2(\pi \cdot B \cdot t)}{ (\pi \cdot B \cdot t)^2}\cdot \cos^2(2 \pi \cdot f_{\rm T}\cdot \hspace{0.05cm}t + \phi(t))\,{\rm d}t .$$ According to the above equations, however, with the envelope curve $a(t)$ drawn in red at the top left also applies:
$$E_x = { {1}/{2} \hspace{0.08cm}\cdot }\int^{+\infty} _{-\infty} a^2(t)\,{\rm d}t= { {1}/{2} \hspace{0.08cm}\cdot }\int^{+\infty} _{-\infty} \vert A \cdot {\rm sinc}(B \cdot t)\vert^2\,{\rm d}t $$
- $$\Rightarrow \hspace{0.3cm} E_x = A^2\cdot \int^{+\infty} _{0} {\rm sinc}^2(B \cdot t)\,{\rm d}t =A^2\cdot \frac {\pi}{2}\cdot \frac {1}{\pi B} = \frac {A^2}{2 B}= 2 \cdot 10^{-3}\,{\rm V}^2/{\rm Hz}.$$
⇒ A second solution with the same result is offered by »Parseval's theorem«:
- $$\int ^{+\infty} _{-\infty} a^2(t)\,{\rm d}t= \int ^{+\infty} _{-\infty} \vert A(f) \vert ^2\,{\rm d}f \hspace{0.3cm} \Rightarrow \hspace{0.3cm} E_x = {1}/{2}\cdot ( {A}/{B})^2 \cdot B = {A^2}/(2 B).$$
This is taken into account:
- The following applies $\vert A(f) \vert = \vert X_{\rm TP}(f) \vert $.
- Inside the bandwidth $B$ around the frequency $f = 0$ ⇒ $X_{\rm TP}(f)$ is twice as large as $X(f)$ around the frequency $f = f_{\rm T}$, namely $A/B$.
- This is related to the definition of the spectrum $X_+(f)$ of the analytical signal from which $X_{\rm TP}(f)$ is created by shifting.
Exercises for the chapter
Exercise 4.5: Locality Curve for DSB-AM
Exercise 4.5Z: Simple Phase Modulator
Exercise 4.6: Locality Curve for SSB-AM
Exercise 4.6Z: Locality Curve for Phase Modulation

