Difference between revisions of "Modulation Methods/Error Probability of Direct-Sequence Spread Spectrum Modulation"
| (65 intermediate revisions by 7 users not shown) | |||
| Line 1: | Line 1: | ||
{{Header | {{Header | ||
| − | |Untermenü= | + | |Untermenü=Multiple Access Methods |
| − | |Vorherige Seite= | + | |Vorherige Seite=Spreading Sequences for CDMA |
| − | |Nächste Seite= | + | |Nächste Seite=General Description of OFDM |
}} | }} | ||
| − | == | + | ==The IS-95 CDMA system== |
| − | + | <br> | |
| + | The properties of PN modulation are now given using the example of the American mobile radio standard [https://en.wikipedia.org/wiki/CdmaOne $\text{IS–95}$], which has resulted from the work of [https://en.wikipedia.org/wiki/Qualcomm $\text{Qualcomm Inc.}$] and in particular of [https://en.wikipedia.org/wiki/Andrew_Viterbi $\text{Andrew J. Viterbi}$]. In a somewhat simplified representation – without convolutional encoder, interleaver and de-interleaver as well as the Viterbi decoder at the receiver - the following block diagram results. The following statements are valid: | ||
| + | [[File:EN_Mod_T_5_4_S1_v2.png |right|frame| Considered block diagram for this chapter]] | ||
| − | [[ | + | *The spreading signal $c(t)$ causes "band spreading" by the spreading factor $J$, with [[Modulation_Methods/Spreading_Sequences_for_CDMA#Walsh_functions|$\text{Walsh functions}$]] or [[Modulation_Methods/Spreading_Sequences_for_CDMA#Pseudo-noise_sequences_of_maximum_length|$\text{M–Sequences}$]]. |
| + | *"Band compression" at the receiver uses the same spreading sequence in a phase-synchronous manner. | ||
| − | + | *The additional $±1$ signal $w(t)$ provides additional "scrambling", but does not cause further band spreading. | |
| − | * | ||
| − | |||
| − | |||
| − | |||
| − | |||
| + | *The rectangular duration of $w(t)$ is exactly as large $(T_c)$ as the rectangular duration of $c(t)$. $T_c$ is called the "chip duration". | ||
| − | + | *Without band spreading and scrambling $($or with $J = 1)$, the transmission chain corresponds to [[Modulation_Methods/Lineare_digitale_Modulation#BPSK_.E2.80.93_Binary_Phase_Shift_Keying|$\text{BPSK modulation}$]]. | |
| − | + | *The matched filter is implemented by the [[Digital_Signal_Transmission/Error_Probability_for_Baseband_Transmission#Optimal_binary_receiver_.E2.80.93_.22Integrate_.26_Dump.22_realization|$\text{Integrate & Dump}$]] variant, so it is an optimal system. | |
| − | + | *With $H_{\rm K}(f) = 1$, the [[Modulation_Methods/Quality_Criteria#Some_remarks_on_the_AWGN_channel_model|$\text{AWGN channel model}$]] is obtained with the Gaussian distributed noise signal $n(t)$ and the AWGN parameter $E_{\rm B}/N_0$. | |
| − | + | *The additional interference component $i(t)$ summarizes the "interferences from other users". | |
| − | |||
| − | |||
| − | + | *In the case of a [[Examples_of_Communication_Systems/General_Description_of_UMTS#Properties_of_the_UMTS_radio_channel|$\text{multipath channel}$]] (one main path and one or more secondary paths), the resulting intersymbol interference can be reduced by using a [[Modulation_Methods/Error_Probability_of_Direct-Sequence_Spread_Spectrum_Modulation#Examinations_of_the_rake_receiver|$\text{rake receiver}$]]. | |
| − | [[File: | + | ==System configurations for minimum error probability== |
| + | <br> | ||
| + | [[File:EN_Mod_T_5_4_S2.png|right|frame| Bit error probability curves for the AWGN channel]] | ||
| + | The diagram shows the bit error probability at BPSK as a function of the logarithmized AWGN parameter $E_{\rm B}/N_0$ (signal energy per bit related to the noise power density) as a solid blue curve. With the [[Applets:Complementary_Gaussian_Error_Functions|$\text{complementary Gaussian error function}$]] ${\rm Q}(x)$: | ||
| + | :$$p_{\rm B} = {\rm Q} \left ( \sqrt{{2\cdot E_{\rm B}}/{N_{\rm 0}}}\hspace{0.05cm}\right ) \hspace{0.05cm}.$$ | ||
| + | For example, with $10 · \lg \ (E_{\rm B}/N_0) = 8 \ \rm dB$ the bit error probability is $p_{\rm B} \approx \rm 2 · 10^{–4}$. The same minimum value is provided by a system simulation (red dots) under the following conditions: | ||
| + | # PN modulation, whether with an "M-sequence" or with a "Walsh function", at any spreading factor $J$, if only one user is active. | ||
| + | # Synchronous CDMA operation with Walsh functions, even if other users $($maximum $J -1)$ are active in the same frequency band. | ||
| + | # The rake receiver can be dispensed with, since no intersymbol interference occurs with the AWGN channel. | ||
| − | + | ==Two users with M-sequence spreading== | |
| − | + | <br> | |
| − | + | We consider the interfering influence of a second (clock-synchronous) user on the error probability of user 1. | |
| − | |||
| − | + | [[File:EN_Mod_T_5_4_S3a.png|right|frame| Bit error probability with band spreading $(J = 15)$ with M-sequences]] | |
| − | |||
| + | *Spreading is done using M-sequences which, unlike Walsh functions, are not orthogonal to each other. | ||
| + | *The spreading factor in each case is $J = 15$. Let the octal identifiers of the two PN spreading sequences involved be $(23)$ and $(31)$. | ||
| − | |||
| + | For example, from this diagram can be read: | ||
| − | * | + | *With only one user, it results in the blue solid curve. |
| − | * | + | *The second user increases the error probability enormously: At $10 · \lg \ (E_{\rm B}/N_0) = 8 \ \rm dB$ from $p_{\rm B} = 2· 10^{–4} = 0.02\%$ to $p_{\rm B} =1.5\%$ $($brown markings, $τ = 0)$. |
| − | + | *By phase-shifting the PN sequences with respect to each other by multiples of the chip duration, one can achieve large improvements. | |
| + | *For example, if the PN sequence $(31)$ of the interfering user is shifted by $τ = 2T_c$ to the right (red markings), instead of $p_{\rm B} =1.5\%$ only $p_{\rm B} = 0.034\%$ is obtained. | ||
| + | <br clear=all> | ||
| + | [[File:P_ID1896__Mod_T_5_4_S3b_ganz_neu.png |right|frame| PCCF of the PN sequences $(23)$ and $(31)$]] | ||
| − | : | + | <br>The results can be understood by considering the periodic cross-correlation function $\rm (PCCF)$ $φ_\text{23, 31}(λ \cdot T_c)$ between the sequences $(23)$ and $(31)$. |
| + | *The smaller the PCCF magnitude at $\tau$, the smaller $p_{\rm B}$. | ||
| + | *Thus, one could also shift the second PN sequence to the right by six or eight chip durations or to the left by five, six, or seven chip durations (red dots). | ||
| + | *In all these cases, the PCCF magnitude $|φ_\text{23, 31}(2 T_c)| = 1/15$ is smaller compared to | ||
| + | :#$\ \ |φ_\text{23, 31}(0)| = 7/15$ (ochre dots), | ||
| + | :#$\ \ |φ_\text{23, 31}(3 T_c)| = 5/15$ (green dots), and | ||
| + | :#$\ \ |φ_\text{23, 31}(T_c)| = 3/15$ (purple dots). | ||
| + | <br clear=all> | ||
| + | ==Asynchronous CDMA operation with Walsh functions== | ||
| + | <br> | ||
| + | In the section [[Modulation_Methods/Error_Probability_of_Direct-Sequence_Spread_Spectrum_Modulation#System_configurations_for_minimum_error_probability|"System configurations for minimum error probability"]], it was shown that when orthogonal Walsh functions are used, the bit error probability $p_{\rm B}$ is not changed compared with the BPSK comparison curve (system without band spreading) even in the presence of other CDMA subscribers, as long as all subscribers operate synchronously. | ||
| + | [[File:EN_Mod_T_5_4_S4neu.png|right|frame| Bit error probability for asynchronous CDMA operation with Walsh spreading functions ]] | ||
| + | |||
| + | *In mobile communications, this condition is generally fulfilled for the downlink (the transmitter is a single base station), | ||
| + | *but not in the uplink (transmitters are many mobile terminals). | ||
| + | The diagram shows bit error probability curves for the most unfavorable phase offset of the spreading sequences of the considered user and the interfering user, each with spreading factor $J = 16$. The first user always used Walsh function no. $15$. | ||
| + | The result can be summarized as follows: | ||
| + | *If the second participant uses the Walsh function no. $1$, a phase shift does not have a negative effect, since for all $λ$–values the PCCF $φ_\text{1, 15}(λ · T_c) = 0$. | ||
| + | *On the other hand, if the second participant uses Walsh function no. $14$ $($or any other with identification number greater than/equal to $8)$, a phase shift by one chip duration results in a huge degradation. | ||
| + | *Although $φ_\text{14, 15}(\lambda=0) = 0$ holds, for $λ = 1$ this PCCF has a very large value with $φ_\text{14, 15}(T_c) = 3/4$. | ||
| + | |||
| + | ==Bit error probability for the two-way channel== | ||
| + | <br> | ||
| + | For the rest of this chapter "Error Probability of Direct-Sequence Spread Spectrum Modulation" we assume: | ||
| + | *Walsh functions are used for band spreading. The spreading factor in each case is $J = 16$. In particular, we consider the functions: | ||
| + | :$$ \langle w_\nu^{\hspace{0.12cm}(1)}\rangle = | ||
| + | {+\hspace{-0.05cm}1}\hspace{0.15cm} | ||
| + | {-\hspace{-0.05cm}1} \hspace{0.15cm} | ||
| + | {+\hspace{-0.05cm}1}\hspace{0.15cm} | ||
| + | {-\hspace{-0.05cm}1} \hspace{0.15cm} | ||
| + | {+\hspace{-0.05cm}1}\hspace{0.15cm} | ||
| + | {-\hspace{-0.05cm}1} \hspace{0.15cm} | ||
| + | {+\hspace{-0.05cm}1}\hspace{0.15cm} | ||
| + | {-\hspace{-0.05cm}1} \hspace{0.15cm} | ||
| + | {+\hspace{-0.05cm}1}\hspace{0.15cm} | ||
| + | {-\hspace{-0.05cm}1} \hspace{0.15cm} | ||
| + | {+\hspace{-0.05cm}1}\hspace{0.15cm} | ||
| + | {-\hspace{-0.05cm}1} \hspace{0.15cm} | ||
| + | {+\hspace{-0.05cm}1}\hspace{0.15cm} | ||
| + | {-\hspace{-0.05cm}1} \hspace{0.15cm} | ||
| + | {+\hspace{-0.05cm}1}\hspace{0.15cm} | ||
| + | {-\hspace{-0.05cm}1} \hspace{0.05cm},$$ | ||
| + | :$$ \langle w_\nu^{\hspace{0.12cm}(2)}\rangle = | ||
| + | {+\hspace{-0.05cm}1}\hspace{0.15cm} | ||
| + | {+\hspace{-0.05cm}1} \hspace{0.15cm} | ||
| + | {-\hspace{-0.05cm}1}\hspace{0.15cm} | ||
| + | {-\hspace{-0.05cm}1} \hspace{0.15cm} | ||
| + | {+\hspace{-0.05cm}1}\hspace{0.15cm} | ||
| + | {+\hspace{-0.05cm}1} \hspace{0.15cm} | ||
| + | {-\hspace{-0.05cm}1}\hspace{0.15cm} | ||
| + | {-\hspace{-0.05cm}1} \hspace{0.15cm} | ||
| + | {+\hspace{-0.05cm}1}\hspace{0.15cm} | ||
| + | {+\hspace{-0.05cm}1} \hspace{0.15cm} | ||
| + | {-\hspace{-0.05cm}1}\hspace{0.15cm} | ||
| + | {-\hspace{-0.05cm}1} \hspace{0.15cm} | ||
| + | {+\hspace{-0.05cm}1}\hspace{0.15cm} | ||
| + | {+\hspace{-0.05cm}1} \hspace{0.15cm} | ||
| + | {-\hspace{-0.05cm}1}\hspace{0.15cm} | ||
| + | {-\hspace{-0.05cm}1} \hspace{0.05cm},$$ | ||
| + | :$$ \langle w_\nu^{(12)}\rangle = | ||
| + | {+\hspace{-0.05cm}1}\hspace{0.15cm} | ||
| + | {+\hspace{-0.05cm}1} \hspace{0.15cm} | ||
| + | {+\hspace{-0.05cm}1}\hspace{0.15cm} | ||
| + | {+\hspace{-0.05cm}1} \hspace{0.15cm} | ||
| + | {-\hspace{-0.05cm}1}\hspace{0.15cm} | ||
| + | {-\hspace{-0.05cm}1} \hspace{0.15cm} | ||
| + | {-\hspace{-0.05cm}1}\hspace{0.15cm} | ||
| + | {-\hspace{-0.05cm}1} \hspace{0.15cm} | ||
| + | {-\hspace{-0.05cm}1}\hspace{0.15cm} | ||
| + | {-\hspace{-0.05cm}1} \hspace{0.15cm} | ||
| + | {-\hspace{-0.05cm}1}\hspace{0.15cm} | ||
| + | {-\hspace{-0.05cm}1} \hspace{0.15cm} | ||
| + | {+\hspace{-0.05cm}1}\hspace{0.15cm} | ||
| + | {+\hspace{-0.05cm}1} \hspace{0.15cm} | ||
| + | {+\hspace{-0.05cm}1}\hspace{0.15cm} | ||
| + | {+\hspace{-0.05cm}1} \hspace{0.05cm}.$$ | ||
| + | |||
| + | *Only one subscriber is active at a time ⇒ interference from other users does not occur. | ||
| + | *The channel contains a multipath component in addition to the AWGN noise: The main path is attenuated by a factor of $0.8$. | ||
| + | *In addition, there is an echo at a distance of $2T_c$ with a weight of $0.6$. The channel impulse response in this case is: | ||
| + | [[File:EN_Mod_T_5_4_S5a_neu.png |right|frame| CDMA error probability with two-way channel]] | ||
| + | :$$h_{\rm K}(t) = 0.8 \cdot \delta (t) + 0.6 \cdot \delta (t - 2 T_c).$$ | ||
| + | |||
| + | The diagram shows bit error probability curves. These show: | ||
| + | *The Walsh function no. $2$ (brown dots) is conceivably unsuitable for the two-way channel defined above, since here the band spreading signal $b(t)$ almost cancels itself out due to the echo at the distance $2T_c$. This can also be seen from the PACF value $φ_{22}(τ = 2T_c) = -1$. | ||
| + | *The Walsh function no. $1$ (yellow dots) is very well suited for this channel. The echo signal is constructively superimposed on the signal on the main path and $b(t)$ is almost doubled. The good result can be explained by the PACF value $φ_{11}(τ = 2T_c) = +1$. | ||
| + | *With Walsh function no. $12$ (red dots), the constructive and destructive superpositions almost balance out, so that the error probability is approximately on the BPSK curve. All other Walsh functions also lie between the brown and yellow boundary curves. | ||
| + | |||
| + | |||
| + | |||
| + | |||
| + | {{BlaueBox||TEXT= | ||
| + | $\text{Conclusion:}$ | ||
| + | *The user with Walsh function no. $1$ has significantly better conditions than the user with Walsh function no. $2$ at the considered channel with echo delay $2 \cdot T_c$. | ||
| + | *For a channel with echo delay $T_c$ the user with Walsh function no. $2$ would have significantly better conditions than the user with Walsh function no. $1$. | ||
| + | * However, since a network operator must provide the same conditions for all users with any channel, this configuration is unsuitable for practical operation. | ||
| + | *In the following, it is shown how to provide approximately equal conditions for all subscribers.}} | ||
| + | |||
| + | |||
| + | ==Influence of additional scrambling of the spreading sequence== | ||
| + | <br> | ||
| + | [[File:EN_Mod_T_5_4_S5b_neu.png|right|frame | CDMA error probability with two-way channel, additional scrambling ]] | ||
| + | One way to equalize the quality for the individual subscribers even for the two-way channel is to add scrambling with $w(t)$ according to the [[Modulation_Methods/Error_Probability_of_Direct-Sequence_Spread_Spectrum_Modulation#The_IS-95_CDMA_system|$\text{block diagram}$]] shown at the front. For the diagram shown on the right it is assumed: | ||
| + | *The participating subscribers use different Walsh functions for band spreading, all with spreading factor $J = 16$. | ||
| + | *Each user is additionally scrambled by an M-sequence of period length $P = 63$ $($register degree $G = 6)$. | ||
| + | *The plotted points apply to Walsh function no. $12$ as spreading signal $c(t)$ and scrambling $w(t)$ by the M-sequence with octal identifier $\rm (163)_{octal}$. | ||
| + | |||
| + | |||
| + | Compared with the pure AWGN channel, the two-way channel considered with coefficients $0.8$ and $0.6$ gives a degradation of about $2 \ \rm dB$ to $3 \ \rm dB$ ⇒ horizontal distance between the plotted points and the blue comparison curve. | ||
| + | |||
| + | '''Note:''' The results for other Walsh functions, e.g. no. $1$ or no. $2$ differ only insignificantly from this diagram $($valid for Walsh function no. $12)$ within the character accuracy. | ||
| + | <br clear =all> | ||
| + | {{BlaueBox||TEXT= | ||
| + | $\text{Conclusion:}$ | ||
| + | *The additional scrambling with $w(t)$ serves only to create equal conditions for all participants in a channel with echo distortions. | ||
| + | *Thus, $w(t)$ does not cause any additional band spreading. | ||
| + | |||
| + | |||
| + | All participants thus experience the same degradation due to an echo, compared to the ideal channel. Otherwise (without this scrambling), the customers with poor conditions would complain to the operator and possibly claim recourse, while the other customers would accept the constructive echo overlay, which is favorable to them, perhaps delightedly but surely tacitly.}} | ||
| + | |||
| + | |||
| + | ==Examinations of the rake receiver== | ||
| + | <br> | ||
| + | Finally, let us consider the improvement by using a rake receiver, which is illustrated by the following diagram. For example, for $10 · \lg \ E_{\rm B}/N_0 = 8 \ \rm dB$ this reduces the bit error probability from $\rm 6 · 10^{–3}$ to $\rm 5 · 10^{-4}$. | ||
| + | |||
| + | [[File:EN_Mod_T_5_4_S6a_neu.png|right|frame |CDMA error probability curves with and without rake receiver]] | ||
| + | |||
| + | Note that the exact same assumptions apply to this diagram as to the [[Modulation_Methods/Error_Probability_of_Direct-Sequence_Spread_Spectrum_Modulation#Influence_of_additional_scrambling_of_the_spreading_sequence|$\text{diagram in the last section}$]]: | ||
| + | *Band spreading with $J =16$ and Walsh function no. $12$, | ||
| + | *additional scrambling by the M-sequence no. $\rm (163)_{octal}$, | ||
| + | *two-way channel with $h_{\rm K}(t) = 0.8 · δ(t) + 0.6 · δ(t - 2T_c)$, | ||
| + | *SNR: $10 · \lg \ E_{\rm B}/N_0 = 8 \ \rm dB$. | ||
| + | |||
| + | |||
| + | The reason for this improvement is the smaller variance ${σ_d}^2$ of the detection signal samples, as can be seen from the probability density functions $f_d(d)$ shown on the right. Here, ${σ_d}^2 = {σ_{\rm I}}^2 + {σ_{\rm N}}^2$ is composed of two components: | ||
| + | *The fraction ${σ_{\rm N}}^2$ of the AWGN noise $n(t)$ in the total variance ${σ_d}^2$ depends solely on the abscissa $(E_{\rm B}/N_0)$ and is the same with and without rake. | ||
| + | *The smaller $σ_d^2$ with rake is solely due to the fact that the rake receiver combats the intersymbol interference. Thus, ${σ_{\rm I}}^2$ is not zero for the (red) receiver with rake, but it is significantly smaller than for the (black) receiver without rake. | ||
| + | |||
| + | |||
| + | |||
| + | ==Principle of the rake receiver== | ||
| + | <br> | ||
| + | [[File:EN_Mod_T_5_4_S6b.png |right|frame| Two-way channel and associated rake receiver]] | ||
| + | The rake principle is illustrated by the diagram. The two-way channel consists of | ||
| + | |||
| + | *the direct path with delay time $τ_0$ and weight $h_0$, | ||
| + | *an echo with delay $τ_1 > τ_0$ and weight $h_1$. | ||
| + | |||
| + | |||
| + | Let both amplitude coefficients be real. As a normalization condition is valid in the following: | ||
| + | :$${h_0}^2 + {h_1}^2 = 1.$$ | ||
| + | |||
| + | The task of the rake receiver is to concentrate the signal energies of the two paths (in general: of all paths) to a single point in time. It therefore works like a "rake" for the garden. | ||
| + | |||
| + | If one applies a Dirac delta pulse at time $t = 0$ to the channel input ⇒ $s(t) = δ(t)$, there are three Dirac delta pulses at the output of the rake receiver: | ||
| + | :$$b(t) = \big [ h_0 \cdot h_1\cdot \delta (t - 2 \tau_0)\big ] + \big [(h_0^2 + h_1^2) \cdot \delta (t - \tau_0- \tau_1) \big ]+ | ||
| + | \big [h_0 \cdot h_1\cdot \delta (t - 2 \tau_1) \big ] \hspace{0.05cm}.$$ | ||
| + | *The signal energy is concentrated in the output signal at time $τ_0 + τ_1$, and two of the total four paths contribute to this. | ||
| + | *The Dirac delta functions at $2τ_0$ and $2τ_1$ do cause intersymbol interference. | ||
| + | *However, their weights $(h_0 · h_1)$ are much smaller than the weight of the main path $({h_0}^2 + {h_1}^2)$. | ||
| + | |||
| + | |||
| + | {{GraueBox|TEXT= | ||
| + | $\text{Example 1:}$ | ||
| + | *With parameter values $h_0 = 0.8$ and $h_1 = 0.6$, the main path $($with weight $h_0)$ contains only $\rm 0.8^2/(0.8^2 + 0.6^2) = 64\%$ of the total signal energy. | ||
| + | *With rake receiver and the same weights the above equation is | ||
| + | :$$b(t) = \big [ 0.48 \cdot \delta (t - 2 \tau_0)\big ] + \big [1.0 \cdot \delta (t - \tau_0- \tau_1)\big ] + | ||
| + | \big [ 0.48 \cdot \delta (t - 2 \tau_1)\big ] \hspace{0.05cm}.$$ | ||
| + | *The contribution of the main path to the total energy is now $\rm 1^2/(1^2 + 0.48^2 + 0.48^2) ≈ 68\%$, slightly larger than without rake. }} | ||
| + | |||
| + | |||
| + | {{BlaueBox|TEXT= | ||
| + | $\text{Conclusion:}$ | ||
| + | *Rake receivers are preferred for implementation in mobile devices, but have limited performance with many active subscribers. | ||
| + | *In a multipath channel with many $(M)$ paths, the rake also has $M$ fingers. | ||
| + | *The main finger (called the "searcher") is responsible for identifying and classifying the individual paths of multiple propagation in most mobile radio systems. }} | ||
| + | |||
| + | |||
| + | ==Exercises for the chapter== | ||
| + | <br> | ||
| + | [[Aufgaben:Exercise_5.5:_Multi-User_Interference|Exercise 5.5: Multi-User Interference]] | ||
| + | |||
| + | [[Aufgaben:Exercise_5.5Z:_About_the_Rake_Receiver|Exercise 5.5Z: About the Rake Receiver]] | ||
| − | |||
| − | |||
{{Display}} | {{Display}} | ||
Latest revision as of 18:30, 23 January 2023
Contents
- 1 The IS-95 CDMA system
- 2 System configurations for minimum error probability
- 3 Two users with M-sequence spreading
- 4 Asynchronous CDMA operation with Walsh functions
- 5 Bit error probability for the two-way channel
- 6 Influence of additional scrambling of the spreading sequence
- 7 Examinations of the rake receiver
- 8 Principle of the rake receiver
- 9 Exercises for the chapter
The IS-95 CDMA system
The properties of PN modulation are now given using the example of the American mobile radio standard $\text{IS–95}$, which has resulted from the work of $\text{Qualcomm Inc.}$ and in particular of $\text{Andrew J. Viterbi}$. In a somewhat simplified representation – without convolutional encoder, interleaver and de-interleaver as well as the Viterbi decoder at the receiver - the following block diagram results. The following statements are valid:
- The spreading signal $c(t)$ causes "band spreading" by the spreading factor $J$, with $\text{Walsh functions}$ or $\text{M–Sequences}$.
- "Band compression" at the receiver uses the same spreading sequence in a phase-synchronous manner.
- The additional $±1$ signal $w(t)$ provides additional "scrambling", but does not cause further band spreading.
- The rectangular duration of $w(t)$ is exactly as large $(T_c)$ as the rectangular duration of $c(t)$. $T_c$ is called the "chip duration".
- Without band spreading and scrambling $($or with $J = 1)$, the transmission chain corresponds to $\text{BPSK modulation}$.
- The matched filter is implemented by the $\text{Integrate & Dump}$ variant, so it is an optimal system.
- With $H_{\rm K}(f) = 1$, the $\text{AWGN channel model}$ is obtained with the Gaussian distributed noise signal $n(t)$ and the AWGN parameter $E_{\rm B}/N_0$.
- The additional interference component $i(t)$ summarizes the "interferences from other users".
- In the case of a $\text{multipath channel}$ (one main path and one or more secondary paths), the resulting intersymbol interference can be reduced by using a $\text{rake receiver}$.
System configurations for minimum error probability
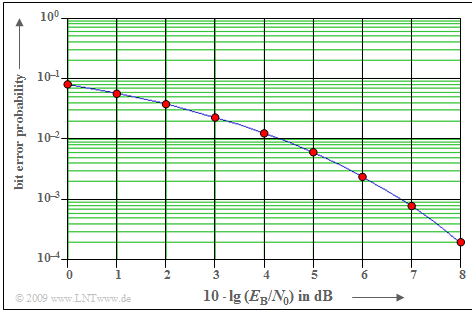
The diagram shows the bit error probability at BPSK as a function of the logarithmized AWGN parameter $E_{\rm B}/N_0$ (signal energy per bit related to the noise power density) as a solid blue curve. With the $\text{complementary Gaussian error function}$ ${\rm Q}(x)$:
- $$p_{\rm B} = {\rm Q} \left ( \sqrt{{2\cdot E_{\rm B}}/{N_{\rm 0}}}\hspace{0.05cm}\right ) \hspace{0.05cm}.$$
For example, with $10 · \lg \ (E_{\rm B}/N_0) = 8 \ \rm dB$ the bit error probability is $p_{\rm B} \approx \rm 2 · 10^{–4}$. The same minimum value is provided by a system simulation (red dots) under the following conditions:
- PN modulation, whether with an "M-sequence" or with a "Walsh function", at any spreading factor $J$, if only one user is active.
- Synchronous CDMA operation with Walsh functions, even if other users $($maximum $J -1)$ are active in the same frequency band.
- The rake receiver can be dispensed with, since no intersymbol interference occurs with the AWGN channel.
Two users with M-sequence spreading
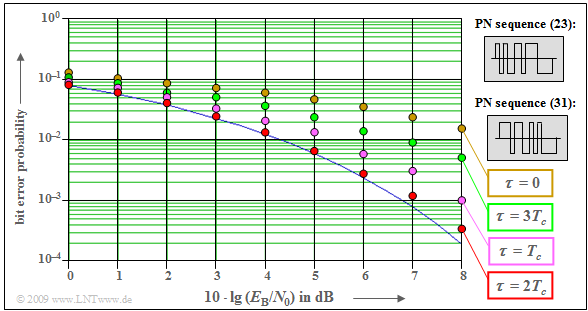
We consider the interfering influence of a second (clock-synchronous) user on the error probability of user 1.
- Spreading is done using M-sequences which, unlike Walsh functions, are not orthogonal to each other.
- The spreading factor in each case is $J = 15$. Let the octal identifiers of the two PN spreading sequences involved be $(23)$ and $(31)$.
For example, from this diagram can be read:
- With only one user, it results in the blue solid curve.
- The second user increases the error probability enormously: At $10 · \lg \ (E_{\rm B}/N_0) = 8 \ \rm dB$ from $p_{\rm B} = 2· 10^{–4} = 0.02\%$ to $p_{\rm B} =1.5\%$ $($brown markings, $τ = 0)$.
- By phase-shifting the PN sequences with respect to each other by multiples of the chip duration, one can achieve large improvements.
- For example, if the PN sequence $(31)$ of the interfering user is shifted by $τ = 2T_c$ to the right (red markings), instead of $p_{\rm B} =1.5\%$ only $p_{\rm B} = 0.034\%$ is obtained.
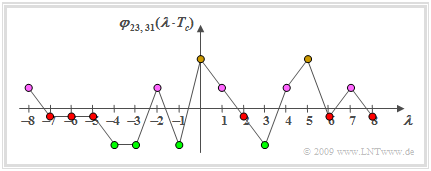
The results can be understood by considering the periodic cross-correlation function $\rm (PCCF)$ $φ_\text{23, 31}(λ \cdot T_c)$ between the sequences $(23)$ and $(31)$.
- The smaller the PCCF magnitude at $\tau$, the smaller $p_{\rm B}$.
- Thus, one could also shift the second PN sequence to the right by six or eight chip durations or to the left by five, six, or seven chip durations (red dots).
- In all these cases, the PCCF magnitude $|φ_\text{23, 31}(2 T_c)| = 1/15$ is smaller compared to
- $\ \ |φ_\text{23, 31}(0)| = 7/15$ (ochre dots),
- $\ \ |φ_\text{23, 31}(3 T_c)| = 5/15$ (green dots), and
- $\ \ |φ_\text{23, 31}(T_c)| = 3/15$ (purple dots).
Asynchronous CDMA operation with Walsh functions
In the section "System configurations for minimum error probability", it was shown that when orthogonal Walsh functions are used, the bit error probability $p_{\rm B}$ is not changed compared with the BPSK comparison curve (system without band spreading) even in the presence of other CDMA subscribers, as long as all subscribers operate synchronously.
- In mobile communications, this condition is generally fulfilled for the downlink (the transmitter is a single base station),
- but not in the uplink (transmitters are many mobile terminals).
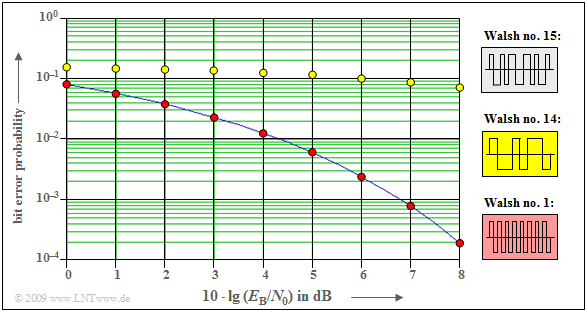
The diagram shows bit error probability curves for the most unfavorable phase offset of the spreading sequences of the considered user and the interfering user, each with spreading factor $J = 16$. The first user always used Walsh function no. $15$.
The result can be summarized as follows:
- If the second participant uses the Walsh function no. $1$, a phase shift does not have a negative effect, since for all $λ$–values the PCCF $φ_\text{1, 15}(λ · T_c) = 0$.
- On the other hand, if the second participant uses Walsh function no. $14$ $($or any other with identification number greater than/equal to $8)$, a phase shift by one chip duration results in a huge degradation.
- Although $φ_\text{14, 15}(\lambda=0) = 0$ holds, for $λ = 1$ this PCCF has a very large value with $φ_\text{14, 15}(T_c) = 3/4$.
Bit error probability for the two-way channel
For the rest of this chapter "Error Probability of Direct-Sequence Spread Spectrum Modulation" we assume:
- Walsh functions are used for band spreading. The spreading factor in each case is $J = 16$. In particular, we consider the functions:
- $$ \langle w_\nu^{\hspace{0.12cm}(1)}\rangle = {+\hspace{-0.05cm}1}\hspace{0.15cm} {-\hspace{-0.05cm}1} \hspace{0.15cm} {+\hspace{-0.05cm}1}\hspace{0.15cm} {-\hspace{-0.05cm}1} \hspace{0.15cm} {+\hspace{-0.05cm}1}\hspace{0.15cm} {-\hspace{-0.05cm}1} \hspace{0.15cm} {+\hspace{-0.05cm}1}\hspace{0.15cm} {-\hspace{-0.05cm}1} \hspace{0.15cm} {+\hspace{-0.05cm}1}\hspace{0.15cm} {-\hspace{-0.05cm}1} \hspace{0.15cm} {+\hspace{-0.05cm}1}\hspace{0.15cm} {-\hspace{-0.05cm}1} \hspace{0.15cm} {+\hspace{-0.05cm}1}\hspace{0.15cm} {-\hspace{-0.05cm}1} \hspace{0.15cm} {+\hspace{-0.05cm}1}\hspace{0.15cm} {-\hspace{-0.05cm}1} \hspace{0.05cm},$$
- $$ \langle w_\nu^{\hspace{0.12cm}(2)}\rangle = {+\hspace{-0.05cm}1}\hspace{0.15cm} {+\hspace{-0.05cm}1} \hspace{0.15cm} {-\hspace{-0.05cm}1}\hspace{0.15cm} {-\hspace{-0.05cm}1} \hspace{0.15cm} {+\hspace{-0.05cm}1}\hspace{0.15cm} {+\hspace{-0.05cm}1} \hspace{0.15cm} {-\hspace{-0.05cm}1}\hspace{0.15cm} {-\hspace{-0.05cm}1} \hspace{0.15cm} {+\hspace{-0.05cm}1}\hspace{0.15cm} {+\hspace{-0.05cm}1} \hspace{0.15cm} {-\hspace{-0.05cm}1}\hspace{0.15cm} {-\hspace{-0.05cm}1} \hspace{0.15cm} {+\hspace{-0.05cm}1}\hspace{0.15cm} {+\hspace{-0.05cm}1} \hspace{0.15cm} {-\hspace{-0.05cm}1}\hspace{0.15cm} {-\hspace{-0.05cm}1} \hspace{0.05cm},$$
- $$ \langle w_\nu^{(12)}\rangle = {+\hspace{-0.05cm}1}\hspace{0.15cm} {+\hspace{-0.05cm}1} \hspace{0.15cm} {+\hspace{-0.05cm}1}\hspace{0.15cm} {+\hspace{-0.05cm}1} \hspace{0.15cm} {-\hspace{-0.05cm}1}\hspace{0.15cm} {-\hspace{-0.05cm}1} \hspace{0.15cm} {-\hspace{-0.05cm}1}\hspace{0.15cm} {-\hspace{-0.05cm}1} \hspace{0.15cm} {-\hspace{-0.05cm}1}\hspace{0.15cm} {-\hspace{-0.05cm}1} \hspace{0.15cm} {-\hspace{-0.05cm}1}\hspace{0.15cm} {-\hspace{-0.05cm}1} \hspace{0.15cm} {+\hspace{-0.05cm}1}\hspace{0.15cm} {+\hspace{-0.05cm}1} \hspace{0.15cm} {+\hspace{-0.05cm}1}\hspace{0.15cm} {+\hspace{-0.05cm}1} \hspace{0.05cm}.$$
- Only one subscriber is active at a time ⇒ interference from other users does not occur.
- The channel contains a multipath component in addition to the AWGN noise: The main path is attenuated by a factor of $0.8$.
- In addition, there is an echo at a distance of $2T_c$ with a weight of $0.6$. The channel impulse response in this case is:
- $$h_{\rm K}(t) = 0.8 \cdot \delta (t) + 0.6 \cdot \delta (t - 2 T_c).$$
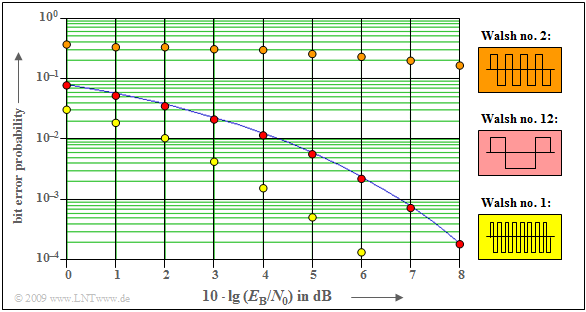
The diagram shows bit error probability curves. These show:
- The Walsh function no. $2$ (brown dots) is conceivably unsuitable for the two-way channel defined above, since here the band spreading signal $b(t)$ almost cancels itself out due to the echo at the distance $2T_c$. This can also be seen from the PACF value $φ_{22}(τ = 2T_c) = -1$.
- The Walsh function no. $1$ (yellow dots) is very well suited for this channel. The echo signal is constructively superimposed on the signal on the main path and $b(t)$ is almost doubled. The good result can be explained by the PACF value $φ_{11}(τ = 2T_c) = +1$.
- With Walsh function no. $12$ (red dots), the constructive and destructive superpositions almost balance out, so that the error probability is approximately on the BPSK curve. All other Walsh functions also lie between the brown and yellow boundary curves.
$\text{Conclusion:}$
- The user with Walsh function no. $1$ has significantly better conditions than the user with Walsh function no. $2$ at the considered channel with echo delay $2 \cdot T_c$.
- For a channel with echo delay $T_c$ the user with Walsh function no. $2$ would have significantly better conditions than the user with Walsh function no. $1$.
- However, since a network operator must provide the same conditions for all users with any channel, this configuration is unsuitable for practical operation.
- In the following, it is shown how to provide approximately equal conditions for all subscribers.
Influence of additional scrambling of the spreading sequence
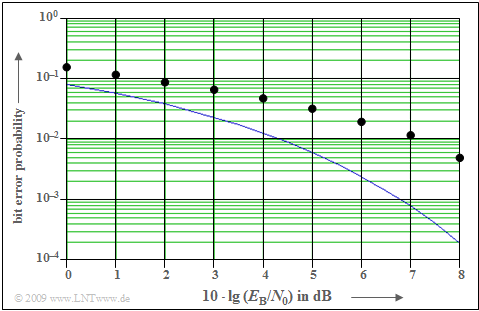
One way to equalize the quality for the individual subscribers even for the two-way channel is to add scrambling with $w(t)$ according to the $\text{block diagram}$ shown at the front. For the diagram shown on the right it is assumed:
- The participating subscribers use different Walsh functions for band spreading, all with spreading factor $J = 16$.
- Each user is additionally scrambled by an M-sequence of period length $P = 63$ $($register degree $G = 6)$.
- The plotted points apply to Walsh function no. $12$ as spreading signal $c(t)$ and scrambling $w(t)$ by the M-sequence with octal identifier $\rm (163)_{octal}$.
Compared with the pure AWGN channel, the two-way channel considered with coefficients $0.8$ and $0.6$ gives a degradation of about $2 \ \rm dB$ to $3 \ \rm dB$ ⇒ horizontal distance between the plotted points and the blue comparison curve.
Note: The results for other Walsh functions, e.g. no. $1$ or no. $2$ differ only insignificantly from this diagram $($valid for Walsh function no. $12)$ within the character accuracy.
$\text{Conclusion:}$
- The additional scrambling with $w(t)$ serves only to create equal conditions for all participants in a channel with echo distortions.
- Thus, $w(t)$ does not cause any additional band spreading.
All participants thus experience the same degradation due to an echo, compared to the ideal channel. Otherwise (without this scrambling), the customers with poor conditions would complain to the operator and possibly claim recourse, while the other customers would accept the constructive echo overlay, which is favorable to them, perhaps delightedly but surely tacitly.
Examinations of the rake receiver
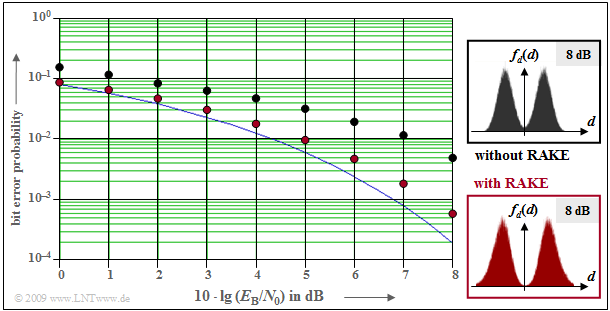
Finally, let us consider the improvement by using a rake receiver, which is illustrated by the following diagram. For example, for $10 · \lg \ E_{\rm B}/N_0 = 8 \ \rm dB$ this reduces the bit error probability from $\rm 6 · 10^{–3}$ to $\rm 5 · 10^{-4}$.
Note that the exact same assumptions apply to this diagram as to the $\text{diagram in the last section}$:
- Band spreading with $J =16$ and Walsh function no. $12$,
- additional scrambling by the M-sequence no. $\rm (163)_{octal}$,
- two-way channel with $h_{\rm K}(t) = 0.8 · δ(t) + 0.6 · δ(t - 2T_c)$,
- SNR: $10 · \lg \ E_{\rm B}/N_0 = 8 \ \rm dB$.
The reason for this improvement is the smaller variance ${σ_d}^2$ of the detection signal samples, as can be seen from the probability density functions $f_d(d)$ shown on the right. Here, ${σ_d}^2 = {σ_{\rm I}}^2 + {σ_{\rm N}}^2$ is composed of two components:
- The fraction ${σ_{\rm N}}^2$ of the AWGN noise $n(t)$ in the total variance ${σ_d}^2$ depends solely on the abscissa $(E_{\rm B}/N_0)$ and is the same with and without rake.
- The smaller $σ_d^2$ with rake is solely due to the fact that the rake receiver combats the intersymbol interference. Thus, ${σ_{\rm I}}^2$ is not zero for the (red) receiver with rake, but it is significantly smaller than for the (black) receiver without rake.
Principle of the rake receiver
The rake principle is illustrated by the diagram. The two-way channel consists of
- the direct path with delay time $τ_0$ and weight $h_0$,
- an echo with delay $τ_1 > τ_0$ and weight $h_1$.
Let both amplitude coefficients be real. As a normalization condition is valid in the following:
- $${h_0}^2 + {h_1}^2 = 1.$$
The task of the rake receiver is to concentrate the signal energies of the two paths (in general: of all paths) to a single point in time. It therefore works like a "rake" for the garden.
If one applies a Dirac delta pulse at time $t = 0$ to the channel input ⇒ $s(t) = δ(t)$, there are three Dirac delta pulses at the output of the rake receiver:
- $$b(t) = \big [ h_0 \cdot h_1\cdot \delta (t - 2 \tau_0)\big ] + \big [(h_0^2 + h_1^2) \cdot \delta (t - \tau_0- \tau_1) \big ]+ \big [h_0 \cdot h_1\cdot \delta (t - 2 \tau_1) \big ] \hspace{0.05cm}.$$
- The signal energy is concentrated in the output signal at time $τ_0 + τ_1$, and two of the total four paths contribute to this.
- The Dirac delta functions at $2τ_0$ and $2τ_1$ do cause intersymbol interference.
- However, their weights $(h_0 · h_1)$ are much smaller than the weight of the main path $({h_0}^2 + {h_1}^2)$.
$\text{Example 1:}$
- With parameter values $h_0 = 0.8$ and $h_1 = 0.6$, the main path $($with weight $h_0)$ contains only $\rm 0.8^2/(0.8^2 + 0.6^2) = 64\%$ of the total signal energy.
- With rake receiver and the same weights the above equation is
- $$b(t) = \big [ 0.48 \cdot \delta (t - 2 \tau_0)\big ] + \big [1.0 \cdot \delta (t - \tau_0- \tau_1)\big ] + \big [ 0.48 \cdot \delta (t - 2 \tau_1)\big ] \hspace{0.05cm}.$$
- The contribution of the main path to the total energy is now $\rm 1^2/(1^2 + 0.48^2 + 0.48^2) ≈ 68\%$, slightly larger than without rake.
$\text{Conclusion:}$
- Rake receivers are preferred for implementation in mobile devices, but have limited performance with many active subscribers.
- In a multipath channel with many $(M)$ paths, the rake also has $M$ fingers.
- The main finger (called the "searcher") is responsible for identifying and classifying the individual paths of multiple propagation in most mobile radio systems.
Exercises for the chapter
Exercise 5.5: Multi-User Interference
Exercise 5.5Z: About the Rake Receiver

