Difference between revisions of "Modulation Methods/Phase Modulation (PM)"
m |
m |
||
| Line 200: | Line 200: | ||
==Interpretation of the Bessel spectrum== | ==Interpretation of the Bessel spectrum== | ||
<br> | <br> | ||
| − | + | The graph shows the Bessel functions ${\rm J}_0(η)$, ... , ${\rm J}_7(η)$ depending on the modulation index $η$ in the range Bereich $0 ≤ η ≤ 10$. | |
| − | [[File:Mod_T_3_1_S3a_version2.png|right|frame| | + | [[File:Mod_T_3_1_S3a_version2.png|right|frame| $n$–th order Bessel functions of the first kind]] |
| − | + | One can also find these in collections of formulas such as [BS01]<ref>Bronstein, I.N.; Semendjajew, K.A.: ''Taschenbuch der Mathematik.'' 5. Auflage. Frankfurt: Harry Deutsch, 2001.</ref> in tabular form. | |
| − | * | + | *That the functions are of the first kind is expressed by the $\rm J$, and |
| − | * | + | *the order is given by the index $n$. |
<br><br><br><br><br><br><br><br><br><br><br><br> | <br><br><br><br><br><br><br><br><br><br><br><br> | ||
| − | + | Using this graph, the equivalent low-pass signal is given by | |
| − | + | $$s_{\rm TP}(t) = A_{\rm T} \cdot \sum_{n = - \infty}^{+\infty}{\rm J}_n (\eta) \cdot {\rm e}^{\hspace{0.05cm}{\rm j} \hspace{0.05cm}\cdot \hspace{0.05cm}n\hspace{0.05cm}\cdot \hspace{0.05cm}\omega_{\rm N} \hspace{0.05cm}\cdot \hspace{0.05cm} t}$$ | |
| − | + | and the following properties can be derived: | |
<br clear=all> | <br clear=all> | ||
| − | * | + | *the equivalent low-pass signal is composed of a pointer at rest $(n = 0)$ and infinitely many clockwise $(n < 0)$ or counterclockwise $(n > 0)$ rotating pointers. |
| − | * | + | *The pointer lengths depend on the modulation index $η$ via the Bessel functions ${\rm J}_n(η)$ . The smaller $η$ is, however, the more pointers can be ignored for the construction of $s_{\rm TP}(t)$ . |
| − | * | + | *With a modulation index of $η = 1$ for example, the following approximation holds: |
:$$s_{\rm TP}(t) = {\rm J}_0 (1) + {\rm J}_1 (1)\cdot {\rm e}^{\hspace{0.05cm}{\rm j} \hspace{0.05cm}\omega_{\rm N} \hspace{0.05cm} t}+ {\rm J}_2 (1)\cdot {\rm e}^{\hspace{0.05cm}{\rm j} \hspace{0.05cm}2 \hspace{0.05cm}\omega_{\rm N} \hspace{0.05cm} t}+ {\rm J}_3 (1)\cdot {\rm e}^{\hspace{0.05cm}{\rm j} \hspace{0.05cm}3 \hspace{0.05cm}\omega_{\rm N} \hspace{0.05cm} t}- {\rm J}_1 (1)\cdot {\rm e}^{-{\rm j} \hspace{0.05cm}\omega_{\rm N} \hspace{0.05cm} t}+ {\rm J}_2 (1)\cdot {\rm e}^{-{\rm j} \hspace{0.05cm}2 \hspace{0.05cm}\omega_{\rm N} \hspace{0.05cm} t}- {\rm J}_3 (1)\cdot {\rm e}^{-{\rm j} \hspace{0.05cm}3 \hspace{0.05cm}\omega_{\rm N} \hspace{0.05cm} t}\hspace{0.05cm}.$$ | :$$s_{\rm TP}(t) = {\rm J}_0 (1) + {\rm J}_1 (1)\cdot {\rm e}^{\hspace{0.05cm}{\rm j} \hspace{0.05cm}\omega_{\rm N} \hspace{0.05cm} t}+ {\rm J}_2 (1)\cdot {\rm e}^{\hspace{0.05cm}{\rm j} \hspace{0.05cm}2 \hspace{0.05cm}\omega_{\rm N} \hspace{0.05cm} t}+ {\rm J}_3 (1)\cdot {\rm e}^{\hspace{0.05cm}{\rm j} \hspace{0.05cm}3 \hspace{0.05cm}\omega_{\rm N} \hspace{0.05cm} t}- {\rm J}_1 (1)\cdot {\rm e}^{-{\rm j} \hspace{0.05cm}\omega_{\rm N} \hspace{0.05cm} t}+ {\rm J}_2 (1)\cdot {\rm e}^{-{\rm j} \hspace{0.05cm}2 \hspace{0.05cm}\omega_{\rm N} \hspace{0.05cm} t}- {\rm J}_3 (1)\cdot {\rm e}^{-{\rm j} \hspace{0.05cm}3 \hspace{0.05cm}\omega_{\rm N} \hspace{0.05cm} t}\hspace{0.05cm}.$$ | ||
| − | * | + | *Here, the symmetrical relationship ${\rm J}_{–n}(η) = (–1)^n · {\rm J}_n(η)$ is taken into account. Thus: |
:$${\rm J}_{-1}(\eta) = - {\rm J}_{1}(\eta), \hspace{0.3cm}{\rm J}_{-2}(\eta) = {\rm J}_{2}(\eta), \hspace{0.3cm}{\rm J}_{-3}(\eta) = - {\rm J}_{3}(\eta).$$ | :$${\rm J}_{-1}(\eta) = - {\rm J}_{1}(\eta), \hspace{0.3cm}{\rm J}_{-2}(\eta) = {\rm J}_{2}(\eta), \hspace{0.3cm}{\rm J}_{-3}(\eta) = - {\rm J}_{3}(\eta).$$ | ||
| − | * | + | *Further, it can be seen from the above equation that $s_{\rm TP}(t)$ with $η = 3$ is composed of significantly more pointers, namely those with indices ${\rm J}_{–6}(\eta)$, ... , ${\rm J}_{+6}(\eta)$. |
| − | [[File:EN_Mod_T_3_1_S3c.png |right|frame| | + | [[File:EN_Mod_T_3_1_S3c.png |right|frame| Equivalent low-pass–signal in phase modulation]] |
{{GraueBox|TEXT= | {{GraueBox|TEXT= | ||
| − | $\rm | + | $\rm Example\ 3\text{:}$ Die Besselfunktionen liefern für den Modulationsindex $η = 1$ folgende Werte: |
:$${\rm J}_0 = 0.765,\hspace{0.3cm}{\rm J}_1 = - {\rm J}_{ - 1} = 0.440, \hspace{0.3cm}{\rm J}_2 = {\rm J}_{ - 2} = 0.115,\hspace{0.3cm}{\rm J}_3 = - {\rm J}_{ - 3} = 0.020\hspace{0.05cm}.$$ | :$${\rm J}_0 = 0.765,\hspace{0.3cm}{\rm J}_1 = - {\rm J}_{ - 1} = 0.440, \hspace{0.3cm}{\rm J}_2 = {\rm J}_{ - 2} = 0.115,\hspace{0.3cm}{\rm J}_3 = - {\rm J}_{ - 3} = 0.020\hspace{0.05cm}.$$ | ||
Revision as of 18:33, 10 March 2022
Contents
- 1 # OVERVIEW OF THE THIRD MAIN CHAPTER #
- 2 Similarities between phase and frequency modulation
- 3 Signal characteristics of phase modulation
- 4 Equivalent low-pass signal in phase modulation
- 5 Interpretation of the Bessel spectrum
- 6 Spektralfunktion eines phasenmodulierten Sinussignals
- 7 Phasenmodulation der Summe zweier Sinusschwingungen
- 8 Aufgaben zum Kapitel
- 9 Quellenverzeichnis
# OVERVIEW OF THE THIRD MAIN CHAPTER #
$\Rightarrow \hspace{0.5cm}\text{We are just beginning the English translation of this chapter.}$
The third chapter describes angle modulation $\rm (WM)$ (from the German "Winkelmodulation") – this name is a generic term for phase modulation $\rm (PM)$ and frequency modulation $\rm (FM)$ – as well their the associated demodulators.
In detail, it covers:
- the similarities and differences between phase and frequency modulation,
- the signal characteristics and spectral functions of angle-modulated signals and the influence of band limiting,
- the signal-to-noise power ratio of FM, which is more favorable than that of AM.
Similarities between phase and frequency modulation
It has already been pointed out in the chapter General Model of Modulation that there are substantial similarities between phase modulation $\rm (PM)$ and frequency modulation $\rm (FM)$ . Therefore, these two related modulation methods are summarized under the general term "angle modulation".
$\rm Definition\text{:}$ An angle modulation – abbreviated as $\rm WM$ – is present whenever the modulated signal can be represented as follows:
- $$s(t) = A_{\rm T} \cdot \cos\big[\psi(t)\big] = A_{\rm T} \cdot \cos\hspace{-0.1cm}\big[ω_{\rm T} · t + ϕ(t)\big] \hspace{0.05cm}.$$
- Here, as in amplitude modulation $A_{\rm T}$ denotes the amplitude of the carrier signal $z(t)$.
- However, all the information about the source signal $q(t)$ is now captured by the angular function $ψ(t)$.
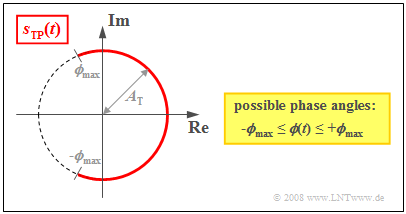
Based on the plot of the equivalent low-pass signal $s_{\rm TP}(t)$ ( subscript from the German "Tiefpass" ⇒ low-pass) on the complex plane (we will refer to such a plot as as a "locus curve") , the following charactistics of angle modulation can be seen:
- The locus curve is an arc with radius $A_{\rm T}$. It follows that the envelope of an angle-modulated signal is always constant:
- $$a(t) = |s_{\rm TP}(t)|= A_{\rm T}= {\rm const.}$$
- The equivalent low-pass signal in angle modulation is always complex and determined by a time-dependent phase function $ϕ(t)$ (in radians), which determines the zero intercepts of $s(t)$ :
- $$s_{\rm TP}(t)= A_{\rm T} \cdot {\rm e}^{\hspace{0.05cm}{\rm j}\hspace{0.05cm}\cdot \hspace{0.05cm}\phi(t)}\hspace{0.05cm}.$$
- For a symmetric source signal $q(t)$ , $ϕ(t)$ can take on all values between $±ϕ_{\rm max}$ , where $ϕ_{\rm max}$ indicates the phase deviation . The larger the phase deviation, the more intense the modulation.
- For a harmonic oscillation, the phase deviation $ϕ_{\rm max}$ is equal to the modulation index $η$. Thus, the use of $η$ in what follows simultaneously indicates that $q(t)$ only contains a single frequency.
- The relationship between the source signal $q(t)$ and the angular function $ψ(t) = \cos\hspace{-0.1cm}\big[ω_{\rm T} · t + ϕ(t)\big]$ like the phase function $ϕ(t)$ that can be derived from it, differs fundamentally in phase and frequency modulation, which will be discussed in detail in the chapter Frequency Modulation .
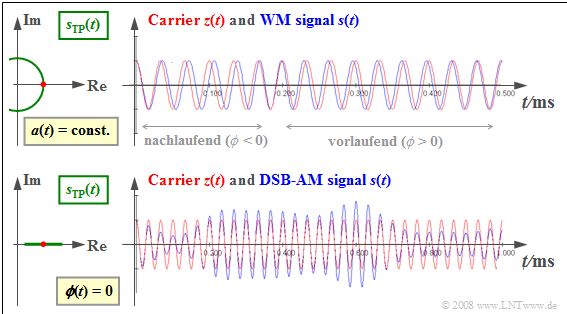
$\text{Example 1:}$ The following graph shows
- the transmitted signal $s(t)$ on the right ⇒ blue waveforms compared to the carrier signal $z(t)$ ⇒ red oscillations,
- as well as on the left, the equivalent low-pass signal $s_{\rm TP}(t)$ in the complex plane.
We also refer to the (left) plot in the complex plane as the "locus curve " ⇒ green waveforms.
The upper graph applies to to angle modulation $\rm WM$:
- The equivalent low-pass signal $s_{\rm TP}(t) = A_{\rm T} · {\rm e}^{ \hspace{0.05cm}{\rm j}\hspace{0.05cm}· \hspace{0.05cm}ϕ(t)}$ describes an arc ⇒ constant envelope $a(t) = A_{\rm T}$.
- Thus, the information about the source signal $q(t)$ is exclusively in found in the zero intercepts of $s(t)$.
- Should $ϕ(t) < 0$ hold, then the zero crossings of $s(t)$ occur later than those of $z(t)$ .
- Otherwise – when $ϕ(t) > 0$ – the zero crossings of $s(t)$ come before $z(t)$ ,.
The lower graph corresponds to Double-sideband Amplitude Modulation $\rm (DSB-AM)$ as described in Chapter 2 beschrieben, characterised bx
- the time-dependent envelope $a(t)$ according to the source signal $q(t)$,
- equidistant zero crossings of $s(t)$ according to the carrier $z(t)$, and
- a horizontal straight line as the locus curve $s_{\rm TP}(t)$.
The present third chapter has been structured according to the following considerations:
- Any FM system can be converted into a corresponding PM system by simple modifications and vice versa.
- FM is more important for analog systems due to its more favorable noise behaviour. For this reason, considerations concerning the realization of the modulator/demodulator will only be dealt with in the chapter Frequency Modulation (FM).
- Phase modulation (PM) is easier to understand compared to FM. Therefore, the basic porperties of an angle modulation system are first presented in this chapter using PM as an example.
Signal characteristics of phase modulation
Without limiting generality, the following assumes:
- a cosine carrier signal $z(t) = A_{\rm T} · \cos(ω_{\rm T} · t)$, that is, the carrier phase is always $ϕ_{\rm T} = 0$,
- a peak-limited source signal between the limits $\ –q_{\rm max} ≤ q(t) ≤ +q_{\rm max}$.
$\rm Definition\text{:}$ If the phase function $ϕ(t)$ is proportional to the applied source signal $q(t)$, we are dealing with phase modulation $\rm (PM)$, and it holds that:
- $$\phi(t)= K_{\rm PM} \cdot q(t)\hspace{0.05cm}\hspace{0.3cm}\Rightarrow \hspace{0.3cm}\psi(t)= \omega_{\rm T} \cdot t + \phi(t)\hspace{0.3cm}\Rightarrow \hspace{0.3cm}s(t) = A_{\rm T} \cdot \cos \big[\psi(t)\big]\hspace{0.05cm}.$$
Here, $K_{\rm PM}$ denotes the modulator constant with appropriate dimensions. If $q(t)$ describes a voltage waveform, this constant has the unit $\rm 1/V$.
The phase modulaton is all the more intensive,
- the larger the modulator constant $K_{\rm PM}$ is, or
- the larger the maximum value $q_{\rm max}$ of the source signal is.
Quantitatively, this fact is captured by the phase deviation
- $$ \phi_{\rm max} = K_{\rm PM} \cdot q_{\rm max}\hspace{0.05cm}.$$
For a harmonic oscillation, the "phase deviation" is also called the modulation index and the following holds with a source signal amplitude apmplitude $A_{\rm N}$ :
- $$\eta = \eta_{\rm PM} = K_{\rm PM} \cdot A_{\rm N}\hspace{0.05cm}.$$
The following should be noted about this equation:
- The modulation index $η$ is comparable to the modulation depth $m$ in DSB–AM with carrier.
- In the locus curve, $ϕ_{\rm max}$ or $η$ describe the half angle of the cricular arc in radians.
- For other source signals with the same $η$ – for example: a different phase $ϕ_{\rm N}$ – the locus curve itself does not change, only the temporal movement along the curve does.
- The modulation index is also used in describing frequency modulation, but then it is to be calculated somewhat differently.
- We therefore distinguish between $η_{\rm PM}$ and $η_{\rm FM}$.
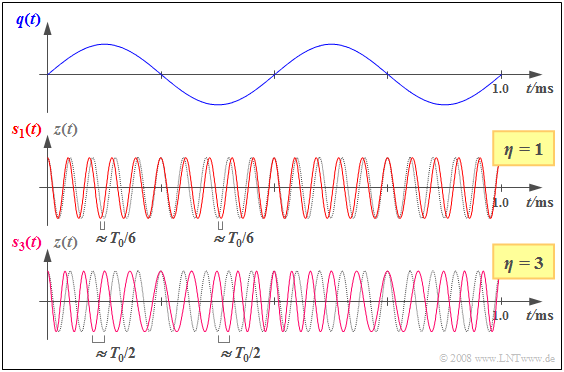
$\rm Example \ 2\text{:}$ At the top, the graph shows a sinusoidal source signal $q(t)$ with frequency $f_{\rm N} = 2 \ \rm kHz$ and amplitude $A_{\rm N}$ , and the two phase modulated signals drawn below. These differ by the parameters $η = 1$ and $η = 3$, respectively:
- $$s_\eta(t) = A_{\rm T} \cdot \cos \hspace{-0.1cm}\big[\omega_{\rm T} \cdot t + \eta \cdot \sin (\omega_{\rm N} \cdot t) \big]\hspace{0.05cm}.$$
Dotted in gray is the cosine carrier signal $z(t)$ , in each case based on $f_{\rm T} = 20 \ \rm kHz$ .
For example, the modulation index $η = 1$ and thus the transmitted signal $s_1(t)$ is given by
- $A_{\rm N} = 1 \ \rm V $ and $K_{\rm PM} = \rm 1/V$,
- but also by parameter values $A_{\rm N} = 2 \ \rm V$ and $K_{\rm PM} = \rm 0.5/V$.
From the curves, one can see:
- The zero crossings of the transmitted signal $s_1(t)$ and the carrier signal $z(t)$ coincide exactly when $q(t) ≈ 0$ .
- When $q(t) = +\hspace{-0.05cm}A_{\rm N}$ , the zero crossings of $s_1(t)$ come $1/(2π) ≈ 0.159$ of a carrier period $T_0$ earlier ("leading"), and when $q(t) = -\hspace{-0.05cm}A_{\rm N}$ , come the same period fraction later ("lagging").
- If we increase the modulation index to $η = 3$ – either by tripling $A_{\rm N}$ or $K_{\rm PM}$, we get qualitatively the same result, but with a more intense phase modulation.
- The zero crossings of $s_3(t)$ are now shifted relative to those of the clock signal by a maximum of $\rm ±3/(2π) ≈ ±0.5$ of a carrier period, i.e., up to $±T_0/2$.
Equivalent low-pass signal in phase modulation
In prepartion for deriving the spectrum $S(f)$ of a phase modulated signal $s(t)$ , we first analyse the the equivalent low-pass signal $s_{\rm TP}(t)$ . In the folowing, we assume:
- a sine-shaped source signal with amplitude $A_{\rm N}$ and frequency $f_{\rm N}$,
- a cosine-shaped carrier signal with amplitude $A_{\rm T}$ and frequency $f_{\rm T}$,
- a phase modulationwith modulation index $η = K_{\rm PM} · A_{\rm N}$.
Thus, the phase modulated signal and the corresponding equivalent low-pass signal are:
- $$s(t) = A_{\rm T} \cdot \cos \big[\omega_{\rm T} \cdot t + \eta \cdot \sin (\omega_{\rm N} \cdot t) \big]\hspace{0.05cm},$$
- $$s_{\rm TP}(t) = A_{\rm T} \cdot {\rm e}^{\hspace{0.05cm}{\rm j} \hspace{0.05cm}\cdot \hspace{0.05cm}\eta \hspace{0.05cm}\cdot \hspace{0.05cm}\sin (\omega_{\rm N} \cdot t) }\hspace{0.05cm}.$$
This signal is periodic and can be represented by a complex Fourier series . Thus, in general one obtains:
- $$s_{\rm TP}(t) = \sum_{n = - \infty}^{+\infty}D_{n} \cdot {\rm e}^{\hspace{0.05cm}{\rm j} \hspace{0.05cm}\cdot \hspace{0.05cm}n\hspace{0.05cm}\cdot \hspace{0.05cm}\omega_{\rm N} \hspace{0.05cm}\cdot \hspace{0.05cm} t} \hspace{0.05cm}.$$
In the special case considered here (sinusoidal source signal, cosinusoidal carrier) the typically complex Fourier coefficients $D_n$ are all real and given by the first kind of $n$–th order Bessel functions ${\rm J}_n(η)$ as follows:
- $$D_{n} = A_{\rm T}\cdot {\rm J}_n (\eta) \hspace{0.05cm}. \hspace{1cm} $$
$\text{Important intermediate result:}$ Now it should be mathematically proven that the quivalent low-pass signal can, in the case of phase modulation, indeed be converted into the following function series:
- $$s_{\rm TP}(t) = A_{\rm T} \cdot {\rm e}^{\hspace{0.05cm}{\rm j} \hspace{0.05cm}\cdot \hspace{0.05cm}\eta \hspace{0.05cm}\cdot \hspace{0.05cm}\sin (\omega_{\rm N} \cdot t) } \hspace{0.3cm}\Rightarrow \hspace{0.3cm} s_{\rm TP}(t) = A_{\rm T} \cdot \sum_{n = - \infty}^{+\infty}{\rm J}_n (\eta) \cdot {\rm e}^{\hspace{0.05cm}{\rm j} \hspace{0.05cm}\cdot \hspace{0.05cm}n\hspace{0.05cm}\cdot \hspace{0.05cm}\omega_{\rm N} \hspace{0.05cm}\cdot \hspace{0.05cm} t}.$$
$\text{Proof:}$ For simplicity, we set $A_{\rm T} = 1$. Thus, the given equivalent low-pass signal is:
- $$s_{\rm TP}(t) = {\rm e}^{\hspace{0.05cm}{\rm j} \hspace{0.05cm}\cdot \hspace{0.05cm}\eta \hspace{0.05cm}\cdot \hspace{0.05cm}\sin (\omega_{\rm N} \cdot t) }\hspace{0.05cm}.$$
(1) When $x = {\rm j} · η · \sin(γ)$ and $γ = ω_{\rm N} · t$ the power series expansion of this equation is:
- $$s_{\rm TP}(t) = {\rm e}^{x } = 1 + x + \frac{1}{2!} \cdot x^2 + \frac{1}{3!} \cdot x^3 + \text{...} = 1 + {\rm j} \cdot \eta \cdot \sin (\gamma)+ \frac{1}{2!} \cdot {\rm j}^2 \cdot \eta^2 \cdot \sin^2 (\gamma)+ \frac{1}{3!} \cdot {\rm j}^3 \cdot \eta^3 \cdot \sin^3 (\gamma) + \text{...}$$
(2) The individual trigonometric expressions can be rewritten as follows:
- $$ \frac{1}{2!} \cdot {\rm j}^2 \cdot \eta^2 \cdot \sin^2 (\gamma) = \frac{- \eta^2}{2 \cdot 2!} \cdot \big[ 1 - \cos (2\gamma)\big],\hspace{1.0cm} \frac{1}{3!} \cdot {\rm j}^3 \cdot \eta^3 \cdot \sin^3 (\gamma) = \frac{- {\rm j} \cdot \eta^3}{4 \cdot 3!} \cdot \big[ 3 \cdot \sin (\gamma)- \sin (3\gamma)\big],$$
- $$ \frac{1}{4!} \cdot {\rm j}^4 \cdot \eta^4 \cdot \sin^4 (\gamma) = \frac{\eta^4}{8 \cdot 4!} \cdot \left[ 3+ 4 \cdot \cos (2\gamma)+ \cos (4\gamma)\right], \text{...} $$
(3) By rearranging using ${\rm J}_n(η)$, we obtain the first kind of $n$–th order Bessel functions:
- $$s_{\rm TP}(t) = 1 \cdot {\rm J}_0 (\eta) + 2 \cdot {\rm j}\cdot {\rm J}_1 (\eta)\cdot \sin (\gamma) \hspace{0.2cm} + 2 \cdot {\rm J}_2 (\eta)\cdot \cos (2\gamma) + 2 \cdot {\rm j}\cdot {\rm J}_3 (\eta)\cdot \sin (3\gamma)+ 2 \cdot {\rm J}_4 (\eta)\cdot \cos (4\gamma) + \text{...} $$
(4) Using Euler's theorem, this can be written as:
- $$s_{\rm TP}(t) = {\rm J}_0 (\eta) + \big[ {\rm e}^{\hspace{0.05cm}{\rm j} \hspace{0.05cm}\cdot \hspace{0.05cm} \gamma} - {\rm e}^{\hspace{0.05cm}{ - \rm j} \hspace{0.05cm}\cdot \hspace{0.05cm} \gamma} \big]\cdot {\rm J}_1 (\eta) \hspace{0.27cm} +\left[ {\rm e}^{\hspace{0.05cm}{\rm j} \hspace{0.05cm}\cdot \hspace{0.05cm} 2\gamma} + {\rm e}^{\hspace{0.05cm}{ - \rm j} \hspace{0.05cm}\cdot \hspace{0.05cm} 2\gamma} \right]\cdot {\rm J}_2 (\eta)+ \left[ {\rm e}^{\hspace{0.05cm}{\rm j} \hspace{0.05cm}\cdot \hspace{0.05cm} 3\gamma} - {\rm e}^{\hspace{0.05cm}{ - \rm j} \hspace{0.05cm}\cdot \hspace{0.05cm} 3\gamma} \right]\cdot {\rm J}_3 (\eta)+ \left[ {\rm e}^{\hspace{0.05cm}{\rm j} \hspace{0.05cm}\cdot \hspace{0.05cm} 4\gamma} + {\rm e}^{\hspace{0.05cm}{ - \rm j} \hspace{0.05cm}\cdot \hspace{0.05cm} 4\gamma} \right]\cdot {\rm J}_4 (\eta)+\text{...}$$
(5) The Bessel functions exhibit the following symmetrical properties:
- $${\rm J}_{-n} (\eta) = ( - 1)^n \cdot {\rm J}_{n} (\eta)\hspace{0.3cm} \Rightarrow \hspace{0.3cm} {\rm J}_{ - 1} (\eta) = - {\rm J}_{1} (\eta),\hspace{0.3cm}{\rm J}_{ - 2} (\eta) = {\rm J}_{2} (\eta),\hspace{0.3cm}{\rm J}_{ - 3} (\eta) = - {\rm J}_{3} (\eta),\hspace{0.3cm}{\rm J}_{ - 4} (\eta) = {\rm J}_{4} (\eta).$$
(6) Considering this fact and the factor $A_{\rm T}$ omitted so far, we get the desired result:
- $$s_{\rm TP}(t) = A_{\rm T} \cdot \sum_{n = - \infty}^{+\infty}{\rm J}_n (\eta) \cdot {\rm e}^{\hspace{0.05cm}{\rm j} \hspace{0.05cm}\cdot \hspace{0.05cm}n\hspace{0.05cm}\cdot \hspace{0.05cm}\omega_{\rm N} \hspace{0.05cm}\cdot \hspace{0.05cm} t}.$$
These mathematical functions, introduced as early as 1844 by Friedrich Wilhelm Bessel are defined as follows (first equation) and can be approximated by a series according to the second equation:
- $${\rm J}_n (\eta) = \frac{1}{2\pi}\cdot \int_{-\pi}^{+\pi} {{\rm e}^{\hspace{0.05cm}{\rm j}\hspace{0.05cm}\cdot \hspace{0.05cm}(\eta \hspace{0.05cm}\cdot \hspace{0.05cm}\sin(\alpha) -\hspace{0.05cm} n \hspace{0.05cm}\cdot \hspace{0.05cm}\alpha)}}\hspace{0.1cm}{\rm d}\alpha\hspace{0.05cm},$$
- $${\rm J}_n (\eta) = \sum\limits_{k=0}^{\infty}\frac{(-1)^k \cdot (\eta/2)^{n \hspace{0.05cm} + \hspace{0.05cm} 2 \hspace{0.02cm}\cdot \hspace{0.05cm}k}}{k! \cdot (n+k)!} \hspace{0.05cm}.$$
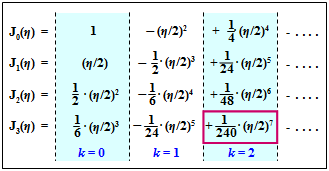
The adjacent graph shows the first three summands $(k = 0,\ 1,\ 2)$ of each of the series ${\rm J}_0(η)$, ... , ${\rm J}_3(η).$ For example, the term outlined in red – valid for $n = 3$ and $k = 2$ – is written as:
- $$\frac{(-1)^2 \cdot (\eta/2)^{3 \hspace{0.05cm} + \hspace{0.05cm} 2 \hspace{0.02cm}\cdot \hspace{0.05cm}2}}{2\hspace{0.05cm}! \cdot (3+2)\hspace{0.05cm}!} = \frac{1}{240}\cdot (\frac{\eta}{2})^7 \hspace{0.05cm}.$$
- The Bessel functions $J_n(η)$ can also be found in collections of formulas or with the calculator module we provide for Bessel functions of the first kind.
- If the function values for $n = 0$ and $n = 1$ are known, the Bessel functions for $n ≥ 2$ can be iteratively determined from them:
- $${\rm J}_n (\eta) ={2 \cdot (n-1)}/{\eta} \cdot {\rm J}_{n-1} (\eta) - {\rm J}_{n-2} (\eta) \hspace{0.05cm}.$$
Interpretation of the Bessel spectrum
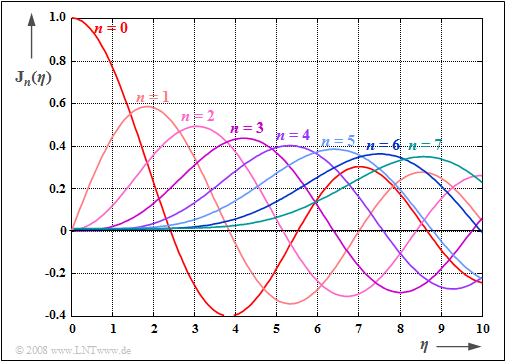
The graph shows the Bessel functions ${\rm J}_0(η)$, ... , ${\rm J}_7(η)$ depending on the modulation index $η$ in the range Bereich $0 ≤ η ≤ 10$.
One can also find these in collections of formulas such as [BS01][1] in tabular form.
- That the functions are of the first kind is expressed by the $\rm J$, and
- the order is given by the index $n$.
Using this graph, the equivalent low-pass signal is given by
$$s_{\rm TP}(t) = A_{\rm T} \cdot \sum_{n = - \infty}^{+\infty}{\rm J}_n (\eta) \cdot {\rm e}^{\hspace{0.05cm}{\rm j} \hspace{0.05cm}\cdot \hspace{0.05cm}n\hspace{0.05cm}\cdot \hspace{0.05cm}\omega_{\rm N} \hspace{0.05cm}\cdot \hspace{0.05cm} t}$$
and the following properties can be derived:
- the equivalent low-pass signal is composed of a pointer at rest $(n = 0)$ and infinitely many clockwise $(n < 0)$ or counterclockwise $(n > 0)$ rotating pointers.
- The pointer lengths depend on the modulation index $η$ via the Bessel functions ${\rm J}_n(η)$ . The smaller $η$ is, however, the more pointers can be ignored for the construction of $s_{\rm TP}(t)$ .
- With a modulation index of $η = 1$ for example, the following approximation holds:
- $$s_{\rm TP}(t) = {\rm J}_0 (1) + {\rm J}_1 (1)\cdot {\rm e}^{\hspace{0.05cm}{\rm j} \hspace{0.05cm}\omega_{\rm N} \hspace{0.05cm} t}+ {\rm J}_2 (1)\cdot {\rm e}^{\hspace{0.05cm}{\rm j} \hspace{0.05cm}2 \hspace{0.05cm}\omega_{\rm N} \hspace{0.05cm} t}+ {\rm J}_3 (1)\cdot {\rm e}^{\hspace{0.05cm}{\rm j} \hspace{0.05cm}3 \hspace{0.05cm}\omega_{\rm N} \hspace{0.05cm} t}- {\rm J}_1 (1)\cdot {\rm e}^{-{\rm j} \hspace{0.05cm}\omega_{\rm N} \hspace{0.05cm} t}+ {\rm J}_2 (1)\cdot {\rm e}^{-{\rm j} \hspace{0.05cm}2 \hspace{0.05cm}\omega_{\rm N} \hspace{0.05cm} t}- {\rm J}_3 (1)\cdot {\rm e}^{-{\rm j} \hspace{0.05cm}3 \hspace{0.05cm}\omega_{\rm N} \hspace{0.05cm} t}\hspace{0.05cm}.$$
- Here, the symmetrical relationship ${\rm J}_{–n}(η) = (–1)^n · {\rm J}_n(η)$ is taken into account. Thus:
- $${\rm J}_{-1}(\eta) = - {\rm J}_{1}(\eta), \hspace{0.3cm}{\rm J}_{-2}(\eta) = {\rm J}_{2}(\eta), \hspace{0.3cm}{\rm J}_{-3}(\eta) = - {\rm J}_{3}(\eta).$$
- Further, it can be seen from the above equation that $s_{\rm TP}(t)$ with $η = 3$ is composed of significantly more pointers, namely those with indices ${\rm J}_{–6}(\eta)$, ... , ${\rm J}_{+6}(\eta)$.
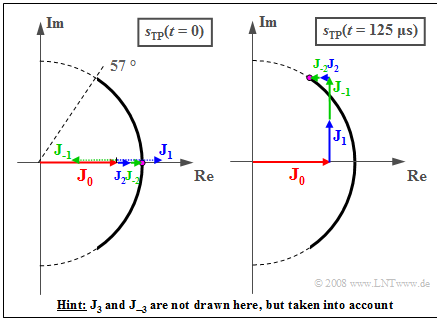
$\rm Example\ 3\text{:}$ Die Besselfunktionen liefern für den Modulationsindex $η = 1$ folgende Werte:
- $${\rm J}_0 = 0.765,\hspace{0.3cm}{\rm J}_1 = - {\rm J}_{ - 1} = 0.440, \hspace{0.3cm}{\rm J}_2 = {\rm J}_{ - 2} = 0.115,\hspace{0.3cm}{\rm J}_3 = - {\rm J}_{ - 3} = 0.020\hspace{0.05cm}.$$
Die Grafik zeigt die Zusammensetzung der Ortskurve aus den sieben Zeigern. Anmerkung:
${\rm J}_3$ und ${\rm J}_{ - 3}$ fehlen in der Skizze, aber nicht im Gesamtsignal.
Die Frequenz des sinusförmigen Quellensignals ist $f_{\rm N} = 2 \ \rm kHz$, woraus sich die Periodendauer $T_{\rm N} = 1/f_{\rm N} = 500 \ \rm µ s$ ergibt. Vereinfachend wird $A_{\rm T} = 1$ gesetzt.
Das linke Bild zeigt die Momentaufnahme zur Zeit $t = 0$.
- Wegen ${\rm J}_1 = – {\rm J}_{ – 1}$ und ${\rm J}_3 = – {\rm J}_{ – 3}$ gilt hierfür:
- $$s_{\rm TP}(t = 0) = {\rm J}_0 + {\rm J}_{2} + {\rm J}_{ - 2} = 0.765 + 2 \cdot 0.115 = 0.995 \hspace{0.05cm}.$$
- Aus dem reellen Ergebnis folgt die Phase ${\mathbf ϕ}(t = 0) = 0$ und der Betrag $a(t = 0) = 1$.
- Der geringfügig abweichende Wert $0.995$ zeigt, dass ${\rm J}_4 = {\rm J}_{ – 4}$ zwar klein ist $(≈ 0.002)$, aber nicht identisch Null.
Das rechte Bild zeigt die Verhältnisse zur Zeit $t = T_{\rm N}/4 = 125\ \rm µ s$:
- Die Zeiger mit den Längen ${\rm J}_{– 1}$ und ${\rm J}_1$ haben sich im bzw. entgegen dem Uhrzeigersinn um $90^\circ$ gedreht und zeigen nun beide in Richtung der imaginären Achse.
- Die Zeiger ${\rm J}_2$ und ${\rm J}_{– 2}$ drehen doppelt so schnell wie ${\rm J}_1$ bzw. ${\rm J}_{– 1}$ und zeigen nun beide in Richtung der negativen reellen Achse.
- ${\rm J}_3$ und ${\rm J}_{– 3}$ drehen im Vergleich zu ${\rm J}_1$ und ${\rm J}_{– 1}$ mit dreifacher Geschwindigkeit und zeigen jetzt beide nach unten.
Damit erhält man:
- $$s_{\rm TP}(t = 125\,{\rm µ s}) = {\rm J}_0 - 2 \cdot {\rm J}_{2} + {\rm j} \cdot (2 \cdot {\rm J}_{1} - 2 \cdot {\rm J}_{3})= 0.535 + {\rm j} \cdot 0.840 $$
- $$ \Rightarrow \hspace{0.3cm} a(t = 125\,{\rm µ s}) = \sqrt{0.535^2 + 0.840^2}= 0.996\hspace{0.05cm},$$
- $$ \Rightarrow \hspace{0.3cm}\phi(t = 125\,{\rm µ s}) = \arctan \frac{0.840}{0.535} = 57.5^\circ \approx 1\,{\rm rad}\hspace{0.05cm}.$$
Auch zu allen anderen Zeiten ergibt die vektorielle Summe der sieben Zeiger jeweils einen Punkt auf dem Kreisbogen mit Winkel $ϕ(t)$, wobei $\vert ϕ(t) \vert ≤ η = 1\ \rm rad $ gilt.
Spektralfunktion eines phasenmodulierten Sinussignals
$\text{Ohne Beweis:}$
- Ausgehend vom eben berechneten äquivalenten Tiefpass–Signal erhält man für das analytische Signal:
- $$s_{\rm +}(t) = s_{\rm TP}(t) \cdot {\rm e}^{\hspace{0.05cm}{\rm j} \hspace{0.05cm}\cdot \hspace{0.05cm}\omega_{\rm T} \hspace{0.05cm}\cdot \hspace{0.05cm} t}= A_{\rm T} \cdot \sum_{n = - \infty}^{+\infty}{\rm J}_n (\eta) \cdot {\rm e}^{\hspace{0.05cm}{\rm j} \hspace{0.05cm}\cdot \hspace{0.05cm}(\omega_{\rm T}\hspace{0.05cm}+\hspace{0.05cm} n\hspace{0.05cm}\cdot \hspace{0.05cm}\omega_{\rm N}) \hspace{0.05cm}\cdot \hspace{0.05cm} t}$$
- Durch Fouriertransformation ergibt sich für das Spektrum des analytischen Signals:
- $$S_{\rm +}(f) = A_{\rm T} \cdot \sum_{n = - \infty}^{+\infty}{\rm J}_n (\eta) \cdot \delta \big[f - (f_{\rm T}+ n \cdot f_{\rm N})\big]\hspace{0.05cm}.$$
- Das Spektrum des physikalischen Signals erhält man durch Ausweitung auf negative Frequenzen unter Berücksichtigung des Faktors $1/2$:
- $$S(f) = \frac{A_{\rm T} }{2} \cdot \sum_{n = - \infty}^{+\infty}{\rm J}_n (\eta) \cdot \delta \big[f \pm (f_{\rm T}+ n \cdot f_{\rm N})\big]\hspace{0.05cm}.$$
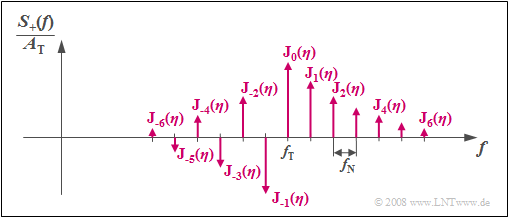
Anhand der Grafik sind folgende Aussagen möglich:
- Das Spektrum $S_+(f)$ eines phasenmodulierten Sinussignals besteht aus unendlich vielen diskreten Linien im Abstand der Nachrichtenfrequenz $f_{\rm N}$. Es ist somit prinzipiell unendlich weit ausgedehnt.
- Die Höhen (Gewichte) der Spektrallinien bei $f_{\rm T} + n · f_{\rm N}$ (wobei $n$ ganzzahlig ist) sind durch den Modulationsindex $η$ über die Besselfunktionen ${\rm J}_n(η)$ festgelegt.
- Die Werte der Besselfunktionen ${\rm J}_n(η)$ zeigen, dass man in der Praxis durch Bandbegrenzung das Spektrum nur wenig verändert. Der daraus resultierende Fehler wächst aber mit steigendem $η$.
- Die Spektrallinien sind bei sinusförmigem Quellensignal und cosinusförmigem Träger reell und für gerades $n$ symmetrisch um $f_{\rm T}$. Bei ungeradem $n$ ist ein Vorzeichenwechsel zu berücksichtigen.
- Die Phasenmodulation einer Schwingung mit anderer Phase von Quellen– und/oder Trägersignal liefert das gleiche Betragsspektrum und unterscheidet sich nur bezüglich der Phasenfunktion.
Setzt sich das Nachrichtensignal aus mehreren Schwingungen zusammen, so ist die Berechnung des Spektrums schwierig, nämlich:
- Faltung der Einzelspektren (siehe nächster Abschnitt und Aufgabe 3.3).
Phasenmodulation der Summe zweier Sinusschwingungen
Setzt sich das Quellensignal aus der Summe zweier Sinusschwingungen zusammen, so lauten die Signale am Ausgang des Phasenmodulators:
- $$s(t) = A_{\rm T} \cdot \cos \big[\omega_{\rm T} \cdot t + \eta_1 \cdot \sin (\omega_{\rm 1} \cdot t) + \eta_2 \cdot \sin(\omega_{\rm 2} \cdot t)\big]\hspace{0.05cm},$$
- $$s_{\rm TP}(t) = A_{\rm T} \cdot {\rm e}^{\hspace{0.05cm}{\rm j} \hspace{0.05cm}\cdot [\hspace{0.05cm}\eta_1 \hspace{0.05cm}\cdot \hspace{0.08cm}\sin (\omega_{\rm 1} \hspace{0.05cm}\cdot \hspace{0.05cm} t) \hspace{0.05cm}+ \hspace{0.05cm}\eta_2 \hspace{0.05cm}\cdot \hspace{0.08cm}\sin (\omega_{\rm 2} \hspace{0.05cm}\cdot \hspace{0.05cm}t)]}\hspace{0.05cm}.$$
Zur einfacheren Darstellung setzten wir nun $A_{\rm T} = 1$ und erhalten:
- $$s_{\rm TP}(t) = {\rm e}^{\hspace{0.05cm}{\rm j} \hspace{0.05cm}\cdot \hspace{0.05cm}\eta_1 \hspace{0.05cm}\cdot \hspace{0.08cm}\sin (\omega_{\rm 1} \hspace{0.05cm}\cdot \hspace{0.05cm} t) } \cdot {\rm e}^{\hspace{0.05cm}{\rm j} \hspace{0.05cm}\cdot \hspace{0.05cm}\eta_2 \hspace{0.05cm}\cdot \hspace{0.08cm}\sin (\omega_{\rm 2} \hspace{0.05cm}\cdot \hspace{0.05cm} t) }\hspace{0.05cm}.$$
Die Spektralfunktionen der beiden Terme lauten:
- $${\rm e}^{\hspace{0.05cm}{\rm j} \hspace{0.05cm}\cdot \hspace{0.05cm}\eta_1 \hspace{0.05cm}\cdot \hspace{0.08cm}\sin (2 \pi \hspace{0.05cm}\cdot \hspace{0.05cm}f_{\rm 1} \hspace{0.01cm}\cdot \hspace{0.05cm} t) } \hspace{0.2cm}\circ\!\!-\!\!\!-\!\!\!-\!\!\bullet\, \hspace{0.2cm} B_1(f) = \sum_{n = - \infty}^{+\infty}{\rm J}_n (\eta_1) \cdot \delta (f - n \cdot f_{\rm 1})\hspace{0.05cm},$$
- $${\rm e}^{\hspace{0.05cm}{\rm j} \hspace{0.05cm}\cdot \hspace{0.05cm}\eta_2 \hspace{0.05cm}\cdot \hspace{0.08cm}\sin (2 \pi \hspace{0.05cm}\cdot \hspace{0.05cm}f_{\rm 2} \hspace{0.01cm}\cdot \hspace{0.05cm} t) } \hspace{0.2cm}\circ\!\!-\!\!\!-\!\!\!-\!\!\bullet\, \hspace{0.2cm} B_2(f) = \sum_{n = - \infty}^{+\infty}{\rm J}_n (\eta_2) \cdot \delta (f - n \cdot f_{\rm 2})\hspace{0.05cm}.$$
- Die Besselfunktionen $B_1(f)$ und $B_2(f)$ beschreiben Linienspektren im Frequenzabstand $f_1$ und $f_2$, deren Impulsgewichte durch $η_1$ und $η_2$ bestimmt sind.
- Aufgrund der Multiplikation im Zeitbereich ergibt sich für die Spektralfunktion die Faltung:
- $$S_{\rm TP}(f) = B_1(f) \star B_2(f)= S_{\rm +}(f + f_{\rm T}) \hspace{0.05cm}.$$
$\rm Beispiel\ 4\text{:}$ Die linke Grafik zeigt die Besselfunktion $B_1(f)$ für $η_1 = 0.64$ und $f_1 = 1 \ \rm kHz$.
- Auf die deutlich kleineren Linien bei $f = ±2 \ \rm kHz$ mit den Gewichten $0.05$ ist der Übersichtlichkeit halber verzichtet.
- Die Funktion $B_2(f)$ gilt für den gleichen Modulationsindex $η_2 = η_1$, aber für die Nachrichtenfrequenz $f_2 = 4 \ \rm kHz$.
- Das Tiefpass-Spektrum $S_{\rm TP}(f) = B_1(f) \star B_2(f)$ besteht hier aus neun Diraclinien. Es ist im rechten Diagramm skizziert.
- Durch Frequenzverschiebung um $f_{\rm T}$ nach rechts erhält man das Spektrum $S_+(f)$ des analytischen Signals $s_+(t)$.
- Es gilt also $S_+(f = f_{\rm T}) = S_{\rm TP}(f = 0) = 0.81$.
Aufgaben zum Kapitel
Aufgabe 3.1: Ortskurve bei Phasenmodulation
Aufgabe 3.1Z: Einfluss der Nachrichtenphase bei PM
Aufgabe 3.2: Spektrum bei Winkelmodulation
Aufgabe 3.3: Summe zweier Schwingungen
Aufgabe 3.3Z: Kenngrößenbestimmung
Aufgabe 3.4: Einfacher Phasenmodulator
Quellenverzeichnis
- ↑ Bronstein, I.N.; Semendjajew, K.A.: Taschenbuch der Mathematik. 5. Auflage. Frankfurt: Harry Deutsch, 2001.
