General Model of Modulation
Contents
- 1 Joint description of amplitude and angle modulation
- 2 A very simple (though unfortunately not always correct) modulator equation
- 3 Modulated signals with a digital source signal
- 4 Describing the physical signal using the analytic signal
- 5 Describing the physical signal using the equivalent low-pass signal
- 6 Exercises for the chapter
Joint description of amplitude and angle modulation
In the following two chapters "Amplitude Modulation" $\rm (AM)$ and
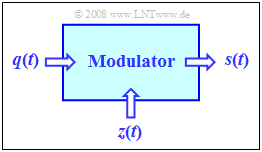
"Angle Modulation" $\rm (WM$ – from German "Winkelmodulation", including $\rm PM$ as well as $\rm FM)$ we will always consider the set-up shown in the figure on the right. Here, the central block is the »Modulator«.
The two input signals and the output signal have the following characteristics:
- The »source signal« (German: "Quellensignal" ⇒ letter "q") ⇒ $q(t)$ is the low-frequency message signal and has the spectrum $Q(f)$. This signal is continuous in value and time and limited to the frequency range $|f| ≤ B_{\rm NF}$
("NF" from German "Niederfrequenz" i.e. "low-frequency").
- The »carrier signal« $z(t)$ is a harmonic oscillation of the form (subscript "T" from German "Träger" i.e. "carrier"):
- $$z(t) = A_{\rm T} \cdot \cos(2 \pi f_{\rm T} t - \varphi_{\rm T})= A_{\rm T} \cdot \cos(2 \pi f_{\rm T} t + \phi_{\rm T})\hspace{0.05cm}.$$
- The »transmitted signal« (German: "Sendesignal" ⇒ letter "s") ⇒ $s(t)$ is a higher frequency signal, whose spectrum $S(f)$ is in the range around the carrier frequency $f_{\rm T}$.
The modulator output signal $s(t)$ depends on both input signals $q(t)$ and $z(t)$. The modulation methods considered below differ only by different combinations of $q(t)$ and $z(t)$.
$\text{Definition:}$ Each $\text{harmonic oscillation}$ $z(t)$ can be described by
- the amplitude $A_{\rm T}$,
- the frequency $f_{\rm T}$ and
- the zero phase position ${\it ϕ}_{\rm T}$ .
Though the above left equation with a minus sign and $φ_{\rm T}$ is mostly used for the application of Fourier series and Fourier integrals, the right equation with ${\it ϕ}_{\rm T} = \ – φ_{\rm T}$ and a plus sign is more common for the description of modulation processes.
A very simple (though unfortunately not always correct) modulator equation
$\text{Definition:}$ Starting from the harmonic oscillation $($here written with the angular frequency $ω_{\rm T} = 2πf_{\rm T}$)
- $$z(t) = A_{\rm T} \cdot \cos(\omega_{\rm T}\cdot t + \phi_{\rm T})$$
we arrive at the »general modulator equation«, by assuming the previously fixed oscillation parameters to be time-dependent:
- $$s(t) = a(t) \cdot \cos \big[\omega(t) \cdot t + \phi(t)\big ]\hspace{0.05cm}.$$
$\text{!! Attention !!}$ This general modulator equation is very simple and striking and aids in understanding modulation methods. Unfortunately, this equation is true for frequency modulation only in exceptional cases. This will be discussed further in the chapter "Signal characteristics in frequency modulation" .
Special cases included in this equation are:
- In »amplitude modulation« $\rm (AM)$, the time-dependent amplitude $a(t)$ changes according to the signal $q(t)$, while the other two signal parameters stay constant:
- $$\omega(t) = \omega_{\rm T} = {\rm const.}\hspace{0.08cm}, \hspace{0.2cm}\phi(t) = \phi_{\rm T} = {\rm const.}\hspace{0.08cm}, \hspace{0.2cm} a(t) = {\rm function \hspace{0.15cm}of}\hspace{0.15cm}q(t) .$$
- In »frequency modulation« $\rm (FM)$, only the instantaneous (circular) frequency $\omega(t)$ is determined by the signal $q(t)$:
- $$a(t) = A_{\rm T} = {\rm const.}\hspace{0.08cm}, \hspace{0.2cm}\phi(t) = \phi_{\rm T} = {\rm const.}\hspace{0.08cm}, \hspace{0.2cm} \omega(t)= {\rm function \hspace{0.15cm}of}\hspace{0.15cm}q(t) .$$
- In »phase modulation« $\rm (PM)$, the phase $\phi(t)$ varies according to the signal $q(t)$:
- $$a(t) = A_{\rm T} = {\rm const.}\hspace{0.08cm}, \hspace{0.2cm}\omega(t) = \omega_{\rm T} = {\rm const.}\hspace{0.08cm}, \hspace{0.2cm} \phi(t) = {\rm function \hspace{0.15cm}of}\hspace{0.15cm}q(t) .$$
In these basic methods, two of the three oscillation parameters are thus always kept constant.
- Additionally, there are also variants with more than one time dependency for amplitude, frequency, and phase, resp.
- An example of this is $\text{Single-Sideband Modulation}$, where both $a(t)$ and ${\it ϕ}(t)$ are affected by the source signal $q(t)$.
Modulated signals with a digital source signal
When describing $\rm AM$, $\rm FM$ and $\rm PM$, the source signal $q(t)$ is usually assumed to be continuous in time and value.
- However, the above equations can also be applied to a rectangular source signal.
- In this case, $q(t)$ is continuous in time but discrete in value. Thus, it also describes methods for $\text{Linear Digital Modulation}$.
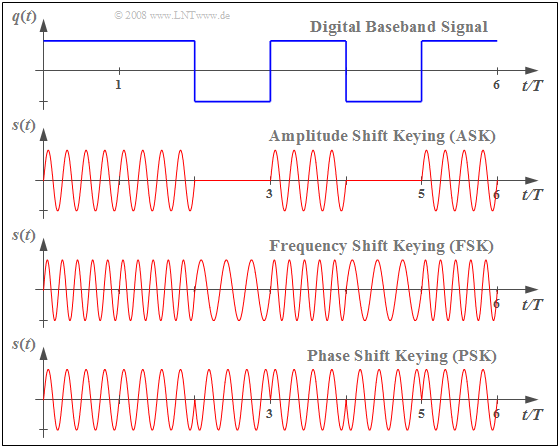
$\text{Example 1:}$ The graph shows at the top a rectangular source signal $q(t)$ ⇒ "baseband signal", and the modulated signals $s(t)$ which result from important digital modulation methods drawn underneath.
- In amplitude modulation, the digital variant of which is known as "Amplitude Shift Keying" $\rm (ASK)$, the source signal can be seen in the $s(t)$ envelope.
- In the "Frequency Shift Keying" $\rm (FSK)$ signal waveform, the two possible signal values $q(t) = +1$ and $q(t) =-1$ are represented by two different frequencies, respectively.
- "Phase Shift Keying" $\rm (PSK)$ results in phase jumps in the signal $s(t)$ when the amplitude of the source signal $q(t)$ jumps, by $\pm π$ (or $\pm 180^\circ$) in each binary case.
Describing the physical signal using the analytic signal
The modulated signal $s(t)$ is "band-pass". As already described in the book "Signal Representation", such a band-pass signal $s(t)$ is often characterized by its associated $\text{analytical signal}$ $s_+(t)$. It is important to note:
- The analytical signal $s_+(t)$ is obtained from the real physical signal $s(t)$, by adding to it (as an imaginary part) its $\text{Hilbert transform}$:
- $$s_+(t) = s(t) + {\rm j} \cdot {\rm H}\{ s(t)\}\hspace{0.05cm}.$$
- The analytical signal $s_+(t)$ is therefore always complex. The following simple relationship holds between the two time signals:
- $$s(t) = {\rm Re} \big[s_+(t)\big] \hspace{0.05cm}.$$
- The spectrum $S_+(f)$ of the analytic signal is obtained from the two-sided spectrum $S(f)$ by doubling it for positive frequencies and setting it to zero for negative frequencies:
- $$S_+(f) =\big[ 1 + {\rm sign}(f)\big] \cdot S(f) = \left\{ \begin{array}{c} 2 \cdot S(f) \\ 0 \\ \end{array} \right.\quad \begin{array}{*{10}c} {\rm{for}} \\ {\rm{for}} \\ \end{array}\begin{array}{*{20}c} f>0 \hspace{0.05cm}, \\ f<0 \hspace{0.05cm}, \\ \end{array} \hspace{1.3cm} \text{with}\hspace{1.3cm} {\rm sign}(f) = \left\{ \begin{array}{c} +1 \\ -1 \\ \end{array} \right.\quad \begin{array}{*{10}c} {\rm{for}} \\ {\rm{for}} \\ \end{array}\begin{array}{*{20}c} f>0 \hspace{0.05cm}, \\ f<0 \hspace{0.05cm}. \\ \end{array}$$
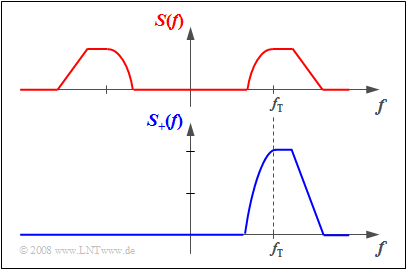
$\text{Example 2:}$ The above graph shows the spectrum $S(f)$ of a real-time signal $s(t)$. One can see:
- The axial symmetry of the spectral function $S(f)$ with respect to the frequency $f=0$:
- $${\rm Re}\big[S( - f)\big] = {\rm Re}\big[S(f)\big].$$
- If the spectrum of the actual band-pass signal $s(t)$ has an imaginary part, it would be point-symmetric about $f=0$:
- $${\rm Im}\big[S( - f)\big] = - {\rm Im}\big[S(f)\big].$$
The spectrum $S_+(f)$ of the corresponding analytical signal $s_+(t)$ is shown below. This is obtained from $S(f)$ by
- truncating the negative frequency components: $S_+(f) \equiv 0$ for $f<0$,
- doubling the positive frequency components: $S_+(f ) = 2 \cdot S(f )$ for $f \ge 0$.
Except for one exceptional case that is not relevant in practice, the analytical signal $s_+(t)$ is always complex.
We now apply these definitions to the modulated signal $s(t)$. In the special case that $q(t) \equiv 0$ , $s(t)$ is a harmonic oscillation like the carrier signal $z(t)$. It holds that:
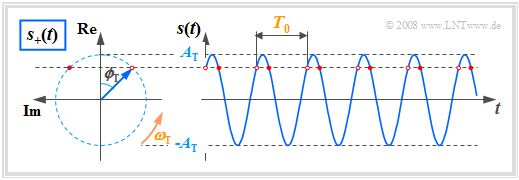
(1) To be display the relation $s(t) = {\rm Re}[s_+(t)]$ horizontally, the complex plane is rotated by $90^\circ$ to the left, contrary to the usual representation. Thus:
(2) The real part is plotted vertically and the imaginary part horizontally.
- $$s(t) = A_{\rm T} \cdot \cos(\omega_{\rm T}\cdot t + \phi_{\rm T}) \hspace{0.3cm} \Leftrightarrow \hspace{0.3cm} s_+(t) = A_{\rm T} \cdot {\rm e}^{\hspace{0.03cm}{\rm j} \hspace{0.03cm}(\omega_{\rm T}\hspace{0.05cm} t \hspace{0.05cm} + \phi_{\rm T})}\hspace{0.05cm}.$$
The second equation describes a rotating pointer with the following properties:
- The pointer length denotes the signal amplitude $A_{\rm T}$. At time $t = 0$, the pointer lies in the complex plane with an angle of $ϕ_{\rm T}$.
- For $t > 0$, the pointer rotates with constant angular velocity $ω_{\rm T}$ in a mathematically positive direction (counterclockwise).
- The pointer tip always lies on a circle with radius $A_{\rm T}$ and requires exactly the period $T_0$ for one rotation.
$\text{The individual modulation methods can now be represented as follows:}$
- In »amplitude modulation« the pointer length $a(t) = \vert s_+(t)\vert $ changes according to the source signal $q(t)$.
The angular velocity $ω(t)$ remains constant in this case.
- During »frequency modulation« the angular velocity $ω(t)$ of the rotating pointer changes according to $q(t)$.
The pointer length $a(t) = A_{\rm T}$ stays unchanged.
- In »phase modulation«, the phase $ϕ(t)$ is time-dependent according to the source signal $q(t)$.
There are many similarities with frequency modulation, which also belongs to the class of angle modulation.
Describing the physical signal using the equivalent low-pass signal
Some facts concerning modulation at the transmitter and demodulation at the receiver can be explained best by means of the $\text{equivalent low-pass signal}$ (German: "äquivalentes Tiefpass–Signal" ⇒ subscript "TP") according to the definition given in the book "Signal Representation".
The following statements hold for this signal $s_{\rm TP}(t)$:
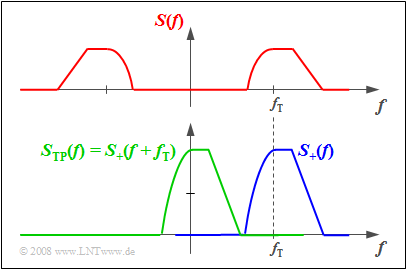
- The spectrum $S_{\rm TP}(f)$ of the equivalent low-pass signal is obtained from $S_+(f)$ by shifting it to the left by $f_{\rm T}$ and is thus in the frequency range around $f =0$:
- $$S_{\rm TP}(f) = S_+(f + f_{\rm T}) \hspace{0.05cm}.$$
- For the corresponding time function, according to the $\text{Shifting Theorem}$ holds:
- $$s_{\rm TP}(t) = s_+(t) \cdot {\rm e}^{{-\rm j}\hspace{0.08cm} \omega_{\rm T} \hspace{0.03cm}t }\hspace{0.05cm}.$$
- The equivalent low-pass signal of an unmodulated harmonic oscillation is constant for all times. The "locus curve" in this special case consists of a single point:
- $$s(t) = A_{\rm T} \cdot \cos(\omega_{\rm T}\cdot t + \phi_{\rm T}) \hspace{0.3cm} \Leftrightarrow \hspace{0.3cm} s_+(t) = {\rm e}^{\hspace{0.03cm}{\rm j} \hspace{0.03cm}(\omega_{\rm T}\hspace{0.05cm} t \hspace{0.05cm} + \phi_{\rm T})}\hspace{0.05cm},$$
- $$ s_+(t) = {\rm e}^{\hspace{0.03cm}{\rm j} \hspace{0.03cm}(\omega_{\rm T}\hspace{0.05cm} t \hspace{0.05cm} + \phi_{\rm T})}\hspace{0.3cm} \Leftrightarrow \hspace{0.3cm} s_{\rm TP}(t) = A_{\rm T} \cdot {\rm e}^{\hspace{0.03cm}{\rm j} \hspace{0.03cm} \cdot \hspace{0.05cm} \phi_{\rm T}}\hspace{0.05cm}.$$
$\text{Important result:}$ For an amplitude or phase modulated signal with carrier frequency $f_{\rm T}$ it holds that:
- $$s(t) = a(t) \cdot \cos(\omega_{\rm T}\cdot t + \phi(t)) \hspace{0.3cm} \Leftrightarrow \hspace{0.3cm} s_{\rm TP}(t) = a(t) \cdot {\rm e}^{\hspace{0.03cm}{\rm j} \hspace{0.03cm} \cdot \hspace{0.05cm} \phi (t)}\hspace{0.05cm}.$$
The envelope $a(t)$ and the phase response $ϕ(t)$ of the (physical) band-pass signal $s(t)$ are also preserved in the equivalent low-pass signal $s_{\rm TP}(t)$.
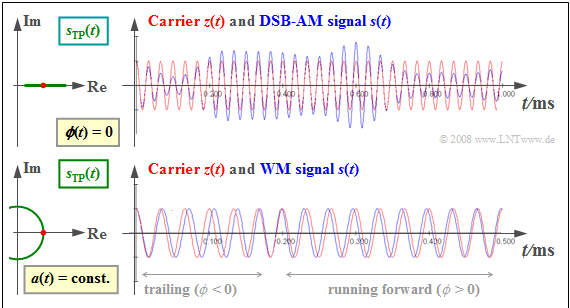
$\text{Example 3:}$ The graph shows the modulated signal $s(t)$ ⇒ red signal waveform, compared to the carrier signal $z(t)$ ⇒ blue signal waveform.
Shown on the left are the respective equivalent low-pass signals $s_{\rm TP}(t)$ ⇒ green locus.
Upper graph ⇒ »Amplitude modulation« $\rm (AM)$:
- Here, the source signal $q(t)$ can be seen in the envelope $a(t)$.
- Since the zero crossings of the carrier $z(t)$ stay the same: $ϕ(t) = 0$. The equivalent low-pass signal $s_{\rm TP}(t) = a(t)$ is real.
- The derivation of this fact takes place in chapter "Description using the equivalent low-pass signal".
Bottom graph ⇒ »Angle modulation« $\rm (WM)$:
- Here, the envelope $a(t)$ is constant ⇒ the equivalent low-pass signal $s_{\rm TP}(t) = A_{\rm T} · e^{\rm j·ϕ(t)}$ describes a circular arc.
- The information about the source signal $q(t)$ is found here in the location of the zero crossings $s(t)$.
- More details about this modulation method can be found in the chapter "Similarities between phase and frequency modulation".
$\text{Notes:}$
- In the following, we also refer to the time-dependent course of $s_{\rm TP}(t)$ in the complex plane as the »locus curve«.
- The »pointer diagram« describes the course of the analytical signal $s_+(t)$.
- The topic presented here is illustrated in the time domain with two interactive "HTML 5/JS" applets:
Exercises for the chapter
Exercise 1.4: Pointer diagram and locus curve
Exercise 1.4Z: Representation of Oscillations
