Difference between revisions of "Modulation Methods/Envelope Demodulation"
| (103 intermediate revisions by 6 users not shown) | |||
| Line 1: | Line 1: | ||
{{Header | {{Header | ||
| − | |Untermenü= | + | |Untermenü=Amplitude Modulation and Demodulation |
| − | |Vorherige Seite= | + | |Vorherige Seite=Synchronous Demodulation |
| − | |Nächste Seite= | + | |Nächste Seite=Single-Sideband Modulation |
}} | }} | ||
| − | == | + | ==Functionality under ideal conditions== |
<br> | <br> | ||
| − | + | We first assume the following conditions: | |
| − | * | + | *Let the source signal $q(t)$ be free of a DC component and limited in magnitude to $q_{\rm max}$. |
| − | * | + | |
| + | *The transmission is based on the modulation method "DSB–AM with carrier". | ||
| + | |||
| + | *For simplicity of representation, the carrier phase is set to $\mathbf{ϕ_{\rm T} } = 0$ without restricting generality: | ||
:$$s(t) = \left(q(t) + A_{\rm T}\right) \cdot \cos (\omega_{\rm T}\cdot t )\hspace{0.05cm}.$$ | :$$s(t) = \left(q(t) + A_{\rm T}\right) \cdot \cos (\omega_{\rm T}\cdot t )\hspace{0.05cm}.$$ | ||
| − | * | + | |
| − | * | + | *Let the modulation depth be $m ≤ 1$. Therefore, from the definition $m = q_{\rm max}/A_{\rm T}$ it also follows that $q(t) + A_{\rm T} ≥ 0$. |
| − | :$$r(t) = s(t) = a(t) \cdot \cos (\omega_{\rm T}\cdot t )\hspace{0.05cm} | + | |
| − | *In | + | *Let the channel be ideal, that is, there is no distortion, no attenuation, no delay, no interference, and no noise. |
| + | |||
| + | *Thus, when $H_{\rm K}(f) = 1$ and $n(t) \equiv 0$ we get for the received signal: | ||
| + | :$$r(t) = s(t) = a(t) \cdot \cos (\omega_{\rm T}\cdot t )\hspace{0.05cm}$$ | ||
| + | |||
| + | *In this equation, $a(t)$ describes the »'''envelope'''« of the received signal $r(t)$. The phase function is $\mathbf{ϕ}(t) = 0$. | ||
{{BlaueBox|TEXT= | {{BlaueBox|TEXT= | ||
| − | $\text{Definition:}$ | + | $\text{Definition:}$ An »'''envelope demodulator'''« detects the envelope $a(t)$ of its input signal $r(t)$ and outputs the sink signal after eliminating the DC component $A_{\rm T}$: |
| − | $$v(t) = a(t) - A_{\rm T}\hspace{0.05cm}.$$ | + | :$$v(t) = a(t) - A_{\rm T}\hspace{0.05cm}.$$ |
| − | + | The removal of the DC component $A_{\rm T}$ can be realized, for example, by a high-pass filter that allows all frequencies to pass unimpeded except for $f = 0$ .}} | |
| − | + | *If all the above conditions are met, then $v(t) = q(t)$ holds. | |
| + | |||
| + | *This means that an ideal communication system can certainly be realized with an (ideal) envelope demodulator. | ||
| + | |||
| + | [[File:P_ID1019__Mod_T_2_3_S1_neu.png|right|frame|Signal waveforms illustrating envelope demodulation]] | ||
{{GraueBox|TEXT= | {{GraueBox|TEXT= | ||
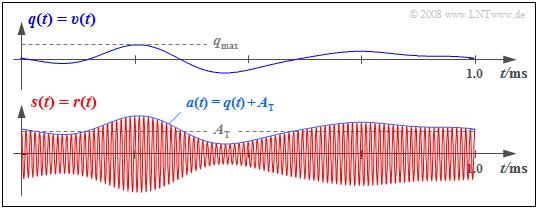
| − | $\text{ | + | $\text{Example 1:}$ In the graph, the received signal $r(t) = s(t)$ is shown below, and is based on "DSB–AM with carrier” $($modulation depth $m = 0.5)$. |
| + | *The envelope $a(t)$ to be evaluated by the envelope demodulator is equal to the sum of the source signal $q(t)$ and the DC component $A_{\rm T}$ added at the transmitter. | ||
| − | + | *$v(t) = q(t)$ holds for the demodulator output signal after removing the DC component $A_{\rm T}$ with a high-pass filter, assuming that the source signal $q(t)$ did not include a DC component. Such a DC component would (wrongly) also be removed by the high-pass filter.}} | |
| − | |||
| + | ==Realizing an envelope demodulator== | ||
| + | [[File: EN_Mod_T_2_3_S2.png|right|frame|Principle of envelope demodulation in the time domain]] | ||
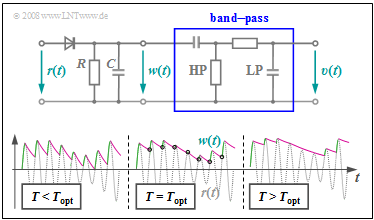
| + | The adjacent graph shows: | ||
| + | *above, a simple possible realization of the envelope demodulator, | ||
| − | + | *below, the signals $r(t)$ and $w(t)$ to illustrate the principle. | |
| − | |||
| − | |||
| − | * | ||
| − | |||
| − | + | First, consider the middle signal section denoted by $T = T_{\rm opt}$. | |
| − | + | The first circuit section – consisting of a diode and a parallel connection of a resistor $R$ and a capacitance $C$ – performs the following tasks: | |
| − | * | + | *If the (light) gray signal $r(t)$ is larger than the voltage $w(t)$ at $R$ and $C$, the diode conducts, $w(t) = r(t)$ holds, and the capacitance $C$ is charged. In these regions, $w(t)$ is drawn in green. |
| − | * | + | |
| − | * | + | *If $r(t) < w(t)$, as is the case at the times marked in purple, the diode blocks and the capacitance discharges through resistor $R$. The signal $w(t)$ decays exponentially with time constant $T = R · C$. |
| + | |||
| + | *From the times marked with circles, $r(t) > w(t)$ holds again and the capacitance is recharged. It can be seen from the sketch that $w(t)$ matches "approximately" the envelope $a(t)$. | ||
{{BlaueBox|TEXT= | {{BlaueBox|TEXT= | ||
| − | $\text{Design | + | $\text{Design criteria:}$ |
| − | * | + | *The deviations between the envelope approximation $w(t)$ and its nominal function $a(t)$ decrease the larger the carrier frequency $f_{\rm T}$ is compared to the bandwidth $B_{\rm NF}$ of the low frequency message signal. As a guideline, $f_{\rm T} ≥ 100 · B_{\rm NF}$ is often given. |
| − | :$$1/f_{\rm T}\hspace{0.1cm} \ll \hspace{0.1cm} T \hspace{0.1cm} \ll \hspace{0.1cm} 1/B_{\rm NF} \hspace{0.05cm}, | + | |
| − | * | + | *At the same time, the time constant $T$ of the RC parallel resonant circuit should always be much larger than $1/f_{\rm T}$ and much smaller than $1/B_{\rm NF}$: |
| − | * | + | :$$1/f_{\rm T}\hspace{0.1cm} \ll \hspace{0.1cm} T \hspace{0.1cm} \ll \hspace{0.1cm} 1/B_{\rm NF} \hspace{0.05cm}, $$ |
| + | |||
| + | *A good compromise is the geometric mean between the two limits: | ||
| + | :$$ T_{\rm opt} = {1}/{\sqrt{f_{\rm T} \cdot B_{\rm NF} } } \hspace{0.05cm}.$$ | ||
| + | |||
| + | *If the time constant $T$ is too small, as in the left area of the sketch above, the capacitor will always discharge too quickly and the deviation $w(t) \ – \ a(t)$ will be unnecessarily large. | ||
| + | |||
| + | *Also, a too large value $T > T_{\rm opt}$ will result in deterioration, as shown in the right signal detail. In this case, $w(t)$ can no longer follow the envelope $a(t)$.}} | ||
{{GraueBox|TEXT= | {{GraueBox|TEXT= | ||
| − | $\text{ | + | $\text{Example 2:}$ For a low frquency bandwidth of $B_{\rm NF} = 5 \ \rm kHz$, the carrier frequency should be at least $f_{\rm T} = 500 \ \rm kHz$ . |
| − | + | *The time constant $T$ must be much larger than $1/f_{\rm T} = 2 \ \rm µ s$ and at the same time much smaller than $1/B_{\rm NF} = 200 \ \rm µ s $. | |
| + | *The optimal value according to the compromise formula is thus: | ||
| + | :$$T_{\rm opt} = 1/\sqrt{ 5 \cdot 10^5 \ {\rm Hz} \cdot 5 \cdot 10^3 \ {\rm Hz} } = 20 \ \rm µ s \hspace{0.05cm}.$$ }} | ||
| − | |||
| − | |||
| − | |||
| − | |||
| − | |||
| + | [[File:EN_Mod_T_2_3_S2b.png|right|frame|Frequency domain representation of an envelope demodulator]] | ||
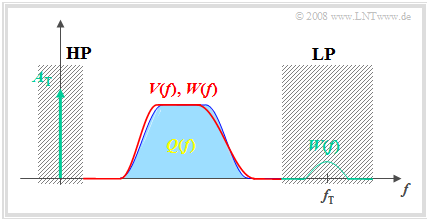
| + | The graph on the right is intended to illustrate the operation of the envelope demodulator in the frequency domain. The spectrum $W(f)$ of the signal $w(t)$ at the RC parallel circuit differs from the spectrum $Q(f)$ of the source signal as follows: | ||
| + | *Due to the carrier signal $z(t)$ added at the transmitter, the spectral function $W(f)$ includes a Dirac delta line at $f = 0$ with weight $A_{\rm T}$ (carrier amplitude). | ||
| + | * $W(f)$ also exhibits spectral components in the region around the carrier frequency $f_{\rm T}$, which can be explained by the jagged time course of $w(t)$ (see the first graph in this section). | ||
| − | + | * $W(f)$ also differs only slightly from $Q(f)$ in the low frequency domain. Here, the error gets smaller as the carrier frequency increases compared to the bandwidth $B_{\rm NF}$. | |
| + | <br clear=all> | ||
| + | The first two signal distortions are eliminated by the high-pass and low-pass filters, which together produce a band-pass. However, there also remains a slight deviation between the sink signal $v(t)$ and the source signal $q(t)$ in the interesting range $0 < f < B_{\rm NF}$, as shown by comparing the output spectrum $V(f)$ plotted in red and the input spectrum $Q(f)$ plotted in blue. | ||
| − | == | + | |
| + | ==Why does envelope demodulation fail for $m > 1$?== | ||
<br> | <br> | ||
| − | |||
| − | |||
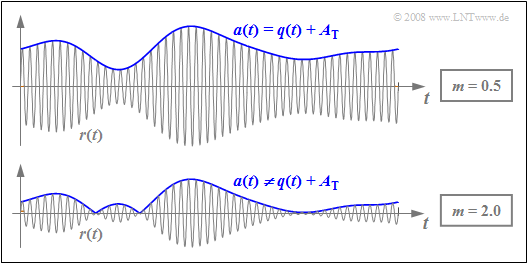
| − | + | The graph shows the DSB-AM signals for $m = 0.5$ and $m = 2$. From this picture one can recognize the following differences: | |
| − | :$$ | + | [[File:Mod_T_2_3_S3_version2.png|right|frame|Envelope demodulation when $m < 1$ (above) and $m > 1$ (below)]] |
| − | |||
| − | + | * For a modulation depth $m ≤ 1$ the envelope of the band-pass signal is characterized by: | |
| − | :$$a(t) = | + | ::$$a(t) = q(t) + A_{\rm T}\hspace{0.05cm}.$$ |
| − | + | :Here, an ideal demodulation ⇒ $v(t) = q(t)$ is possible with an envelope demodulator, if we ignore unavoidable noise. | |
| − | |||
| − | |||
| − | |||
| − | == | + | * In contrast, with $m > 1$ the following relationship holds: |
| + | ::$$a(t) = |q(t) + A_{\rm T} |\hspace{0.05cm}.$$ | ||
| + | #Here, envelope demodulation always leads to [[Linear_and_Time_Invariant_Systems/Nonlinear_Distortions|$\text{nonlinear distortions}$]]. | ||
| + | #The sink signal $v(t)$ now includes new frequencies, which were not present in $q(t)$. | ||
| + | #For the DC component (expected value) of the envelope, in this case it holds that: <br> ${\rm E}[a(t)] \ne A_{\rm T}\hspace{0.05cm}.$ | ||
| + | #Since now instead of $A_{\rm T}$ this DC component ${\rm E}[a(t)]$ is removed by the high-pass filter, an additional level shift occurs. | ||
| + | |||
| + | ==Description using the equivalent low-pass signal== | ||
<br> | <br> | ||
| − | + | Especially when the source signal $q(t)$ can be represented as a sum of several harmonic oscillations, a signal description with the equivalent low-pass signal ${r_{\rm TP}(t)}$ is extremely advantageous. This is described in detail in the book [[Signal_Representation/Equivalent_Low-Pass_Signal_and_its_Spectral_Function|"Signal Representation"]]. | |
{{BlaueBox|TEXT= | {{BlaueBox|TEXT= | ||
| − | + | $\text{Please note:}$ If noise/interference is disregarded, the »'''received signal'''« can be written as: | |
:$$r(t) = a(t) \cdot \cos (\omega_{\rm T}\cdot t + \phi(t))\hspace{0.05cm}.$$}} | :$$r(t) = a(t) \cdot \cos (\omega_{\rm T}\cdot t + \phi(t))\hspace{0.05cm}.$$}} | ||
| − | + | This equation is valid for any form of amplitude modulation under different boundary conditions: | |
| − | * | + | *Double sideband (DSB) or single sideband (SSB), |
| − | * | + | |
| − | * | + | *with or without a carrier, |
| + | |||
| + | *ideal channel or linear distorting channel. | ||
{{BlaueBox|TEXT= | {{BlaueBox|TEXT= | ||
| − | + | $\text{In general}$: The associated »'''equivalent low-pass signal'''« (German: "äquivalentes Tiefpass–Signal" ⇒ subscript "TP") is complex and given as: | |
| − | :$$r_{\rm TP}(t) = a(t) \cdot {\rm e}^{\hspace{0.03cm}{\rm j} \cdot \hspace{0.05cm} \phi(t)}\hspace{0.05cm}.$$ | + | :$$r_{\rm TP}(t) = a(t) \cdot {\rm e}^{\hspace{0.03cm}{\rm j} \hspace{0.05cm} \cdot \hspace{0.05cm} \phi(t)}\hspace{0.05cm}.$$ |
| − | + | The time functions $a(t)$ and $ϕ(t)$ contained in the equations are identical for both representations: | |
| − | * $a(t)$ | + | * The function $a(t)$ describes the »'''envelope'''« (time-dependent amplitude) of the physical signal $r(t)$ and the magnitude $\vert r_{\rm TP}(t) \vert $ of the equivalent low-pass signal, respectively. This is detected during envelope demodulation. |
| − | |||
| + | * The function $ϕ(t)$ is the »'''time-dependent phase'''«. This function contains all information about the position of the zero crossings of $r(t)$ and indicates whether an additional phase modulation is effective.}} | ||
| − | + | ||
| − | * | + | In the case of double sideband amplitude modulation $\text{(DSB-AM)}$, the following holds for an ideal channel: |
| − | * | + | *The »'''locality curve'''« or »'''locus curve'''« – by this we mean the time-dependent representation of the signal $r_{\rm TP}(t)$ in the complex plane – is a horizontal straight line on the real axis. |
| − | * | + | |
| + | *It further follows that the phase function can take only two values: $0$ and $π$ $(180^\circ)$ . | ||
| + | :*When $m ≤ 1$, then $ϕ(t) ≡ 0$ and the envelope demodulation can be applied without distortion. | ||
| + | :*When $m > 1$, a section of the locus curve lies in the left half-plane ⇒ nonlinear distortions arise when envelope demodulation is applied. | ||
{{GraueBox|TEXT= | {{GraueBox|TEXT= | ||
| − | $\text{ | + | $\text{Example 3:}$ We assume that the source signal $q(t)$ can take on all values in the range $±1\ \rm V$. |
| + | [[File: P_ID1023__Mod_T_2_3_S4_neu.png|right|frame|Locus curves illustrating envelope demodulation]] | ||
| + | *Adding a DC component of $A_{\rm T} = 2\ \rm V$ results in a DSB-AM with modulation depth $m = 0.5$, whose locus curve can be seen in the left graph. | ||
| + | |||
| + | *$r_{\rm TP}(t)$ always lies in the right half-plane. The pointer length changes with the source signal $q(t)$. | ||
| + | |||
| − | + | The right-hand graph holds for $A_{\rm T} = 0.5 \ \rm V$ ⇒ $m = 2$. | |
| + | * $r_{\rm TP}(t)$ now takes on real values between $-0.5\ \rm V$ and $1.5\ \rm V$. | ||
| + | |||
| + | *The envelope demodulator cannot distinguish between positive and negative values ⇒ nonlinear distortions occur. | ||
| − | |||
| − | + | The physical signals $q(t)$, $r(t)$ and $v(t)$ corresponding to this example can be found in the graph in the [[Modulation_Methods/Envelope_Demodulation#Why_does_envelope_demodulation_fail_for_.7F.27.22.60UNIQ-MathJax104-QINU.60.22.27.7F.3F|"previous section"]].}} | |
| − | == | + | ==Special case of a cosine-shaped message signal== |
<br> | <br> | ||
| − | + | To quantitatively capture the nonlinear distortions due to a modulation depth $m> 1$, we assume the following scenario: | |
| − | |||
| − | |||
| − | |||
| − | |||
| − | |||
| − | |||
| + | *cosine-shaped source signal: $q(t) = A_{\rm N} \cdot \cos(\omega_{\rm N} \cdot t);$ | ||
| − | + | *DSB–AM with carrier: $s(t) = \left ( q(t) + A_{\rm T} \right ) \hspace{-0.05cm}\cdot \hspace{-0.05cm}\cos(\omega_{\rm N} \hspace{-0.05cm}\cdot \hspace{-0.05cm}t),$ $r(t) = s(t);$ | |
| − | |||
| − | |||
| − | |||
| + | *modulation depth: $m = A_{\rm N}/A_{\rm T} = 1.25;$ | ||
| − | + | *ideal envelope demodulation: $a(t) = {| q(t) + A_{\rm T}|} $ | |
| − | * | + | |
| − | * | + | *elimination of the DC component by a low-pass: $r(t) = a(t) - {\rm E}\big[a(t)\big].$ |
| − | * | + | |
| − | * | + | |
| − | * | + | The graph is valid for the signal parameters $A_{\rm N} = 5 \ \rm V$, $f_{\rm N} = 2 \ \rm kHz$, $A_{\rm T} = 4 \ \rm V$ and $f_{\rm T} = 100\ \rm kHz$. It shows |
| + | *above, the sink signal $v(t)$ compared to the source signal $q(t)$, | ||
| + | |||
| + | *in the middle, the received signal $r(t)$ as well as the envelope curve $a(t) = {|r(t)|}$, | ||
| + | |||
| + | *below, the error signal $ε(t) = v(t) \ – \ q(t)$ due to nonlinear distortions. | ||
| + | |||
| + | |||
| + | Based on the graphs, the following statements can be made: | ||
| + | [[File: P_ID2960__Mod_T_2_3_S5_neu.png |right|frame| Error signal $ε(t)$ for envelope demodulation]] | ||
| + | *A comparison of the signals $q(t)$ and $a(t)$ reveals, that in this example the envelope $a(t)$ correctly reproduces the shape of the source signal $q(t)$ in around $80\%$ of the time. | ||
| + | |||
| + | *However, the maximum of the envelope $a(t)$ is noticeably larger than the maximum of the source signal $q(t)$ due to the added carrier $A_{\rm T}$. | ||
| + | |||
| + | *The sink signal $v(t)$ differs from the envelope curve $a(t)$ by the expected value ${\rm Ε}\big[a(t)\big]$, which is removed by the low-pass of the envelope demodulator. | ||
| + | |||
| + | *Since ${\rm Ε}\big[a(t)\big] = 4.27 \ \rm V$ does not match $A_{\rm T} = 4 \ \rm V$, $v(t)$ differs from $q(t)$ by the constant value $0.27 \ \rm V$, also in the regions where $a(t)$ is correctly detected. | ||
| + | |||
| + | *The cosine source signal $q(t)$ becomes a signal $v(t)$ with harmonics: | ||
:$$v(t) = A_{\rm 1} \cdot \cos(\omega_{\rm N} t ) +A_{\rm 2} \cdot \cos(2\omega_{\rm N} t | :$$v(t) = A_{\rm 1} \cdot \cos(\omega_{\rm N} t ) +A_{\rm 2} \cdot \cos(2\omega_{\rm N} t | ||
)+A_{\rm 3} \cdot \cos(3\omega_{\rm N} t )+ \text{...}$$ | )+A_{\rm 3} \cdot \cos(3\omega_{\rm N} t )+ \text{...}$$ | ||
:$$\Rightarrow \hspace{0.3cm}A_{\rm 1} = 4.48\,{\rm V},\hspace{0.3cm}A_{\rm 2} = 0.46\,{\rm V},\hspace{0.3cm}A_{\rm 3} = -0.37\,{\rm V},\hspace{0.3cm} | :$$\Rightarrow \hspace{0.3cm}A_{\rm 1} = 4.48\,{\rm V},\hspace{0.3cm}A_{\rm 2} = 0.46\,{\rm V},\hspace{0.3cm}A_{\rm 3} = -0.37\,{\rm V},\hspace{0.3cm} | ||
A_{\rm 4} = 0.26\,{\rm V},\hspace{0.1cm}\text{...}$$ | A_{\rm 4} = 0.26\,{\rm V},\hspace{0.1cm}\text{...}$$ | ||
| − | * | + | |
| − | :$$K_2 ={|A_{\rm 2}|}/{A_{\rm 1}} = 0.102 | + | *Thus, according to the details in the book [[Linear_and_Time_Invariant_Systems/Nonlinear_Distortions#The_distortion_factor|"Linear and Time Invariant Systems"]], we obtain for the individual distortion factors as well as the total distortion factor: |
| − | {|A_{\rm 3}|}/{A_{\rm 1}} = 0.082,\hspace{0.3cm}K_4 = | + | :$$K_2 ={|A_{\rm 2}|}/{A_{\rm 1}} = 0.102\hspace{0.3cm}K_3 ={|A_{\rm 3}|}/{A_{\rm 1}} = 0.082,\hspace{0.3cm}K_4 = {|A_{\rm 4}|}/{A_{\rm 1}} = 0.058,\hspace{0.1cm}\text{...}$$ |
| − | {|A_{\rm 4}|}/{A_{\rm 1}} = 0.058,\hspace{0.1cm}\text{...}$$ | ||
:$$\Rightarrow \hspace{0.3cm}K = \sqrt{K_2^2 + K_3^2 + K_4^2 +\text{...} } \approx 15 \%.$$ | :$$\Rightarrow \hspace{0.3cm}K = \sqrt{K_2^2 + K_3^2 + K_4^2 +\text{...} } \approx 15 \%.$$ | ||
| − | + | *In the chapter [[Modulation_Methods/Quality_Criteria#Investigations_with_regard_to_signal_distortions|"Quality Criteria"]] it was shown, that this also fixes the SNR at $ρ_v = 1/K^2 ≈ 44$ . | |
| + | |||
| + | *The SNR $ρ_v$ $($but not $K)$ can also be used as a quality criterion if $q(t)$ contains more than one frequency ⇒ derivation in the book [[Linear_and_Time_Invariant_Systems/Nonlinear_Distortions#The_distortion_factor|"Linear and Time Invariant Systems"]]. | ||
| − | == | + | ==Considering channel distortions== |
<br> | <br> | ||
| − | + | For the following considerations, we assume the modulation method "DSB-AM with carrier" as well as a cosine-shaped source signal $q(t)$ . | |
| + | *Let the amplitudes of the source and carrier signals be $A_{\rm N} = 4 \ \rm V$ and $A_{\rm T} = 5 \ \rm V $, resp. ⇒ modulation depth $m = 0.8$. | ||
| − | + | *Thus (ideal) envelope demodulation is applicable in principle. | |
| − | * | ||
| − | |||
| − | |||
| + | [[File: P_ID1028__Mod_T_2_3_S7_neu.png |right|frame|Spectra and signals illustrating envelope demodulation]] | ||
| + | <br>The graph shows, in descending order | ||
| + | *the spectra $S_{\rm TP}(f)$ and $R_{\rm TP}(f)$ of the equivalent low-pass signals, which are assumed to be real, | ||
| − | + | *the equivalent low-pass signals $s_{\rm TP}(t)$ and $r_{\rm TP}(t)$ in the complex plane, and lastly | |
| + | |||
| + | *the physical signals $s(t)$ and $r(t)$. | ||
| − | |||
| − | |||
| + | The left half of the image shows the transmitter and at the same time gives the conditions at the receiver for an ideal channel. | ||
| + | #Due to the modulation depth $m ≤ 1$, the source signal $q(t)$ can be recognized in the envelope $a(t)$. | ||
| + | #Consequently, envelope demodulation is applicable without distortion under certain conditions, as shown in $\text{Example 4}$. | ||
| − | + | ||
| + | The right half considers asymmetrical distortions through the channel. | ||
| + | #Here the carrier is attenuated by $α_{\rm T} = 0.8$, and the upper sideband by $α_{\rm O} = 0.5$. | ||
| + | #Now the envelope $a(t) ≠ q(t) + A_{\rm T}$ is no longer cosine-shaped. | ||
| + | #Here, envelope demodulation leads to nonlinear distortions as shown in $\text{Example 5}$. | ||
| + | <br clear=all> | ||
{{GraueBox|TEXT= | {{GraueBox|TEXT= | ||
| − | $\text{ | + | $\text{Example 4:}$ Let $A_{\rm N} = 4 \ \rm V$ and $A_{\rm T} = 5 \rm V$ continue to hold ⇒ modulation depth $m = 0.8$. The graph illustrates the use of an ideal envelope demodulator with an ideal channel, whereby the following identities are considered: |
| − | + | [[File:Mod_T_2_3_S7a_version2.png|right|frame|Envelope demodulation with an ideal channel]] | |
| − | + | :$$R_{\rm TP}(f) \hspace{-0.05cm}=\hspace{-0.05cm} S_{\rm TP}(f) \hspace{0.02cm}, \hspace{0.5cm} | |
| − | :$$R_{\rm TP}(f) \hspace{-0.05cm}=\hspace{-0.05cm} S_{\rm TP}(f) \hspace{0.02cm}, \hspace{0. | + | r_{\rm TP}(t) \hspace{-0.05cm}=\hspace{-0.05cm} s_{\rm TP}(t) \hspace{0.02cm}, \hspace{0.5cm} |
| − | r_{\rm TP}(t) \hspace{-0.05cm}=\hspace{-0.05cm} s_{\rm TP}(t) \hspace{0.02cm}, \hspace{0. | ||
r(t) \hspace{-0.05cm}=\hspace{-0.05cm} s(t) \hspace{0.02cm}.$$ | r(t) \hspace{-0.05cm}=\hspace{-0.05cm} s(t) \hspace{0.02cm}.$$ | ||
| − | + | From these representations one can recognize: | |
| − | + | #The red pointer of length $A_{\rm T}$ depicting the carrier is fixed. | |
| − | + | #The upper sideband (in blue) rotates in mathematically positive direction, the lower sideband (in green) in the opposite direction. | |
| − | + | #Since the blue and green pointers both rotate with the same angular velocity $ω_{\rm N}$ but in opposite directions, the vector sum of all pointers is always real. | |
| − | + | #Should the modulation depth $m ≤ 1$, then at all times $r_{\rm TP}(t) ≥ 0$ and $ϕ(t) = 0$. This means, that the zero crossings of the received signal $r(t)$ exactly coincide with those of the carrier signal $z(t)$. | |
| − | + | # The envelope $a(t)$ of the physical signal $r(t)$ is equal to the resulting pointer length, i.e., equal to the magnitude of $r_{\rm TP}(t)$. Because $m< 1$ , $a(t) = q(t) + A_{\rm T}$ holds. | |
| − | + | #For the given amplitude values, the locus curve $r_{\rm TP}(t)$ lies on the real axis between the end-points $A_{\rm T} \ – \ A_{\rm N} = 1\ \rm V$ and $A_{\rm T} + A_{\rm N} = 9 \ \rm V$. | |
| + | #The locus curve on the real axis in the right half-plane is an indicator that the message signal can be extracted without distortion by an envelope demodulator.}} | ||
| − | |||
{{GraueBox|TEXT= | {{GraueBox|TEXT= | ||
| − | $\text{ | + | $\text{Example 5:}$ Now let us consider the same graphs for a distorting channel where |
| − | *$α_{\rm U} = 1$ ⇒ | + | *$α_{\rm U} = 1.0$ ⇒ the lower sideband (German: "unteres Seitenband" ⇒ subscript "U") is unchanged, |
| − | |||
| − | |||
| + | *$α_{\rm T} = 0.8$ ⇒ the carrier (German: "Träger" ⇒ subscript "T") is slightly attenuated, | ||
| − | + | * $α_{\rm U} = 0.5$ ⇒ the upper sideband (German: "oberes Seitenband" ⇒ subscript "O") is attenuated more. | |
| − | + | ||
| − | + | [[File:Mod_T_2_3_S7b_version2.png|right|frame|Envelope demodulation with a distorting channel]] | |
| − | + | <br> | |
| − | + | The graphs can then be interpreted as follows: | |
| − | + | #Due to the different lengths of the green pointer $\rm (USB)$ and blue pointer $\rm (OSB)$, the locus curve becomes an ellipse, whose center is fixed by the (red) carrier. | |
| − | )+A_{\rm 3} \cdot \cos(3\omega_{\rm N} \cdot t )+ \text{...}$ | + | #The angle between the complex-valued $r_{\rm TP}(t)$ and the coordinate origin is now no longer continuous $ϕ(t) \equiv 0$, but instead fluctuates between $±ϕ_{\rm max}.$ |
| − | + | #The maximal phase is equal to the angle of the tangent to the ellipse. In the physical signal, $ϕ(t) ≠ 0$ leads to shifts of the zero crossings of $r(t)$ with respect to its nominal positions – as given by the carrier signal $z(t)$. | |
| − | <br> | + | #The magnitude $a(t) = \vert r_{\rm TP}(t) \vert$ – i.e., the envelope of $r(t)$ – is thus no longer cosine-shaped, and the signal after the envelope demodulator contains harmonics in addition to the frequency $f_{\rm N}$: <br> $v(t) = A_{\rm 1} \cdot \cos(\omega_{\rm N}\cdot t ) +A_{\rm 2} \cdot \cos(2\omega_{\rm N}\cdot t |
| + | )+A_{\rm 3} \cdot \cos(3\omega_{\rm N} \cdot t )+ \text{...}$<br> | ||
| + | #These lead to nonlinear distortions, which are captured by the distortion factor $K$ . <br>When $A_{\rm N} = 4 \ \rm V$, $A_{\rm T} = 5 \ \rm V$, $α_{\rm U} = 1$ and $α_{\rm T} = 0.8$, the following numerical values are obtained as a function of the upper sideband $α_{\rm O}$: | ||
| − | : $α_{\rm O} = 1.00$: $K = 0$ ⇒ | + | ::: $α_{\rm O} = 1.00$: $K = 0$ ⇒ only the carrier is attenuated, |
| − | : $α_{\rm O} = 0.75$: $K ≈ 0.4\%$, | + | ::: $α_{\rm O} = 0.75$: $K ≈ 0.4\%$, |
| − | : $α_{\rm O} = 0.50$: $K ≈ 1.5\%$ ⇒ | + | ::: $α_{\rm O} = 0.50$: $K ≈ 1.5\%$ ⇒ this value is used as a basis for the graph, |
| − | : $α_{\rm O} = 0.25$: $K ≈ 4\%$, | + | ::: $α_{\rm O} = 0.25$: $K ≈ 4\%$, |
| − | : $α_{\rm O} = 0.00$: $K ≈ 10\%$ ⇒ | + | ::: $α_{\rm O} = 0.00$: $K ≈ 10\%$ ⇒ complete suppression of $\rm OSB$. |
| + | This graph is valid for $α_{\rm O} = 0.5$, in which case we obtain (although difficult to see with the naked eye): | ||
| + | *shifts in the zero crossings of the signal $r(t)$ by at most $25^\circ\hspace{-0.05cm}/360^\circ ≈ 7\%$ of the carrier period $T_0$, and | ||
| + | |||
| + | * deviation from the ideal cosine shape ⇒ $K ≈ 1.5\%$ . }} | ||
| − | |||
| − | |||
| − | |||
| + | ==Symmetrical channel distortions - attenuation distortions== | ||
| + | <br> | ||
| + | An important result of the last section was that nonlinear signal distortions occur in the case of asymmetric linear distortions in the channel. | ||
| + | *If, on the other hand, the lower sideband is attenuated in the same way as the upper sideband, the locus curve is once again a horizontal straight line and no nonlinear distortions occur. | ||
| + | |||
| + | *Rather, the distortions with respect to $q(t)$ and $v(t)$ – as well as the distortions with respect to $s(t)$ and $r(t)$ – are linear in this case, and can be corrected for by a suitably dimensioned filter. | ||
| − | |||
| − | |||
| − | |||
| − | + | We now assume the following: | |
| − | * | + | *A source signal $q(t)$ – composed of two cosine components at the frequencies $f_1$ and $f_2$ with amplitudes $A_1$ and $A_2$. |
| − | * | + | |
| − | * | + | *DSB–AM with carrier ⇒ the transmitted signal $s(t)$ is composed of a total of five cosine oscillations at the frequencies $f_{\rm T}, f_{\rm T} ± f_1$ and $f_{\rm T} ± f_2$. |
| + | [[File:Mod_T_2_3_S6_version2.png|right|frame|Spectra in the equivalent low-pass region]] | ||
| + | *A channel with attenuation distortions, symmetrical about the carrier frequency: | ||
:$$H_{\rm K} (f = f_{\rm T})= \alpha_0, \hspace{0.3cm} H_{\rm K} (f | :$$H_{\rm K} (f = f_{\rm T})= \alpha_0, \hspace{0.3cm} H_{\rm K} (f | ||
= \pm f_{\rm 1})= \alpha_1, \hspace{0.3cm}H_{\rm K} (f = \pm | = \pm f_{\rm 1})= \alpha_1, \hspace{0.3cm}H_{\rm K} (f = \pm | ||
f_{\rm 2})= \alpha_2;$$ | f_{\rm 2})= \alpha_2;$$ | ||
| − | * | + | |
| + | *An ideal envelope demodulator as described in this section. | ||
| − | + | The graphic shows the spectral function of the equivalent low-pass signals of the transmitted signal and the received signal. From this picture, the following statements can be made: | |
| − | + | #The equivalent low-pass signal $r_{\rm TP}(t)$ is real. The locus curve – i.e., the peak of the pointer composite in the complex plane – again also lies on the real axis. | |
| − | + | #Should $α_0 · A_{\rm T}$ be greater than $α_1 · A_1 + α_2 · A_2$, then the "modulation depth of the received signal" is less than $1$ and nonlinear distortions do not occur. | |
| − | + | #The sink signal after ideal envelope demodulation and elimination of the DC component $α_0 · A_{\rm T}$ by the downstream high-pass filter is: | |
| − | + | ::$$v(t) = \alpha_1 \cdot A_{\rm 1} \cdot \cos(2 \pi f_{\rm 1} t ) + | |
| − | :$$v(t) = \alpha_1 \cdot A_{\rm 1} \cdot \cos(2 \pi f_{\rm 1} t ) + | ||
\alpha_2 \cdot A_{\rm 2} \cdot \cos(2 \pi f_{\rm 2} t ) \hspace{0.05cm}.$$ | \alpha_2 \cdot A_{\rm 2} \cdot \cos(2 \pi f_{\rm 2} t ) \hspace{0.05cm}.$$ | ||
| − | * | + | This means: |
| + | *'''Linear distortions (attenuation distortions) occur when $α_2 ≠ α_1$ . | ||
| + | |||
| + | *'''If the symmetry with respect to $f_{\rm T}$ were not present, nonlinear distortions would arise'''. | ||
| − | + | ⇒ We refer you to the (German language) learning video [[Lineare_und_nichtlineare_Verzerrungen_(Lernvideo)|"Lineare und nichtlineare Verzerrungen"]] ⇒ "Linear and nonlinear distortions". | |
| − | == | + | ==Influence of additive white Gaussian noise== |
<br> | <br> | ||
| − | + | Based on the system configuration | |
| − | + | *DSB–AM with modulation depth $m ≤ 1$, and | |
| − | + | ||
| − | * | + | *the best-fitting envelope demodulation |
| − | |||
| − | |||
| + | we can now estimate the influence of additive white Gaussian noise. Distortions of any kind – for example caused by an unsuitable channel or an imperfect realization of the modulator and demodulator – are ruled out. | ||
| − | + | The graph on the right shows the sink SNR $10 · \lg \, ρ_v$ for different modulation depths $m$ as a function of the logarithmic performance parameter: | |
| + | [[File: P_ID1031__Mod_T_2_3_S8_neu.png |right|frame| SNR for "DSB-AM with/without carrier" and envelope demodulation]] | ||
:$$10 \cdot {\rm lg }\hspace{0.1cm} \xi = 10 \cdot {\rm lg }\hspace{0.1cm} \frac{\alpha_{\rm K}^2 \cdot P_{\rm S}}{N_0 \cdot B_{\rm NF}} \hspace{0.05cm}.$$ | :$$10 \cdot {\rm lg }\hspace{0.1cm} \xi = 10 \cdot {\rm lg }\hspace{0.1cm} \frac{\alpha_{\rm K}^2 \cdot P_{\rm S}}{N_0 \cdot B_{\rm NF}} \hspace{0.05cm}.$$ | ||
| − | + | The result of the envelope demodulator $\rm (ED)$ is marked with solid lines, while the dotted lines represent the synchronous demodulator $\rm (SD)$. | |
| − | + | As already derived in the section [[Modulation_Methods/Quality_Criteria#Investigations_with_regard_to_signal_distortions|"Investigations with regard to signal distortions"]], the results for the synchronous demodulator in this double-logarithmic representation are | |
| − | * | + | *the angle bisector (for $m → ∞$, "DSB–AM without carrier"), and |
| − | * | + | |
| + | *a shifted line parallel to it for "DSB–AM with carrier", with a vertical distance of $10 · \lg \, (1 + 2/m^2$). | ||
| − | + | When envelope demodulation $\rm (ED)$ is applied, the following differences are observed: | |
| − | * | + | *An envelope demodulator is not useful when $m > 1$, because it would cause strong nonlinear distortions. |
| − | * | + | |
| − | * | + | *The $\rm ED$–curves always lie beneath the dashed $\rm SD$–lines, assuming the same modulation depth $m$. |
| + | |||
| + | *Above a certain $ξ$–value, the $\rm ED$– and the $\rm SD$–curves cannot be distinguished for the given degree of precision. | ||
| − | + | More information on this topic can be found e.g. in [Kam 04]<ref>Kammeyer, K.D.: Nachrichtenübertragung. Stuttgart: B.G. Teubner, 4. Auflage, 2004.</ref>. | |
| − | == | + | ==Arguments for and against the envelope demodulator== |
<br> | <br> | ||
| − | + | The most important reason for the use of the envelope demodulator is (better said: was) that it avoids the often laborious need for frequency and phase synchronization, so that it can be realized cheaply. The envelope demodulator is thus an example of an "incoherent demodulator". | |
| + | |||
| + | On the other hand, several reasons can be given in favour of the [[Modulation_Methods/Synchronous_Demodulation|$\text{synchronous demodulator}$]] and against the envelope demodulator: | ||
| + | *With envelope demodulation, an over-modulation $(m > 1)$ must be avoided under all circumstances. This can be achieved for example by limiting the amplitude of the source signal, though this also results in nonlinear distortions. | ||
| + | |||
| + | *All else being equal, the modulation depth $m < 1$ can only be achieved by increasing the transmitted power by at least a factor of $3$. This is also problematic because of justified discussions on the topic of "electronic smog" in large parts of our society. | ||
| − | + | *Linear channel distortions in the case of an envelope demodulator can lead to irreversible nonlinear channel distortions, whereas the linear distortions occurring during synchronous demodulation can possibly be compensated for by special measures taken at the receiver. | |
| − | * | ||
| − | |||
| − | |||
| − | == | + | ==Exercises for the chapter== |
<br> | <br> | ||
| − | [[Aufgaben: | + | [[Aufgaben:Exercise_2.7:_Is_the_Modulation_Depth_Too_High%3F|Exercise 2.7: Is the Modulation Depth Too High?]] |
| − | [[Aufgaben: | + | [[Aufgaben:Exercise_2.7Z:_DSB-AM_and_Envelope_Demodulator|Exercise 2.7Z: DSB-AM and Envelope Demodulator]] |
| − | [[Aufgaben: | + | [[Aufgaben:Exercise_2.8:_Asymmetrical_Channel|Exercise 2.8: Asymmetrical Channel]] |
| − | [[Aufgaben: | + | [[Aufgaben:Exercise_2.9:_Symmetrical_Distortions|Exercise 2.9: Symmetrical Distortions]] |
| − | == | + | ==References== |
<references/> | <references/> | ||
{{Display}} | {{Display}} | ||
Latest revision as of 10:44, 13 January 2023
Contents
- 1 Functionality under ideal conditions
- 2 Realizing an envelope demodulator
- 3 Why does envelope demodulation fail for $m > 1$?
- 4 Description using the equivalent low-pass signal
- 5 Special case of a cosine-shaped message signal
- 6 Considering channel distortions
- 7 Symmetrical channel distortions - attenuation distortions
- 8 Influence of additive white Gaussian noise
- 9 Arguments for and against the envelope demodulator
- 10 Exercises for the chapter
- 11 References
Functionality under ideal conditions
We first assume the following conditions:
- Let the source signal $q(t)$ be free of a DC component and limited in magnitude to $q_{\rm max}$.
- The transmission is based on the modulation method "DSB–AM with carrier".
- For simplicity of representation, the carrier phase is set to $\mathbf{ϕ_{\rm T} } = 0$ without restricting generality:
- $$s(t) = \left(q(t) + A_{\rm T}\right) \cdot \cos (\omega_{\rm T}\cdot t )\hspace{0.05cm}.$$
- Let the modulation depth be $m ≤ 1$. Therefore, from the definition $m = q_{\rm max}/A_{\rm T}$ it also follows that $q(t) + A_{\rm T} ≥ 0$.
- Let the channel be ideal, that is, there is no distortion, no attenuation, no delay, no interference, and no noise.
- Thus, when $H_{\rm K}(f) = 1$ and $n(t) \equiv 0$ we get for the received signal:
- $$r(t) = s(t) = a(t) \cdot \cos (\omega_{\rm T}\cdot t )\hspace{0.05cm}$$
- In this equation, $a(t)$ describes the »envelope« of the received signal $r(t)$. The phase function is $\mathbf{ϕ}(t) = 0$.
$\text{Definition:}$ An »envelope demodulator« detects the envelope $a(t)$ of its input signal $r(t)$ and outputs the sink signal after eliminating the DC component $A_{\rm T}$:
- $$v(t) = a(t) - A_{\rm T}\hspace{0.05cm}.$$
The removal of the DC component $A_{\rm T}$ can be realized, for example, by a high-pass filter that allows all frequencies to pass unimpeded except for $f = 0$ .
- If all the above conditions are met, then $v(t) = q(t)$ holds.
- This means that an ideal communication system can certainly be realized with an (ideal) envelope demodulator.
$\text{Example 1:}$ In the graph, the received signal $r(t) = s(t)$ is shown below, and is based on "DSB–AM with carrier” $($modulation depth $m = 0.5)$.
- The envelope $a(t)$ to be evaluated by the envelope demodulator is equal to the sum of the source signal $q(t)$ and the DC component $A_{\rm T}$ added at the transmitter.
- $v(t) = q(t)$ holds for the demodulator output signal after removing the DC component $A_{\rm T}$ with a high-pass filter, assuming that the source signal $q(t)$ did not include a DC component. Such a DC component would (wrongly) also be removed by the high-pass filter.
Realizing an envelope demodulator
The adjacent graph shows:
- above, a simple possible realization of the envelope demodulator,
- below, the signals $r(t)$ and $w(t)$ to illustrate the principle.
First, consider the middle signal section denoted by $T = T_{\rm opt}$.
The first circuit section – consisting of a diode and a parallel connection of a resistor $R$ and a capacitance $C$ – performs the following tasks:
- If the (light) gray signal $r(t)$ is larger than the voltage $w(t)$ at $R$ and $C$, the diode conducts, $w(t) = r(t)$ holds, and the capacitance $C$ is charged. In these regions, $w(t)$ is drawn in green.
- If $r(t) < w(t)$, as is the case at the times marked in purple, the diode blocks and the capacitance discharges through resistor $R$. The signal $w(t)$ decays exponentially with time constant $T = R · C$.
- From the times marked with circles, $r(t) > w(t)$ holds again and the capacitance is recharged. It can be seen from the sketch that $w(t)$ matches "approximately" the envelope $a(t)$.
$\text{Design criteria:}$
- The deviations between the envelope approximation $w(t)$ and its nominal function $a(t)$ decrease the larger the carrier frequency $f_{\rm T}$ is compared to the bandwidth $B_{\rm NF}$ of the low frequency message signal. As a guideline, $f_{\rm T} ≥ 100 · B_{\rm NF}$ is often given.
- At the same time, the time constant $T$ of the RC parallel resonant circuit should always be much larger than $1/f_{\rm T}$ and much smaller than $1/B_{\rm NF}$:
- $$1/f_{\rm T}\hspace{0.1cm} \ll \hspace{0.1cm} T \hspace{0.1cm} \ll \hspace{0.1cm} 1/B_{\rm NF} \hspace{0.05cm}, $$
- A good compromise is the geometric mean between the two limits:
- $$ T_{\rm opt} = {1}/{\sqrt{f_{\rm T} \cdot B_{\rm NF} } } \hspace{0.05cm}.$$
- If the time constant $T$ is too small, as in the left area of the sketch above, the capacitor will always discharge too quickly and the deviation $w(t) \ – \ a(t)$ will be unnecessarily large.
- Also, a too large value $T > T_{\rm opt}$ will result in deterioration, as shown in the right signal detail. In this case, $w(t)$ can no longer follow the envelope $a(t)$.
$\text{Example 2:}$ For a low frquency bandwidth of $B_{\rm NF} = 5 \ \rm kHz$, the carrier frequency should be at least $f_{\rm T} = 500 \ \rm kHz$ .
- The time constant $T$ must be much larger than $1/f_{\rm T} = 2 \ \rm µ s$ and at the same time much smaller than $1/B_{\rm NF} = 200 \ \rm µ s $.
- The optimal value according to the compromise formula is thus:
- $$T_{\rm opt} = 1/\sqrt{ 5 \cdot 10^5 \ {\rm Hz} \cdot 5 \cdot 10^3 \ {\rm Hz} } = 20 \ \rm µ s \hspace{0.05cm}.$$
The graph on the right is intended to illustrate the operation of the envelope demodulator in the frequency domain. The spectrum $W(f)$ of the signal $w(t)$ at the RC parallel circuit differs from the spectrum $Q(f)$ of the source signal as follows:
- Due to the carrier signal $z(t)$ added at the transmitter, the spectral function $W(f)$ includes a Dirac delta line at $f = 0$ with weight $A_{\rm T}$ (carrier amplitude).
- $W(f)$ also exhibits spectral components in the region around the carrier frequency $f_{\rm T}$, which can be explained by the jagged time course of $w(t)$ (see the first graph in this section).
- $W(f)$ also differs only slightly from $Q(f)$ in the low frequency domain. Here, the error gets smaller as the carrier frequency increases compared to the bandwidth $B_{\rm NF}$.
The first two signal distortions are eliminated by the high-pass and low-pass filters, which together produce a band-pass. However, there also remains a slight deviation between the sink signal $v(t)$ and the source signal $q(t)$ in the interesting range $0 < f < B_{\rm NF}$, as shown by comparing the output spectrum $V(f)$ plotted in red and the input spectrum $Q(f)$ plotted in blue.
Why does envelope demodulation fail for $m > 1$?
The graph shows the DSB-AM signals for $m = 0.5$ and $m = 2$. From this picture one can recognize the following differences:
- For a modulation depth $m ≤ 1$ the envelope of the band-pass signal is characterized by:
- $$a(t) = q(t) + A_{\rm T}\hspace{0.05cm}.$$
- Here, an ideal demodulation ⇒ $v(t) = q(t)$ is possible with an envelope demodulator, if we ignore unavoidable noise.
- In contrast, with $m > 1$ the following relationship holds:
- $$a(t) = |q(t) + A_{\rm T} |\hspace{0.05cm}.$$
- Here, envelope demodulation always leads to $\text{nonlinear distortions}$.
- The sink signal $v(t)$ now includes new frequencies, which were not present in $q(t)$.
- For the DC component (expected value) of the envelope, in this case it holds that:
${\rm E}[a(t)] \ne A_{\rm T}\hspace{0.05cm}.$ - Since now instead of $A_{\rm T}$ this DC component ${\rm E}[a(t)]$ is removed by the high-pass filter, an additional level shift occurs.
Description using the equivalent low-pass signal
Especially when the source signal $q(t)$ can be represented as a sum of several harmonic oscillations, a signal description with the equivalent low-pass signal ${r_{\rm TP}(t)}$ is extremely advantageous. This is described in detail in the book "Signal Representation".
$\text{Please note:}$ If noise/interference is disregarded, the »received signal« can be written as:
- $$r(t) = a(t) \cdot \cos (\omega_{\rm T}\cdot t + \phi(t))\hspace{0.05cm}.$$
This equation is valid for any form of amplitude modulation under different boundary conditions:
- Double sideband (DSB) or single sideband (SSB),
- with or without a carrier,
- ideal channel or linear distorting channel.
$\text{In general}$: The associated »equivalent low-pass signal« (German: "äquivalentes Tiefpass–Signal" ⇒ subscript "TP") is complex and given as:
- $$r_{\rm TP}(t) = a(t) \cdot {\rm e}^{\hspace{0.03cm}{\rm j} \hspace{0.05cm} \cdot \hspace{0.05cm} \phi(t)}\hspace{0.05cm}.$$
The time functions $a(t)$ and $ϕ(t)$ contained in the equations are identical for both representations:
- The function $a(t)$ describes the »envelope« (time-dependent amplitude) of the physical signal $r(t)$ and the magnitude $\vert r_{\rm TP}(t) \vert $ of the equivalent low-pass signal, respectively. This is detected during envelope demodulation.
- The function $ϕ(t)$ is the »time-dependent phase«. This function contains all information about the position of the zero crossings of $r(t)$ and indicates whether an additional phase modulation is effective.
In the case of double sideband amplitude modulation $\text{(DSB-AM)}$, the following holds for an ideal channel:
- The »locality curve« or »locus curve« – by this we mean the time-dependent representation of the signal $r_{\rm TP}(t)$ in the complex plane – is a horizontal straight line on the real axis.
- It further follows that the phase function can take only two values: $0$ and $π$ $(180^\circ)$ .
- When $m ≤ 1$, then $ϕ(t) ≡ 0$ and the envelope demodulation can be applied without distortion.
- When $m > 1$, a section of the locus curve lies in the left half-plane ⇒ nonlinear distortions arise when envelope demodulation is applied.
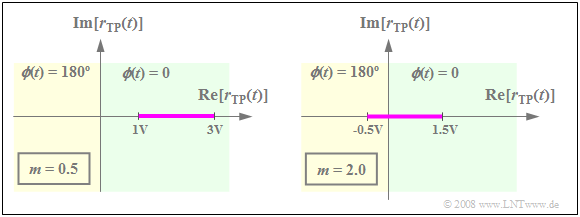
$\text{Example 3:}$ We assume that the source signal $q(t)$ can take on all values in the range $±1\ \rm V$.
- Adding a DC component of $A_{\rm T} = 2\ \rm V$ results in a DSB-AM with modulation depth $m = 0.5$, whose locus curve can be seen in the left graph.
- $r_{\rm TP}(t)$ always lies in the right half-plane. The pointer length changes with the source signal $q(t)$.
The right-hand graph holds for $A_{\rm T} = 0.5 \ \rm V$ ⇒ $m = 2$.
- $r_{\rm TP}(t)$ now takes on real values between $-0.5\ \rm V$ and $1.5\ \rm V$.
- The envelope demodulator cannot distinguish between positive and negative values ⇒ nonlinear distortions occur.
The physical signals $q(t)$, $r(t)$ and $v(t)$ corresponding to this example can be found in the graph in the "previous section".
Special case of a cosine-shaped message signal
To quantitatively capture the nonlinear distortions due to a modulation depth $m> 1$, we assume the following scenario:
- cosine-shaped source signal: $q(t) = A_{\rm N} \cdot \cos(\omega_{\rm N} \cdot t);$
- DSB–AM with carrier: $s(t) = \left ( q(t) + A_{\rm T} \right ) \hspace{-0.05cm}\cdot \hspace{-0.05cm}\cos(\omega_{\rm N} \hspace{-0.05cm}\cdot \hspace{-0.05cm}t),$ $r(t) = s(t);$
- modulation depth: $m = A_{\rm N}/A_{\rm T} = 1.25;$
- ideal envelope demodulation: $a(t) = {| q(t) + A_{\rm T}|} $
- elimination of the DC component by a low-pass: $r(t) = a(t) - {\rm E}\big[a(t)\big].$
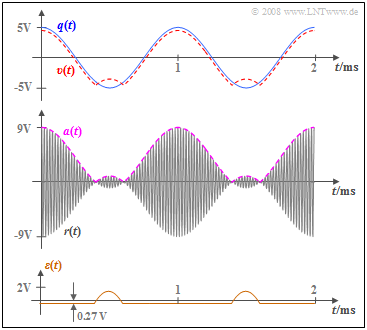
The graph is valid for the signal parameters $A_{\rm N} = 5 \ \rm V$, $f_{\rm N} = 2 \ \rm kHz$, $A_{\rm T} = 4 \ \rm V$ and $f_{\rm T} = 100\ \rm kHz$. It shows
- above, the sink signal $v(t)$ compared to the source signal $q(t)$,
- in the middle, the received signal $r(t)$ as well as the envelope curve $a(t) = {|r(t)|}$,
- below, the error signal $ε(t) = v(t) \ – \ q(t)$ due to nonlinear distortions.
Based on the graphs, the following statements can be made:
- A comparison of the signals $q(t)$ and $a(t)$ reveals, that in this example the envelope $a(t)$ correctly reproduces the shape of the source signal $q(t)$ in around $80\%$ of the time.
- However, the maximum of the envelope $a(t)$ is noticeably larger than the maximum of the source signal $q(t)$ due to the added carrier $A_{\rm T}$.
- The sink signal $v(t)$ differs from the envelope curve $a(t)$ by the expected value ${\rm Ε}\big[a(t)\big]$, which is removed by the low-pass of the envelope demodulator.
- Since ${\rm Ε}\big[a(t)\big] = 4.27 \ \rm V$ does not match $A_{\rm T} = 4 \ \rm V$, $v(t)$ differs from $q(t)$ by the constant value $0.27 \ \rm V$, also in the regions where $a(t)$ is correctly detected.
- The cosine source signal $q(t)$ becomes a signal $v(t)$ with harmonics:
- $$v(t) = A_{\rm 1} \cdot \cos(\omega_{\rm N} t ) +A_{\rm 2} \cdot \cos(2\omega_{\rm N} t )+A_{\rm 3} \cdot \cos(3\omega_{\rm N} t )+ \text{...}$$
- $$\Rightarrow \hspace{0.3cm}A_{\rm 1} = 4.48\,{\rm V},\hspace{0.3cm}A_{\rm 2} = 0.46\,{\rm V},\hspace{0.3cm}A_{\rm 3} = -0.37\,{\rm V},\hspace{0.3cm} A_{\rm 4} = 0.26\,{\rm V},\hspace{0.1cm}\text{...}$$
- Thus, according to the details in the book "Linear and Time Invariant Systems", we obtain for the individual distortion factors as well as the total distortion factor:
- $$K_2 ={|A_{\rm 2}|}/{A_{\rm 1}} = 0.102\hspace{0.3cm}K_3 ={|A_{\rm 3}|}/{A_{\rm 1}} = 0.082,\hspace{0.3cm}K_4 = {|A_{\rm 4}|}/{A_{\rm 1}} = 0.058,\hspace{0.1cm}\text{...}$$
- $$\Rightarrow \hspace{0.3cm}K = \sqrt{K_2^2 + K_3^2 + K_4^2 +\text{...} } \approx 15 \%.$$
- In the chapter "Quality Criteria" it was shown, that this also fixes the SNR at $ρ_v = 1/K^2 ≈ 44$ .
- The SNR $ρ_v$ $($but not $K)$ can also be used as a quality criterion if $q(t)$ contains more than one frequency ⇒ derivation in the book "Linear and Time Invariant Systems".
Considering channel distortions
For the following considerations, we assume the modulation method "DSB-AM with carrier" as well as a cosine-shaped source signal $q(t)$ .
- Let the amplitudes of the source and carrier signals be $A_{\rm N} = 4 \ \rm V$ and $A_{\rm T} = 5 \ \rm V $, resp. ⇒ modulation depth $m = 0.8$.
- Thus (ideal) envelope demodulation is applicable in principle.
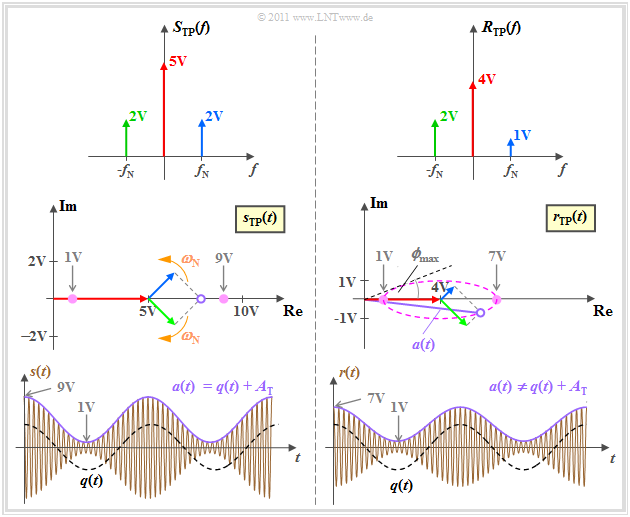
The graph shows, in descending order
- the spectra $S_{\rm TP}(f)$ and $R_{\rm TP}(f)$ of the equivalent low-pass signals, which are assumed to be real,
- the equivalent low-pass signals $s_{\rm TP}(t)$ and $r_{\rm TP}(t)$ in the complex plane, and lastly
- the physical signals $s(t)$ and $r(t)$.
The left half of the image shows the transmitter and at the same time gives the conditions at the receiver for an ideal channel.
- Due to the modulation depth $m ≤ 1$, the source signal $q(t)$ can be recognized in the envelope $a(t)$.
- Consequently, envelope demodulation is applicable without distortion under certain conditions, as shown in $\text{Example 4}$.
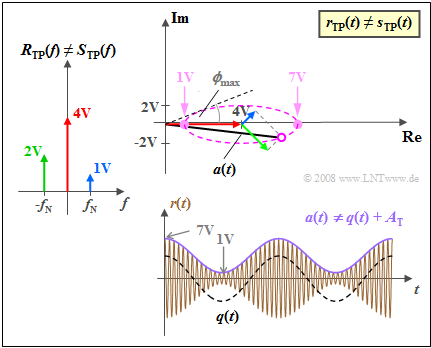
The right half considers asymmetrical distortions through the channel.
- Here the carrier is attenuated by $α_{\rm T} = 0.8$, and the upper sideband by $α_{\rm O} = 0.5$.
- Now the envelope $a(t) ≠ q(t) + A_{\rm T}$ is no longer cosine-shaped.
- Here, envelope demodulation leads to nonlinear distortions as shown in $\text{Example 5}$.
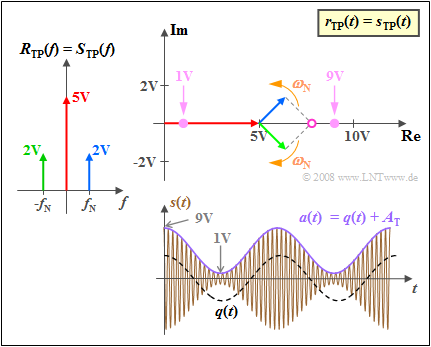
$\text{Example 4:}$ Let $A_{\rm N} = 4 \ \rm V$ and $A_{\rm T} = 5 \rm V$ continue to hold ⇒ modulation depth $m = 0.8$. The graph illustrates the use of an ideal envelope demodulator with an ideal channel, whereby the following identities are considered:
- $$R_{\rm TP}(f) \hspace{-0.05cm}=\hspace{-0.05cm} S_{\rm TP}(f) \hspace{0.02cm}, \hspace{0.5cm} r_{\rm TP}(t) \hspace{-0.05cm}=\hspace{-0.05cm} s_{\rm TP}(t) \hspace{0.02cm}, \hspace{0.5cm} r(t) \hspace{-0.05cm}=\hspace{-0.05cm} s(t) \hspace{0.02cm}.$$
From these representations one can recognize:
- The red pointer of length $A_{\rm T}$ depicting the carrier is fixed.
- The upper sideband (in blue) rotates in mathematically positive direction, the lower sideband (in green) in the opposite direction.
- Since the blue and green pointers both rotate with the same angular velocity $ω_{\rm N}$ but in opposite directions, the vector sum of all pointers is always real.
- Should the modulation depth $m ≤ 1$, then at all times $r_{\rm TP}(t) ≥ 0$ and $ϕ(t) = 0$. This means, that the zero crossings of the received signal $r(t)$ exactly coincide with those of the carrier signal $z(t)$.
- The envelope $a(t)$ of the physical signal $r(t)$ is equal to the resulting pointer length, i.e., equal to the magnitude of $r_{\rm TP}(t)$. Because $m< 1$ , $a(t) = q(t) + A_{\rm T}$ holds.
- For the given amplitude values, the locus curve $r_{\rm TP}(t)$ lies on the real axis between the end-points $A_{\rm T} \ – \ A_{\rm N} = 1\ \rm V$ and $A_{\rm T} + A_{\rm N} = 9 \ \rm V$.
- The locus curve on the real axis in the right half-plane is an indicator that the message signal can be extracted without distortion by an envelope demodulator.
$\text{Example 5:}$ Now let us consider the same graphs for a distorting channel where
- $α_{\rm U} = 1.0$ ⇒ the lower sideband (German: "unteres Seitenband" ⇒ subscript "U") is unchanged,
- $α_{\rm T} = 0.8$ ⇒ the carrier (German: "Träger" ⇒ subscript "T") is slightly attenuated,
- $α_{\rm U} = 0.5$ ⇒ the upper sideband (German: "oberes Seitenband" ⇒ subscript "O") is attenuated more.
The graphs can then be interpreted as follows:
- Due to the different lengths of the green pointer $\rm (USB)$ and blue pointer $\rm (OSB)$, the locus curve becomes an ellipse, whose center is fixed by the (red) carrier.
- The angle between the complex-valued $r_{\rm TP}(t)$ and the coordinate origin is now no longer continuous $ϕ(t) \equiv 0$, but instead fluctuates between $±ϕ_{\rm max}.$
- The maximal phase is equal to the angle of the tangent to the ellipse. In the physical signal, $ϕ(t) ≠ 0$ leads to shifts of the zero crossings of $r(t)$ with respect to its nominal positions – as given by the carrier signal $z(t)$.
- The magnitude $a(t) = \vert r_{\rm TP}(t) \vert$ – i.e., the envelope of $r(t)$ – is thus no longer cosine-shaped, and the signal after the envelope demodulator contains harmonics in addition to the frequency $f_{\rm N}$:
$v(t) = A_{\rm 1} \cdot \cos(\omega_{\rm N}\cdot t ) +A_{\rm 2} \cdot \cos(2\omega_{\rm N}\cdot t )+A_{\rm 3} \cdot \cos(3\omega_{\rm N} \cdot t )+ \text{...}$ - These lead to nonlinear distortions, which are captured by the distortion factor $K$ .
When $A_{\rm N} = 4 \ \rm V$, $A_{\rm T} = 5 \ \rm V$, $α_{\rm U} = 1$ and $α_{\rm T} = 0.8$, the following numerical values are obtained as a function of the upper sideband $α_{\rm O}$:
- $α_{\rm O} = 1.00$: $K = 0$ ⇒ only the carrier is attenuated,
- $α_{\rm O} = 0.75$: $K ≈ 0.4\%$,
- $α_{\rm O} = 0.50$: $K ≈ 1.5\%$ ⇒ this value is used as a basis for the graph,
- $α_{\rm O} = 0.25$: $K ≈ 4\%$,
- $α_{\rm O} = 0.00$: $K ≈ 10\%$ ⇒ complete suppression of $\rm OSB$.
This graph is valid for $α_{\rm O} = 0.5$, in which case we obtain (although difficult to see with the naked eye):
- shifts in the zero crossings of the signal $r(t)$ by at most $25^\circ\hspace{-0.05cm}/360^\circ ≈ 7\%$ of the carrier period $T_0$, and
- deviation from the ideal cosine shape ⇒ $K ≈ 1.5\%$ .
Symmetrical channel distortions - attenuation distortions
An important result of the last section was that nonlinear signal distortions occur in the case of asymmetric linear distortions in the channel.
- If, on the other hand, the lower sideband is attenuated in the same way as the upper sideband, the locus curve is once again a horizontal straight line and no nonlinear distortions occur.
- Rather, the distortions with respect to $q(t)$ and $v(t)$ – as well as the distortions with respect to $s(t)$ and $r(t)$ – are linear in this case, and can be corrected for by a suitably dimensioned filter.
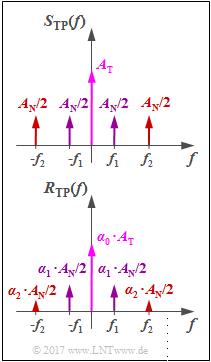
We now assume the following:
- A source signal $q(t)$ – composed of two cosine components at the frequencies $f_1$ and $f_2$ with amplitudes $A_1$ and $A_2$.
- DSB–AM with carrier ⇒ the transmitted signal $s(t)$ is composed of a total of five cosine oscillations at the frequencies $f_{\rm T}, f_{\rm T} ± f_1$ and $f_{\rm T} ± f_2$.
- A channel with attenuation distortions, symmetrical about the carrier frequency:
- $$H_{\rm K} (f = f_{\rm T})= \alpha_0, \hspace{0.3cm} H_{\rm K} (f = \pm f_{\rm 1})= \alpha_1, \hspace{0.3cm}H_{\rm K} (f = \pm f_{\rm 2})= \alpha_2;$$
- An ideal envelope demodulator as described in this section.
The graphic shows the spectral function of the equivalent low-pass signals of the transmitted signal and the received signal. From this picture, the following statements can be made:
- The equivalent low-pass signal $r_{\rm TP}(t)$ is real. The locus curve – i.e., the peak of the pointer composite in the complex plane – again also lies on the real axis.
- Should $α_0 · A_{\rm T}$ be greater than $α_1 · A_1 + α_2 · A_2$, then the "modulation depth of the received signal" is less than $1$ and nonlinear distortions do not occur.
- The sink signal after ideal envelope demodulation and elimination of the DC component $α_0 · A_{\rm T}$ by the downstream high-pass filter is:
- $$v(t) = \alpha_1 \cdot A_{\rm 1} \cdot \cos(2 \pi f_{\rm 1} t ) + \alpha_2 \cdot A_{\rm 2} \cdot \cos(2 \pi f_{\rm 2} t ) \hspace{0.05cm}.$$
This means:
- Linear distortions (attenuation distortions) occur when $α_2 ≠ α_1$ .
- If the symmetry with respect to $f_{\rm T}$ were not present, nonlinear distortions would arise.
⇒ We refer you to the (German language) learning video "Lineare und nichtlineare Verzerrungen" ⇒ "Linear and nonlinear distortions".
Influence of additive white Gaussian noise
Based on the system configuration
- DSB–AM with modulation depth $m ≤ 1$, and
- the best-fitting envelope demodulation
we can now estimate the influence of additive white Gaussian noise. Distortions of any kind – for example caused by an unsuitable channel or an imperfect realization of the modulator and demodulator – are ruled out.
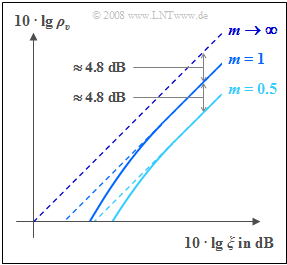
The graph on the right shows the sink SNR $10 · \lg \, ρ_v$ for different modulation depths $m$ as a function of the logarithmic performance parameter:
- $$10 \cdot {\rm lg }\hspace{0.1cm} \xi = 10 \cdot {\rm lg }\hspace{0.1cm} \frac{\alpha_{\rm K}^2 \cdot P_{\rm S}}{N_0 \cdot B_{\rm NF}} \hspace{0.05cm}.$$
The result of the envelope demodulator $\rm (ED)$ is marked with solid lines, while the dotted lines represent the synchronous demodulator $\rm (SD)$.
As already derived in the section "Investigations with regard to signal distortions", the results for the synchronous demodulator in this double-logarithmic representation are
- the angle bisector (for $m → ∞$, "DSB–AM without carrier"), and
- a shifted line parallel to it for "DSB–AM with carrier", with a vertical distance of $10 · \lg \, (1 + 2/m^2$).
When envelope demodulation $\rm (ED)$ is applied, the following differences are observed:
- An envelope demodulator is not useful when $m > 1$, because it would cause strong nonlinear distortions.
- The $\rm ED$–curves always lie beneath the dashed $\rm SD$–lines, assuming the same modulation depth $m$.
- Above a certain $ξ$–value, the $\rm ED$– and the $\rm SD$–curves cannot be distinguished for the given degree of precision.
More information on this topic can be found e.g. in [Kam 04][1].
Arguments for and against the envelope demodulator
The most important reason for the use of the envelope demodulator is (better said: was) that it avoids the often laborious need for frequency and phase synchronization, so that it can be realized cheaply. The envelope demodulator is thus an example of an "incoherent demodulator".
On the other hand, several reasons can be given in favour of the $\text{synchronous demodulator}$ and against the envelope demodulator:
- With envelope demodulation, an over-modulation $(m > 1)$ must be avoided under all circumstances. This can be achieved for example by limiting the amplitude of the source signal, though this also results in nonlinear distortions.
- All else being equal, the modulation depth $m < 1$ can only be achieved by increasing the transmitted power by at least a factor of $3$. This is also problematic because of justified discussions on the topic of "electronic smog" in large parts of our society.
- Linear channel distortions in the case of an envelope demodulator can lead to irreversible nonlinear channel distortions, whereas the linear distortions occurring during synchronous demodulation can possibly be compensated for by special measures taken at the receiver.
Exercises for the chapter
Exercise 2.7: Is the Modulation Depth Too High?
Exercise 2.7Z: DSB-AM and Envelope Demodulator
Exercise 2.8: Asymmetrical Channel
Exercise 2.9: Symmetrical Distortions
References
- ↑ Kammeyer, K.D.: Nachrichtenübertragung. Stuttgart: B.G. Teubner, 4. Auflage, 2004.
