Difference between revisions of "Modulation Methods/Pulse Code Modulation"
| Line 119: | Line 119: | ||
| − | == | + | ==Frequency domain view of natural sampling== |
<br> | <br> | ||
{{BlaueBox|TEXT= | {{BlaueBox|TEXT= | ||
| − | $\text{Definition:}$ | + | $\text{Definition:}$ The |
| − | ''' | + | '''natural sampling''' can be represented by the convolution theorem in the spectral domain as follows: |
| − | :$$q_{\rm A}(t) = p_{\rm R}(t) \cdot q(t) = \left [ \frac{1}{T_{\rm A} } \cdot p_{\rm \delta}(t) \star g_{\rm R}(t)\right ]\cdot q(t) | + | :$$q_{\rm A}(t) = p_{\rm R}(t) \cdot q(t) = \left [ \frac{1}{T_{\rm A} } \cdot p_{\rm \delta}(t) \star g_{\rm R}(t)\right ]\cdot q(t) \hspace{0.3cm} |
\Rightarrow \hspace{0.3cm}Q_{\rm A}(f) = \left [ P_{\rm \delta}(f) \cdot \frac{1}{T_{\rm A} } \cdot G_{\rm R}(f) \right ] \star Q(f) = P_{\rm R}(f) \star Q(f)\hspace{0.05cm}.$$}} | \Rightarrow \hspace{0.3cm}Q_{\rm A}(f) = \left [ P_{\rm \delta}(f) \cdot \frac{1}{T_{\rm A} } \cdot G_{\rm R}(f) \right ] \star Q(f) = P_{\rm R}(f) \star Q(f)\hspace{0.05cm}.$$}} | ||
| − | + | The graph shows the result for | |
| − | * | + | *an (unrealistic) rectangular spectrum $Q(f) = Q_0$ limited to the range $|f| ≤ 4 \ \rm kHz$ , |
| − | * | + | *the sampling rate $f_{\rm A} = 10 \ \rm kHz$ ⇒ $T_{\rm A} = 100 \ \rm µ s$, and. |
| − | * | + | *the square pulse duration $T_{\rm R} = 25 \ \rm µ s$ ⇒ $T_{\rm R}/T_{\rm A} = 0.25$. |
| − | [[File:EN_Mod_T_4_1_S3b.png |center|frame| | + | [[File:EN_Mod_T_4_1_S3b.png |center|frame| Spectrum in natural sampling with a square pulse]] |
| − | + | One can see from this plot: | |
| − | * | + | *The spectrum $P_{\rm R}(f)$ in natural sampling, in contrast to $P_δ(f)$ is not a Dirac pulse $($all weights equal $1)$, but the weights here are related to the function $G_{\rm R}(f)/T_{\rm A} = T_{\rm R}/T_{\rm A} - {\rm si}(πfT_{\rm R})$ evaluated |
| − | * | + | *Because of the zero of the $\rm si$-function, the diraclines vanish here at $±4f_{\rm A}$. |
| − | * | + | *The spectrum $Q_{\rm A}(f)$ results from the convolution with $Q(f)$. The rectangle around $f = 0$ has height $T_{\rm R}/T_{\rm A} - Q_0$, the proportions around $\mu - f_{\rm A} \ (\mu ≠ 0)$ are less high. |
| − | * | + | *If one uses an ideal, rectangular lowpass for signal reconstruction. |
:$$H(f) = \left\{ \begin{array}{l} T_{\rm A}/T_{\rm R} = 4 \\ 0 \\ \end{array} \right.\quad | :$$H(f) = \left\{ \begin{array}{l} T_{\rm A}/T_{\rm R} = 4 \\ 0 \\ \end{array} \right.\quad | ||
| − | \begin{array}{*{5}c}{\rm{ | + | \begin{array}{*{5}c}{\rm{for}}\\{\rm{for}} \\ \end{array}\begin{array}{*{10}c} |
{\hspace{0.04cm}\left| \hspace{0.005cm} f\hspace{0.05cm} \right| < f_{\rm A}/2}\hspace{0.05cm}, \\ | {\hspace{0.04cm}\left| \hspace{0.005cm} f\hspace{0.05cm} \right| < f_{\rm A}/2}\hspace{0.05cm}, \\ | ||
{\hspace{0.04cm}\left| \hspace{0.005cm} f\hspace{0.05cm} \right| > f_{\rm A}/2}\hspace{0.05cm}, \\ | {\hspace{0.04cm}\left| \hspace{0.005cm} f\hspace{0.05cm} \right| > f_{\rm A}/2}\hspace{0.05cm}, \\ | ||
\end{array}$$ | \end{array}$$ | ||
| − | :so | + | :so for the output spectrum $V(f) = Q(f)$ and accordingly $v(t) = q(t)$. |
{{BlaueBox|TEXT= | {{BlaueBox|TEXT= | ||
| − | $\text{ | + | $\text{Conclusion:}$ |
| − | * | + | *For natural sampling, a rectangular–low-pass filter is sufficient for signal reconstruction as for ideal sampling (with Dirac pulse). |
| − | * | + | *However, for amplitude matching in the passband, a gain by the factor $T_{\rm A}/T_{\rm R}$ must be considered. }} |
| − | == | + | ==Frequency domain view of discrete sampling== |
<br> | <br> | ||
{{BlaueBox|TEXT= | {{BlaueBox|TEXT= | ||
$\text{Definition:}$ | $\text{Definition:}$ | ||
| − | + | In '''discrete sampling''' the multiplication of the Dirac pulse $p_δ(t)$ with the source signal $q(t)$ takes place - at least mentally - first and only afterwards the convolution with the square pulse $g_{\rm R}(t)$: | |
:$$q_{\rm A}(t) = \big [ {1}/{T_{\rm A} } \cdot p_{\rm \delta}(t) | :$$q_{\rm A}(t) = \big [ {1}/{T_{\rm A} } \cdot p_{\rm \delta}(t) | ||
| − | \cdot q(t)\big ]\star g_{\rm R}(t) \hspace{0.3cm} \Rightarrow \hspace{0.3cm}Q_{\rm A}(f) = \big [ P_{\rm \delta}(f) \star Q(f) \big ] | + | \cdot q(t)\big ]\star g_{\rm R}(t) \hspace{0.3cm} \Rightarrow \hspace{0.3cm}Q_{\rm A}(f) = \big [ P_{\rm \delta}(f) \star Q(f) \big ] \cdot G_{\rm R}(f)/{T_{\rm A} } \hspace{0.05cm}.$$ |
| − | * | + | *It is irrelevant, but quite convenient, that here the factor $1/T_{\rm A}$ has been added to the valuation function $G_{\rm R}(f)$ . |
| − | * | + | *Thus, $G_{\rm R}(f)/T_{\rm A} = T_{\rm R}/T_{\rm A} - {\rm si}(πfT_{\rm R}).$}} |
| − | + | The upper graph shows (highlighted in green) the spectral function $P_δ(f) \star Q(f)$ after ideal sampling. In contrast, discrete sampling with a square pulse yields the spectrum $Q_{\rm A}(f)$ corresponding to the lower graph. | |
| − | [[File:EN_Mod_T_4_1_S3c.png|right|frame| | + | [[File:EN_Mod_T_4_1_S3c.png|right|frame| Spectrum when discretely sampled with a square pulse]] |
| − | + | You can see: | |
| − | * | + | *Each of the infinitely many partial spectra now has a different shape. Only the middle spectrum around $f = 0$.  is important; |
| − | * | + | *All other spectral components are removed at the receiver side by the low pass of the signal reconstruction. |
| − | * | + | *If one uses for this low pass again a rectangular filter with the gain around $T_{\rm A}/T_{\rm R}$ in the passband, one obtains for the output spectrum: |
:$$V(f) = Q(f) \cdot {\rm si}(\pi f T_{\rm R}) \hspace{0.05cm}.$$ | :$$V(f) = Q(f) \cdot {\rm si}(\pi f T_{\rm R}) \hspace{0.05cm}.$$ | ||
<br clear=all> | <br clear=all> | ||
{{BlaueBox|TEXT= | {{BlaueBox|TEXT= | ||
| − | $\text{ | + | $\text{Conclusion:}$ With discrete sampling and rectangular filtering, attenuation distortions gaccording to the weighting function ${\rm si}(πfT_{\rm R})$. |
| − | * | + | *These are the stronger, the larger $T_{\rm R}$ is. Only in the limiting case $T_{\rm R} → 0$ holds ${\rm si}(πfT_{\rm R}) = 1$. |
| − | * | + | *However, ideal equalization can fully compensate for these linear attenuation distortions. |
| − | * | + | *To obtain $V(f) = Q(f)$ respectively, $v(t) = q(t)$ then must hold: |
| − | :$$H(f) = \left\{ \begin{array}{l} (T_{\rm A}/T_{\rm R})/{\rm si}(\pi f T_{\rm R}) \\ 0 \\ \end{array} \right.\quad\begin{array}{*{5}c}{\rm{ | + | :$$H(f) = \left\{ \begin{array}{l} (T_{\rm A}/T_{\rm R})/{\rm si}(\pi f T_{\rm R}) \\ 0 \\ \end{array} \right.\quad\begin{array}{*{5}c}{\rm{for} }\\{\rm{for} } \\ \end{array}\begin{array}{*{10}c} |
{\hspace{0.04cm}\left \vert \hspace{0.005cm} f\hspace{0.05cm} \right \vert < f_{\rm A}/2}\hspace{0.05cm}, \\ | {\hspace{0.04cm}\left \vert \hspace{0.005cm} f\hspace{0.05cm} \right \vert < f_{\rm A}/2}\hspace{0.05cm}, \\ | ||
{\hspace{0.04cm}\left \vert \hspace{0.005cm} f\hspace{0.05cm} \right \vert > f_{\rm A}/2} \\ | {\hspace{0.04cm}\left \vert \hspace{0.005cm} f\hspace{0.05cm} \right \vert > f_{\rm A}/2} \\ | ||
| Line 193: | Line 193: | ||
==Quantization and quantization noise== | ==Quantization and quantization noise== | ||
<br> | <br> | ||
| − | + | The second functional unit '''Quantization''' of the PCM transmitter is used for value discretization. | |
| − | * | + | *For this purpose the whole value range of the analog source signal $($for example the range $± q_{\rm max})$ is divided into $M$ intervals. |
| − | * | + | * Each sample $q_{\rm A}(ν ⋅ T_{\rm A})$ is then assigned a representative $q_{\rm Q}(ν ⋅ T_{\rm A})$ of the associated interval (for example, the interval center) . |
{{GraueBox|TEXT= | {{GraueBox|TEXT= | ||
| − | $\text{ | + | $\text{Example 2:}$ The graph illustrates quantization using the quantization step number as an example $M = 8$. |
| − | [[File:Mod_T_4_1_S4a_vers2.png |center|frame| | + | [[File:Mod_T_4_1_S4a_vers2.png |center|frame| To illustrate quantization with $M = 8$ steps]] |
| − | * | + | *In fact, a power of two is always chosen for $M$ in practice because of the subsequent binary coding. |
| − | * | + | *Each of the samples marked by circles $q_{\rm A}(ν - T_{\rm A})$ is replaced by the corresponding quantized value $q_{\rm Q}(ν - T_{\rm A})$ The quantized values are entered as crosses. |
| − | * | + | *However, this process of value discretization is associated with an irreversible falsification. |
| − | * | + | *The falsification $ε_ν = q_{\rm Q}(ν - T_{\rm A}) \ - \ q_{\rm A}(ν - T_{\rm A})$ depends on the quantization level number $M$ The following bound applies: |
| − | :$$\vert \varepsilon_{\nu} \vert < | + | :$$\vert \varepsilon_{\nu} \vert < {1}/{2} \cdot2/M \cdot q_{\rm max}= {q_{\rm max} }/{M}\hspace{0.05cm}.$$}} |
{{BlaueBox|TEXT= | {{BlaueBox|TEXT= | ||
| − | $\text{Definition:}$ | + | $\text{Definition:}$ One refers to the root mean square error magnitude $ε_ν$ as '''quantization noise power''': |
:$$P_{\rm Q} = \frac{1}{2N+1 } \cdot\sum_{\nu = -N}^{+N}\varepsilon_{\nu}^2 \approx \frac{1}{N \cdot | :$$P_{\rm Q} = \frac{1}{2N+1 } \cdot\sum_{\nu = -N}^{+N}\varepsilon_{\nu}^2 \approx \frac{1}{N \cdot | ||
| − | T_{\rm A} } \cdot \int_{0}^{N \cdot T_{\rm A} }\varepsilon(t)^2 \hspace{0.05cm}{\rm d}t \hspace{0.3cm} {\rm | + | T_{\rm A} } \cdot \int_{0}^{N \cdot T_{\rm A} }\varepsilon(t)^2 \hspace{0.05cm}{\rm d}t \hspace{0.3cm} {\rm with}\hspace{0.3cm}\varepsilon(t) = q_{\rm Q}(t) - q(t) \hspace{0.05cm}.$$}} |
| − | '' | + | ''Notes:'' |
| − | * | + | *For calculating the quantization noise power $P_{\rm Q}$ the given approximation of "spontaneous quantization" is usually used. |
| − | * | + | *Here, one ignores sampling and forms the error signal from the continuous-time signals $q_{\rm Q}(t)$ and $q(t)$. |
| − | *$P_{\rm Q}$ | + | *$P_{\rm Q}$ also depends on the source signal $q(t)$ . Assuming that $q(t)$ takes all values between $±q_{\rm max}$ with equal probability and the quantizer is designed exactly for this range, we get accordingly [[Exercises:Task_4.4:_On_Quantization_Noise| Exercise 4.4]]: |
:$$P_{\rm Q} = \frac{q_{\rm max}^2}{3 \cdot M^2 } \hspace{0.05cm}.$$ | :$$P_{\rm Q} = \frac{q_{\rm max}^2}{3 \cdot M^2 } \hspace{0.05cm}.$$ | ||
| − | * | + | *In a speech or music signal, arbitrarily large amplitude values can occur - even if only very rarely. In this case, for $q_{\rm max}$ usually that amplitude value is used which is exceeded only at $1\%$ all times (in amplitude). |
==PCM–Codierung und –Decodierung== | ==PCM–Codierung und –Decodierung== | ||
Revision as of 14:18, 15 March 2022
Contents
- 1 # OVERVIEW OF THE FOURTH MAIN CHAPTER #
- 2 Principle and block diagram
- 3 Sampling and signal reconstruction
- 4 Natural and discrete sampling
- 5 Frequency domain view of natural sampling
- 6 Frequency domain view of discrete sampling
- 7 Quantization and quantization noise
- 8 PCM–Codierung und –Decodierung
- 9 Signal–zu–Rausch–Leistungsverhältnis
- 10 Einfluss von Übertragungsfehlern
- 11 Abschätzung der SNR-Degradation durch Übertragungsfehler
- 12 Nichtlineare Quantisierung
- 13 Kompression und Expandierung
- 14 Aufgaben zum Kapitel
# OVERVIEW OF THE FOURTH MAIN CHAPTER #
The fourth chapter deals with the digital modulation methods Amplitude Shift Keying (ASK), Phase Shift Keying (PSK) and Frequency Shift Keying (FSK) as well as some modifications derived from them. Most of the properties of the analog modulation methods mentioned in the last two chapters still apply. Differences result from the now required decision component of the receiver.
We restrict ourselves here essentially to the system-theoretical and transmission aspects. The error probability is given only for ideal conditions. The derivations and the consideration of non-ideal boundary conditions can be found in the book "Digital Signal Transmission".
In detail are treated:
- the Pulse Code Modulation (PCM) and its components sampling - quantization - coding,
- the linear modulation ASK, BPSK and DPSK and associated demodulators,
- the quadrature amplitude modulation (QAM) and more complicated signal space mappings,
- the FSK - Frequency Shift Keying as an example of nonlinear digital modulation,
- the FSK with continuous phase matching, especially the (G)MSK method.
Principle and block diagram
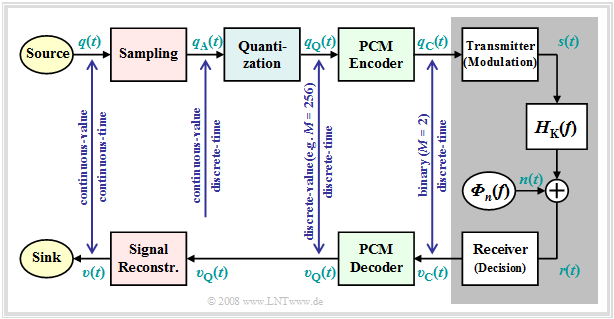
Almost all modulation methods used today work digitally. Their advantages have already been mentioned in first chapter this book. The first concept for digital signal transmission was already developed in 1938 by Alec Reeves and has also been used in practice since the 1960s under the name Pulse Code Modulation $\rm (PCM)$ Even though many of the digital modulation methods conceived in recent years differ from PCM in detail, it is very well suited to explain the principle of all these methods.
The exercise of the PCM system is to,
- convert the analog source signal $q(t)$ into the binary signal $q_{\rm C}(t)$ - this process is also called A/D conversion,
- transmitting this signal over the channel, where the receiver side signal $v_{\rm C}(t)$ is also binary because of the decision maker,
- to reconstruct exclusively from the binary signal $v_{\rm C}(t)$ the analog as well as value and time continuous sink signal $v(t)$ ⇒ D/A conversion.
Further to the above PCM block diagram, it should be noted:
- The PCM transmitter (or the A/D converter) is composed of the three function blocks Sampling - Quantization - PCM Coding which will be described in more detail in the next sections.
- The block with gray background shows the digital transmission system with digital transmitter and receiver (the latter also includes a decision maker), and the analog transmission channel, characterized by the frequency response $H_{\rm K}(f)$ and the noise power density ${\it Φ}_n(f)$.
- This block is covered in detail in the first three chapters of the book Digital Signal Transmission In chapter 5 of the same book, you will also find digital channel models that phenomenologically describe the transmission behavior using the binary signals $q_{\rm C}(t)$ and $v_{\rm C}(t)$ .
- Further, it can be seen from the above block diagram that there is no equivalent for quantization at the receiver end Therefore, even with error-free transmission, i.e., for $v_{\rm C}(t) = q_{\rm C}(t)$, the analog sink signal $v(t)$ will differ from the source signal $q(t)$ .
- As a measure of the quality of the (digital) transmission system, we use the Signal-to-Noise Power Ratio ⇒ in short: Sink-SNR as the quotient of the powers of useful signal $q(t)$ and fault signal $ε(t) = v(t) - q(t)$:
- $$\rho_{v} = \frac{P_q}{P_\varepsilon}\hspace{0.3cm} {\rm with}\hspace{0.3cm}P_q = \overline{[q(t)]^2}, \hspace{0.2cm}P_\varepsilon = \overline{[v(t) - q(t)]^2}\hspace{0.05cm}.$$
- Here, an ideal amplitude matching is assumed, so that in the ideal case (that is: sampling according to the sampling theorem, best possible signal reconstruction, infinitely fine quantization) the sink signal $v(t)$ would exactly match the source signal $q(t)$ .
We would like to refer you already here to the three-part learning video Pulse Code Modulation which contains all aspects of PCM. Its principle is explained in detail in the first part of the video.
Sampling and signal reconstruction
Sampling - that is, time discretization of the analog signal $q(t)$ - was covered in detail in the chapter Discrete-Time Signal Representation of the book "Signal Representation." Here follows a brief summary of that section.
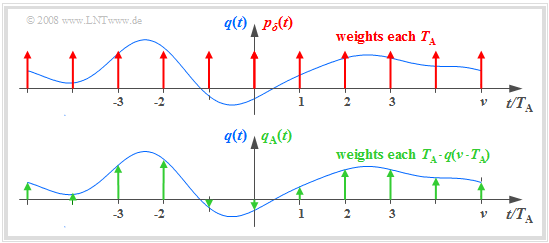
The graph illustrates sampling in the time domain. The (blue) signal $q(t)$ is time continuous, the (green) signal sampled at a distance $T_{\rm A}$ is discrete-time. Here:
- The sampling can be calculated by multiplying the analog signal $q(t)$ by the Diracpulse in time domain ⇒ $p_δ(t)$ represent:
- $$q_{\rm A}(t) = q(t) \cdot p_{\delta}(t)\hspace{0.3cm} {\rm with}\hspace{0.3cm}p_{\delta}(t)= \sum_{\nu = -\infty}^{\infty}T_{\rm A}\cdot \delta(t - \nu \cdot T_{\rm A}) \hspace{0.05cm}.$$.
- The weight of the Dirac function at $t = ν - T_{\rm A}$ is equal to $T_{\rm A} - q(ν - T_{\rm A})$. Since the Dirac function $δ(t)$ has the unit $\rm 1/s$ thus $q_{\rm A}(t)$ has the same unit as $q(t)$, for example "V".
- The Fourier transform of the Dirac pulse $p_δ(t)$ is also a Dirac pulse (but now in the frequency domain) ⇒ $P_δ(f)$, where the spacing of the individual Dirac lines $f_{\rm A} = 1/T_{\rm A}$ is. All momentum weights of $P_δ(f)$ are $1$:
- $$p_{\delta}(t)= \sum_{\nu = -\infty}^{+\infty}T_{\rm A}\cdot \delta(t - \nu \cdot T_{\rm A}) \hspace{0.2cm}\circ\!\!\!\!\!\!\!\!\bullet\, \hspace{0.2cm} P_{\delta}(f)= \sum_{\mu = -\infty}^{+\infty} \delta(f - \mu \cdot f_{\rm A}) \hspace{0.05cm}.$$
- The spectrum $Q_{\rm A}(f)$ of the sampled signal is obtained from the Convolution Theorem, where $Q(f)$ denotes the continuous spectrum of the analog signal $q(t)$ :
- $$Q_{\rm A}(f) = Q(f) \star P_{\delta}(f)= \sum_{\mu = -\infty}^{+\infty} Q(f - \mu \cdot f_{\rm A}) \hspace{0.05cm}.$$
We refer you here to the second part of the tutorial video Pulse Code Modulation which explains sampling and signal reconstruction in terms of system theory.
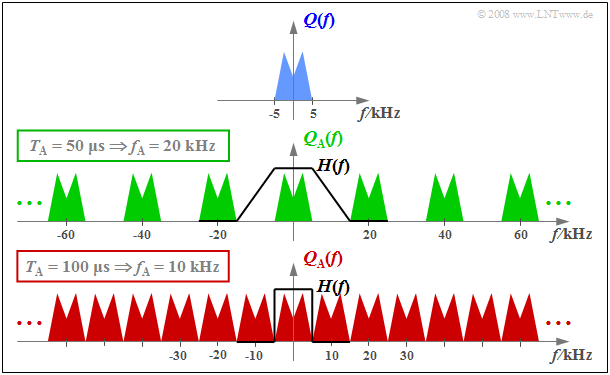
$\text{Example 1:}$ The top graph schematically shows the spectrum $Q(f)$ of an analog source signal $q(t)$ with frequencies up to $f_{\rm N, \ max} = 5 \ \rm kHz$.
- If one samples $q(t)$ with the sampling rate $f_{\rm A} = 20 \ \rm kHz$ $($so at the respective distance $T_{\rm A} = 50 \ \rm µ s)$ , one obtains the periodic spectrum sketched in green $Q_{\rm A}(f)$.
- Since the Dirac functions are infinitely narrow, $q_{\rm A}(t)$ also contains arbitrary high frequency components and accordingly $Q_{\rm A}(f)$ is extended to infinity (middle graph).
- Drawn below (in red) is the spectrum $Q_{\rm A}(f)$ for the sampling parameters $T_{\rm A} = 100 \ \rm µ s$ ⇒ $f_{\rm A} = 10 \ \rm kHz$.
$\text{Conclusion:}$ From this example, the following important lessons can be learned regarding sampling:
- If $Q(f)$ contains frequencies up to $f_\text{N, max}$, then according to the Sampling theorem the sampling rate $f_{\rm A} ≥ 2 - f_\text{N, max}$ should be chosen. At smaller sampling rate $f_{\rm A}$ $($thus larger spacing $T_{\rm A})$ overlaps of the periodized spectra occur, i.e. irreversible distortions.
- If exactly $f_{\rm A} = 2 - f_\text{N, max}$ as in the lower graph of $\text{Example 1}$, then $Q(f)$ can be calculated from $Q_{\rm A}(f)$ - resp. in PCM system $V(f)$ from $V_{\rm Q}(f)$ - can be completely reconstructed by an ideal rectangular low-pass filter $H(f)$ with cutoff frequency $f_{\rm G} = f_{\rm A}/2$ .
- On the other hand, if sampling is performed with $f_{\rm A} > 2 - f_\text{N, max}$ as in the middle graph of the example, a low-pass filter $H(f)$ with a smaller slope can also be used on the receiver side for signal reconstruction, as long as the following condition is met:
- $$H(f) = \left\{ \begin{array}{l} 1 \\ 0 \\ \end{array} \right.\quad \begin{array}{*{5}c}{\rm{for} } \\{\rm{for} } \\ \end{array}\begin{array}{*{10}c} {\hspace{0.04cm}\left \vert \hspace{0.005cm} f\hspace{0.05cm} \right \vert \le f_{\rm N, \hspace{0.05cm}max},} \\ {\hspace{0.04cm}\left \vert\hspace{0.005cm} f \hspace{0.05cm} \right \vert \ge f_{\rm A}- f_{\rm N, \hspace{0.05cm}max}.} \\ \end{array}$$
Natural and discrete sampling
Multiplication by the Dirac pulse provides only an idealized description of the sampling, since a Dirac function $($duration $T_{\rm R} → 0$, height $1/T_{\rm R} → ∞)$ is not realizable. In practice, the Dirac pulse $p_δ(t)$ must be replaced, for example, by a square pulse
- $$p_{\rm R}(t)= \sum_{\nu = -\infty}^{+\infty}g_{\rm R}(t - \nu \cdot T_{\rm A})\hspace{0.3cm} {\rm mit}\hspace{0.3cm} g_{\rm R}(t) = \left\{ \begin{array}{l} 1 \\ 1/2 \\ 0 \\ \end{array} \right.\quad \begin{array}{*{5}c}{\rm{f\ddot{u}r}}\\{\rm{f\ddot{u}r}} \\{\rm{f\ddot{u}r}} \\ \end{array}\begin{array}{*{10}c}{\hspace{0.04cm}\left|\hspace{0.06cm} t \hspace{0.05cm} \right|} < T_{\rm R}/2\hspace{0.05cm}, \\{\hspace{0.04cm}\left|\hspace{0.06cm} t \hspace{0.05cm} \right|} = T_{\rm R}/2\hspace{0.05cm}, \\ {\hspace{0.005cm}\left|\hspace{0.06cm} t \hspace{0.05cm} \right|} > T_{\rm R}/2\hspace{0.05cm} \\ \end{array}$$
where the rectangular pulse duration $T_{\rm R}$ should be significantly smaller than the sampling distance $T_{\rm A}$ .
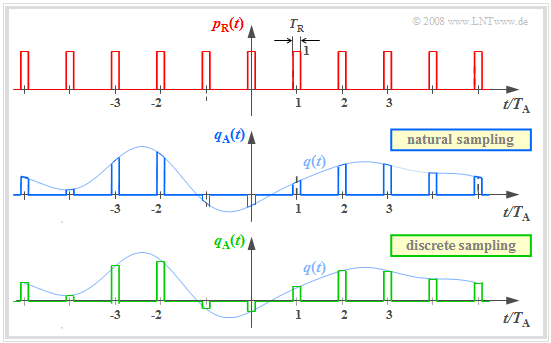
The graph above shows the square pulse $p_{\rm R}(t)$. Below are two different sampling methods using this square pulse:
- In natural sampling the sampled signal $q_{\rm A}(t)$ is obtained by multiplying $q(t)$ by $p_{\rm R}(t)$. In the ranges $p_{\rm R}(t) = 1$ thus $q_{\rm A}(t)$ has the same progression as $q(t)$.
- In discrete sampling the signal $q(t)$ is - at least mentally - first multiplied by the Dirac pulse $p_δ(t)$ Then each Dirac pulse $T_{\rm A} - δ(t - ν - T_{\rm A})$ is replaced by a square pulse $g_{\rm R}(t - ν - T_{\rm A})$ .
Here and in the following frequency domain consideration, an acausal description form is chosen for simplicity. For a (causal) realization, $g_{\rm R}(t) = 1$ would have to hold in the range from $0$ to $T_{\rm R}$ and not as here for $ \ -T_{\rm R}/2 < t < T_{\rm R}/2.$
Frequency domain view of natural sampling
$\text{Definition:}$ The natural sampling can be represented by the convolution theorem in the spectral domain as follows:
- $$q_{\rm A}(t) = p_{\rm R}(t) \cdot q(t) = \left [ \frac{1}{T_{\rm A} } \cdot p_{\rm \delta}(t) \star g_{\rm R}(t)\right ]\cdot q(t) \hspace{0.3cm} \Rightarrow \hspace{0.3cm}Q_{\rm A}(f) = \left [ P_{\rm \delta}(f) \cdot \frac{1}{T_{\rm A} } \cdot G_{\rm R}(f) \right ] \star Q(f) = P_{\rm R}(f) \star Q(f)\hspace{0.05cm}.$$
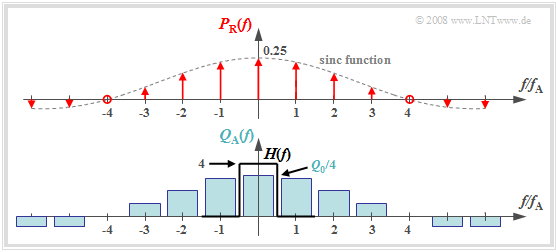
The graph shows the result for
- an (unrealistic) rectangular spectrum $Q(f) = Q_0$ limited to the range $|f| ≤ 4 \ \rm kHz$ ,
- the sampling rate $f_{\rm A} = 10 \ \rm kHz$ ⇒ $T_{\rm A} = 100 \ \rm µ s$, and.
- the square pulse duration $T_{\rm R} = 25 \ \rm µ s$ ⇒ $T_{\rm R}/T_{\rm A} = 0.25$.
One can see from this plot:
- The spectrum $P_{\rm R}(f)$ in natural sampling, in contrast to $P_δ(f)$ is not a Dirac pulse $($all weights equal $1)$, but the weights here are related to the function $G_{\rm R}(f)/T_{\rm A} = T_{\rm R}/T_{\rm A} - {\rm si}(πfT_{\rm R})$ evaluated
- Because of the zero of the $\rm si$-function, the diraclines vanish here at $±4f_{\rm A}$.
- The spectrum $Q_{\rm A}(f)$ results from the convolution with $Q(f)$. The rectangle around $f = 0$ has height $T_{\rm R}/T_{\rm A} - Q_0$, the proportions around $\mu - f_{\rm A} \ (\mu ≠ 0)$ are less high.
- If one uses an ideal, rectangular lowpass for signal reconstruction.
- $$H(f) = \left\{ \begin{array}{l} T_{\rm A}/T_{\rm R} = 4 \\ 0 \\ \end{array} \right.\quad \begin{array}{*{5}c}{\rm{for}}\\{\rm{for}} \\ \end{array}\begin{array}{*{10}c} {\hspace{0.04cm}\left| \hspace{0.005cm} f\hspace{0.05cm} \right| < f_{\rm A}/2}\hspace{0.05cm}, \\ {\hspace{0.04cm}\left| \hspace{0.005cm} f\hspace{0.05cm} \right| > f_{\rm A}/2}\hspace{0.05cm}, \\ \end{array}$$
- so for the output spectrum $V(f) = Q(f)$ and accordingly $v(t) = q(t)$.
$\text{Conclusion:}$
- For natural sampling, a rectangular–low-pass filter is sufficient for signal reconstruction as for ideal sampling (with Dirac pulse).
- However, for amplitude matching in the passband, a gain by the factor $T_{\rm A}/T_{\rm R}$ must be considered.
Frequency domain view of discrete sampling
$\text{Definition:}$ In discrete sampling the multiplication of the Dirac pulse $p_δ(t)$ with the source signal $q(t)$ takes place - at least mentally - first and only afterwards the convolution with the square pulse $g_{\rm R}(t)$:
- $$q_{\rm A}(t) = \big [ {1}/{T_{\rm A} } \cdot p_{\rm \delta}(t) \cdot q(t)\big ]\star g_{\rm R}(t) \hspace{0.3cm} \Rightarrow \hspace{0.3cm}Q_{\rm A}(f) = \big [ P_{\rm \delta}(f) \star Q(f) \big ] \cdot G_{\rm R}(f)/{T_{\rm A} } \hspace{0.05cm}.$$
- It is irrelevant, but quite convenient, that here the factor $1/T_{\rm A}$ has been added to the valuation function $G_{\rm R}(f)$ .
- Thus, $G_{\rm R}(f)/T_{\rm A} = T_{\rm R}/T_{\rm A} - {\rm si}(πfT_{\rm R}).$
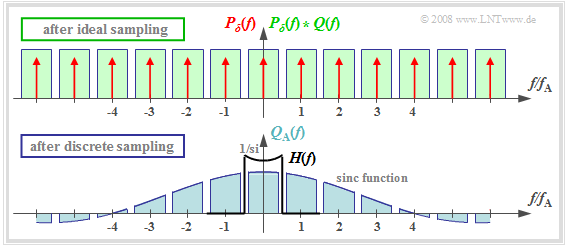
The upper graph shows (highlighted in green) the spectral function $P_δ(f) \star Q(f)$ after ideal sampling. In contrast, discrete sampling with a square pulse yields the spectrum $Q_{\rm A}(f)$ corresponding to the lower graph.
You can see:
- Each of the infinitely many partial spectra now has a different shape. Only the middle spectrum around $f = 0$.  is important;
- All other spectral components are removed at the receiver side by the low pass of the signal reconstruction.
- If one uses for this low pass again a rectangular filter with the gain around $T_{\rm A}/T_{\rm R}$ in the passband, one obtains for the output spectrum:
- $$V(f) = Q(f) \cdot {\rm si}(\pi f T_{\rm R}) \hspace{0.05cm}.$$
$\text{Conclusion:}$ With discrete sampling and rectangular filtering, attenuation distortions gaccording to the weighting function ${\rm si}(πfT_{\rm R})$.
- These are the stronger, the larger $T_{\rm R}$ is. Only in the limiting case $T_{\rm R} → 0$ holds ${\rm si}(πfT_{\rm R}) = 1$.
- However, ideal equalization can fully compensate for these linear attenuation distortions.
- To obtain $V(f) = Q(f)$ respectively, $v(t) = q(t)$ then must hold:
- $$H(f) = \left\{ \begin{array}{l} (T_{\rm A}/T_{\rm R})/{\rm si}(\pi f T_{\rm R}) \\ 0 \\ \end{array} \right.\quad\begin{array}{*{5}c}{\rm{for} }\\{\rm{for} } \\ \end{array}\begin{array}{*{10}c} {\hspace{0.04cm}\left \vert \hspace{0.005cm} f\hspace{0.05cm} \right \vert < f_{\rm A}/2}\hspace{0.05cm}, \\ {\hspace{0.04cm}\left \vert \hspace{0.005cm} f\hspace{0.05cm} \right \vert > f_{\rm A}/2} \\ \end{array}$$
Quantization and quantization noise
The second functional unit Quantization of the PCM transmitter is used for value discretization.
- For this purpose the whole value range of the analog source signal $($for example the range $± q_{\rm max})$ is divided into $M$ intervals.
- Each sample $q_{\rm A}(ν ⋅ T_{\rm A})$ is then assigned a representative $q_{\rm Q}(ν ⋅ T_{\rm A})$ of the associated interval (for example, the interval center) .
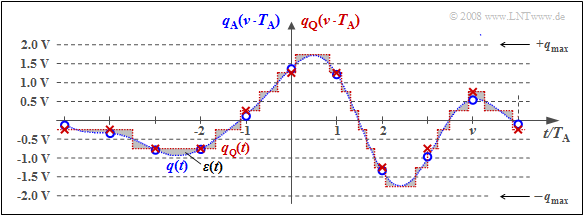
$\text{Example 2:}$ The graph illustrates quantization using the quantization step number as an example $M = 8$.
- In fact, a power of two is always chosen for $M$ in practice because of the subsequent binary coding.
- Each of the samples marked by circles $q_{\rm A}(ν - T_{\rm A})$ is replaced by the corresponding quantized value $q_{\rm Q}(ν - T_{\rm A})$ The quantized values are entered as crosses.
- However, this process of value discretization is associated with an irreversible falsification.
- The falsification $ε_ν = q_{\rm Q}(ν - T_{\rm A}) \ - \ q_{\rm A}(ν - T_{\rm A})$ depends on the quantization level number $M$ The following bound applies:
- $$\vert \varepsilon_{\nu} \vert < {1}/{2} \cdot2/M \cdot q_{\rm max}= {q_{\rm max} }/{M}\hspace{0.05cm}.$$
$\text{Definition:}$ One refers to the root mean square error magnitude $ε_ν$ as quantization noise power:
- $$P_{\rm Q} = \frac{1}{2N+1 } \cdot\sum_{\nu = -N}^{+N}\varepsilon_{\nu}^2 \approx \frac{1}{N \cdot T_{\rm A} } \cdot \int_{0}^{N \cdot T_{\rm A} }\varepsilon(t)^2 \hspace{0.05cm}{\rm d}t \hspace{0.3cm} {\rm with}\hspace{0.3cm}\varepsilon(t) = q_{\rm Q}(t) - q(t) \hspace{0.05cm}.$$
Notes:
- For calculating the quantization noise power $P_{\rm Q}$ the given approximation of "spontaneous quantization" is usually used.
- Here, one ignores sampling and forms the error signal from the continuous-time signals $q_{\rm Q}(t)$ and $q(t)$.
- $P_{\rm Q}$ also depends on the source signal $q(t)$ . Assuming that $q(t)$ takes all values between $±q_{\rm max}$ with equal probability and the quantizer is designed exactly for this range, we get accordingly Exercise 4.4:
- $$P_{\rm Q} = \frac{q_{\rm max}^2}{3 \cdot M^2 } \hspace{0.05cm}.$$
- In a speech or music signal, arbitrarily large amplitude values can occur - even if only very rarely. In this case, for $q_{\rm max}$ usually that amplitude value is used which is exceeded only at $1\%$ all times (in amplitude).
PCM–Codierung und –Decodierung
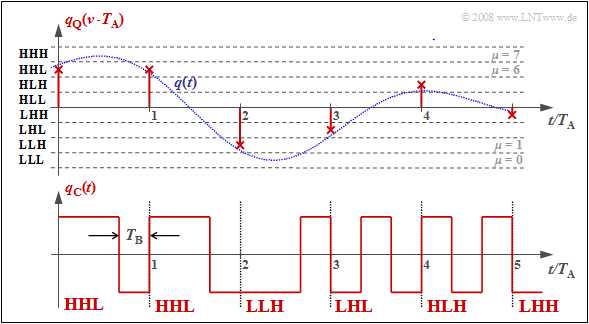
Der Block PCM–Codierung dient der Umsetzung der zeitdiskreten (nach Abtastung) und wertdiskreten (nach Quantisierung mit $M$ Stufen) Signalwerte $q_{\rm Q}(ν · T_{\rm A})$ in eine Folge von $N = {\rm log_2}(M)$ Binärwerte. Logarithmus zur Basis 2 ⇒ Logarithmus dualis.
$\text{Beispiel 3:}$ Jeder Binärwert ⇒ Bit ist durch ein Rechteck der Dauer $T_{\rm B} = T_{\rm A}/N$ dargestellt, woraus sich das Signal $q_{\rm C}(t)$ ergibt.
Man erkennt:
- Es wird hier der Dualcode verwendet. Das bedeutet, dass die Quantisierungsintervalle $\mu$ von $0$ bis $M–1$ durchnummeriert und anschließend in einfacher Binärform geschrieben werden. Mit $M = 8$ gilt beispielsweise $\mu = 6$ ⇔ 110.
- Die drei Binärsymbole des codierten Signals $q_{\rm C}(t)$ ergeben sich, wenn man 0 durch L („Low”) und 1 durch H („High”) ersetzt. Im Beispiel erhält man so: HHL HHL LLH LHL HLH LHH.
- Die Bitdauer $T_{\rm B}$ ist hier um den Faktor $N = {\rm log_2}(M) = 3$ kürzer als der Abtastabstand $T_{\rm A} = 1/f_{\rm A}$, und die Bitrate ist $R_{\rm B} = {\rm log_2}(M) · f_{\rm A}$.
- Verwendet man bei der Decodierung $(v_{\rm C} ⇒ v_{\rm Q})$ die gleiche Zuordnung wie bei der Codierung $(q_{\rm Q} ⇒ q_{\rm C})$, so gilt, falls es zu keinen Übertragungsfehlern kommt: $v_{\rm Q}(ν · T_{\rm A}) = q_{\rm Q}(ν · T_{\rm A}).$
- Eine Alternative zum Dualcode ist der Graycode, bei dem sich benachbarte Binärwerte nur in einem Bit unterscheiden. Für $N = 3$:
- $\mu = 0$: LLL, $\mu = 1$: LLH, $\mu = 2$: LHH, $\mu = 3$: LHL, $\mu = 4$: HHL, $\mu = 5$: HHH, $\mu =6$: HLH, $\mu = 7$: HLL.
Signal–zu–Rausch–Leistungsverhältnis
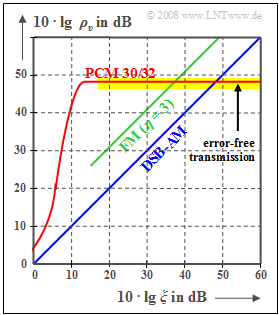
Das digitale Pulscodemodulation $\rm (PCM)$ wird nun den analogen Modulationsverfahren $\rm (AM, \ FM)$ hinsichtlich des erreichbaren Sinken–SNR $ρ_v = P_q/P_ε$ bei AWGN–Rauschen vergleichend gegenüber gestellt.
Wie in vorherigen Kapiteln (zum Beispiel) bezeichnet $ξ = {α_{\rm K} }^2 · P_{\rm S}/(N_0 · B_{\rm NF})$ die Leistungskenngröße. Diese fasst verschiedene Einflüsse zusammen:
- den Kanalübertragungsfaktor $α_{\rm K}$ (quadratisch),
- die Sendeleistung $P_{\rm S}$,
- die AWGN–Rauschleistungsdichte $N_0$ (reziprok) sowie
- die Signalbandbreite $B_{\rm NF}$ (ebenfalls reziprok);
bei einer harmonischen Schwingung: Frequenz $f_{\rm N}$ statt $B_{\rm NF}$.
Die beiden Vergleichskurven für Amplitudenmodulation (AM) und für Frequenzmodulation (FM) lassen sich wie folgt beschreiben:
- Zweiseitenband–AM ohne Träger:
- $$ρ_v = ξ \ ⇒ \ 10 · \lg ρ_v = 10 · \lg \ ξ,$$
- Frequenzmodulation mit $η = 3$:
- $$ρ_υ = 3/2 \cdot η^2 · ξ = 13.5 · ξ \ ⇒ \ 10 · \lg \ ρ_v = 10 · \lg \ ξ + 11.3 \ \rm dB.$$
Die Kurve für das PCM 30/32–System ist wie folgt zu interpretieren:
- Ist die Leistungskenngröße $ξ$ hinreichend groß, so treten keine Übertragungsfehler auf. Das Fehlersignal $ε(t) = v(t) \ - \ q(t)$ ist dann allein auf die Quantisierung zurückzuführen $(P_ε = P_{\rm Q})$.
- Mit der Quantisierungsstufenzahl $M = 2^N$ gilt in diesem Fall näherungsweise:
- $$\rho_{v} = \frac{P_q}{P_\varepsilon}= M^2 = 2^{2N} \hspace{0.3cm}\Rightarrow \hspace{0.3cm} 10 \cdot {\rm lg}\hspace{0.1cm}\rho_{v}=20 \cdot {\rm lg}\hspace{0.1cm}M = N \cdot 6.02\,{\rm dB}$$
- $$ \Rightarrow \hspace{0.3cm} N = 8, \hspace{0.05cm} M =256\text{:}\hspace{0.2cm}10 \cdot {\rm lg}\hspace{0.1cm}\rho_{v}=48.16\,{\rm dB}\hspace{0.05cm}.$$
- Anzumerken ist, dass die angegebene Gleichung nur für ein sägezahnförmiges Quellensignal exakt gültig ist. Bei cosinusförmigem Quellensignal ist jedoch die Abweichung hiervon nicht sehr groß.
- Mit kleiner werdendem $ξ$ (kleinere Sendeleistung oder größere Rauschleistungsdichte) nehmen die Übertragungsfehler zu. Damit wird $P_ε > P_{\rm Q}$ und der Sinken–Störabstand wird kleiner.
- Die PCM $($mit $M = 256)$ ist den Analogverfahren $($AM und FM$)$ nur im unteren und mittleren $ξ$–Bereich überlegen. Spielen aber Übertragungsfehler keine Rolle mehr, so ist durch ein größeres $ξ$ keine Verbesserung mehr zu erzielen (horizontaler, gelb hinterlegter Kurvenabschnitt).
- Eine Verbesserung bringt nur eine Erhöhung von $N$ (Bitanzahl pro Abtastwert) ⇒ größeres $M = 2^N$ (Quantisierungsstufenzahl). Beispielsweise erreicht man bei einer Compact Disc (CD) mit dem Parameter $N = 16$ ⇒ $M = 65536$ den Wert
- $$10 · \lg \ ρ_v = 96.32 \ \rm dB.$$
$\text{Beispiel 4:}$ Die folgende Grafik zeigt den begrenzenden Einfluss der Quantisierung:
- Weiß gepunktet dargestellt ist das Quellensignal $q(t)$, grün gepunktet das Sinkensignal $v(t)$ nach PCM mit $N = 4$ ⇒ $M = 16$.
- Die Abtastzeitpunkte sind durch Kreuze markiert.
- Übertragungsfehler werden vorerst ausgeschlossen. Abtastung und Signalrekonstruktion seien bestmöglich an $q(t)$ angepasst.
Dieses Bild kann wie folgt interpretiert werden:
- Mit $N = 8$ ⇒ $M = 256$ ist das Sinkensignal $v(t)$ vom Quellensignal $q(t)$ mit dem bloßen Auge nicht zu unterscheiden. Für beide gilt näherungsweise der weiß gepunktete Signalverlauf.
- Am Störabstand $10 · \lg \ ρ_v = 47.8 \ \rm dB$ erkennt man aber, dass das Quantisierungsrauschen (Leistung $P_\varepsilon$ des Fehlersignals) nur etwa um den Faktor $1.6 · 10^{–5}$ kleiner ist als die Leistung $P_q$ des Quellensignals. Dieses SNR wäre bei einem Sprach– oder Musiksignal schon deutlich hörbar.
- Obwohl das hier betrachtete Quellensignal weder sägezahnförmig noch cosinusförmig verläuft, sondern sich aus mehreren Frequenzanteilen zusammensetzt, weicht die angegebene Näherung $ρ_v ≈ M^2$ ⇒ $10 · \lg \ ρ_υ = 48.16 \ \rm dB$ nur unwesentlich vom tatsächlichen Wert ab.
- Dagegen erkennt man für $N = 4$ ⇒ $M = 16$ bereits im Bild Abweichungen zwischen dem Sinkensignal (grün markiert) und dem Quellensignal (weiße Markierung), was auch durch den sehr kleinen Störabstand $10 · \lg \ ρ_υ = 28.2 \ \rm dB$ quantitativ zum Ausdruck kommt.
Einfluss von Übertragungsfehlern
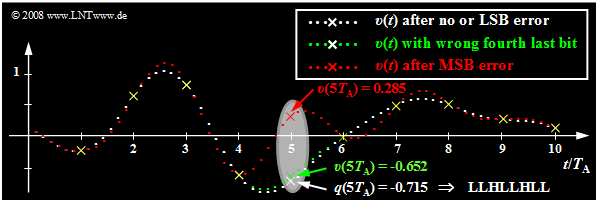
Ausgehend vom gleichen Analogsignal $q(t)$ wie im letzten Abschnitt und einer linearen Quantisierung mit $N = 8$ Bit ⇒ $M = 256$ werden nun die Auswirkungen von Übertragungsfehlern anhand des jeweiligen Sinkensignals $v(t)$ verdeutlicht.
- Die weißen Punkte markieren wieder das Quellensignal $q(t)$. Ohne Übertragungsfehler hat das Sinkensignal $v(t)$ bei Vernachlässigung der Quantisierung den gleichen Verlauf.
- Nun wird jeweils genau ein Bit des fünften Abtastwertes $q(5 · T_{\rm A}) = -0.715$ verfälscht, wobei dieser Abtastwert mit LLHL LHLL codiert wurde. Dieser Grafik zugrunde liegt der Dualcode, das heißt, dass das unterste Quantisierungsintervall $(\mu = 0)$ mit LLLL LLLL und das oberste Intervall $(\mu = 255)$ mit HHHH HHHH dargestellt wird.
Die Tabelle zeigt die Ergebnisse dieser Untersuchung:
- Der angegebene Störabstand $10 · \lg \ ρ_v$ wurde aus dem dargestellten (sehr kurzen) Signalausschnitt der Dauer $10 · T_{\rm A}$ berechnet.
- Bei jeweils einem Fehler bei der Übertragung von $10 · 8 = 80$ Bit entspricht dies einer Bitfehlerrate von $1.25\%$.
Die in der Grafik und der Tabelle dargestellten Ergebnisse dieser Fehleranalyze können wie folgt zusammengefasst werden:
- Wird nur das letzte Bit des Binärwortes verfälscht $($LSB: Least Significant Bit, LLHL LHLL ⇒ LLHL LHLH$)$, so ist mit bloßem Auge kein Unterschied zur fehlerfreien Übertragung zu erkennen $($weißer Kurvenzug$)$. Trotzdem wird der Störabstand um $3.5 \ \rm dB$ vermindert.
- Ein Übertragungsfehler des viertletzten Bits $($grüne Kurve, LLHLLHLL ⇒ LLHLHHLL$)$ führt bereits zu einer deutlich erkennbaren Verfälschung um acht Quantisierungsintervalle. Das heißt: $v(5T_{\rm A}) \ - \ q(5T_{\rm A}) = 8/256 · 2 = 0.0625$ und der Störabstand sinkt auf $10 · \lg \ ρ_υ = 28.2 \ \rm dB$.
- Die rote Kurve zeigt schließlich den Fall, dass das MSB (Most Significant Bit) verfälscht wird: LLHLLHLL ⇒ HLHLLHLL. Dies führt zur Verfälschung $v(5T_{\rm A}) \ – \ q(5T_{\rm A}) = 1$ (entspricht dem halben Aussteuerbereich). Der Störabstand beträgt nun nur mehr etwa $4 \ \rm dB$.
- Zu allen Abtastzeitpunkten mit Ausnahme von $5T_{\rm A}$ stimmt $v(t)$ bis auf den Quantisierungsfehler mit $q(t)$ exakt überein. Außerhalb dieser durch gelbe Kreuze markierten Zeitpunkte führt der einzige Fehler bei $5T_{\rm A}$ aber in einem ausgedehnten Bereich zu starken Abweichungen, was auf die Interpolation mit der $\rm si$–förmigen Impulsantwort des Rekonstruktionstiefpasses $H(f)$ zurückzuführen ist.
Abschätzung der SNR-Degradation durch Übertragungsfehler
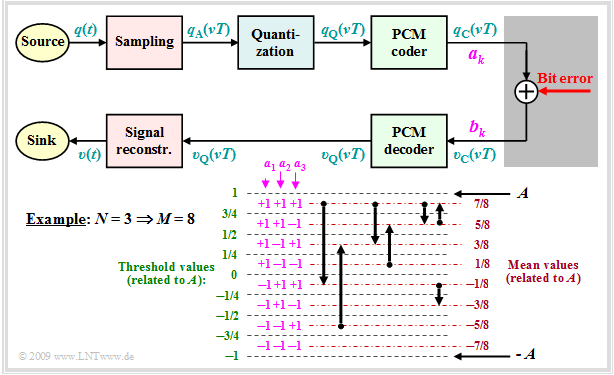
Nun soll versucht werden, die SNR–Kurve des PCM–Systems unter Berücksichtigung von Bitfehlern zumindest näherungsweise zu bestimmen. Wir gehen dabei vom folgenden Blockschaltbild aus und setzen weiter voraus:
- Jeder Abtastwert $q_{\rm A}(νT)$ wird mit $M$ Stufen quantisiert und mit $N = {\rm log_2} (M)$ Binärzeichen (Bit) dargestellt. Im Beispiel gilt $M = 8$ ⇒ $N = 3$.
- Die Binärdarstellung von $q_{\rm Q}(νT)$ liefert die Amplitudenkoeffizienten $a_k\, (k = 1, \text{...} \hspace{0.08cm}, N),$ die durch Bitfehler in die Koeffizienten $b_k$ verfälscht werden können.
- Sowohl $a_k$ als auch $b_k$ sind jeweils $±1$.
- Ein Bitfehler $(b_k ≠ a_k)$ tritt mit der Wahrscheinlichkeit $p_{\rm B}$ auf.
- Jedes Bit wird gleichwahrscheinlich verfälscht und in jedem PCM–Wort ist maximal ein Fehler ⇒ nur eines der $N$ Bit kann falsch sein.
Aus dem in der Grafik angegebenen Diagramm ist für $N = 3$ und natürliche Binärcodierung (Dualcode) zu erkennen:
- Eine Verfälschung von $a_1$ verändert den quantisierten Wert $q_{\rm Q}(νT)$ um $±A$.
- Eine Verfälschung von $a_2$ verändert den quantisierten Wert $q_{\rm Q}(νT)$ um $±A/2.$
- Eine Verfälschung von $a_3$ verändert den quantisierten Wert Wert $q_{\rm Q}(νT)$ um $±A/4$.
Durch Verallgemeinerung erhält man für die Abweichung $ε_k = υ_{\rm Q}(νT) \ - \ q_{\rm Q}(νT)$ für den Fall, dass der Amplitudenkoeffizient $a_k$ falsch übertragen wurde:
- $$\varepsilon_k = - a_k \cdot A \cdot 2^{-k +1} \hspace{0.05cm}.$$
Für die Fehlerrauschleistung erhält man nach Mittelung über alle Verfälschungswerte $ε_k$ (mit $1 ≤ k ≤ N)$ unter Berücksichtigung der Bitfehlerwahrscheinlichkeit $p_{\rm B}$:
- $$P_{\rm F}= {\rm E}\big[\varepsilon_k^2 \big] = \sum\limits^{N}_{k = 1} p_{\rm B} \cdot \left ( - a_k \cdot A \cdot 2^{-k +1} \right )^2 =\ p_{\rm B} \cdot A^2 \cdot \sum\limits^{N-1}_{k = 0} 2^{-2k } = p_{\rm B} \cdot A^2 \cdot \frac{1- 2^{-2N }}{1- 2^{-2 }} \approx {4}/{3} \cdot p_{\rm B} \cdot A^2 \hspace{0.05cm}.$$
- Hierbei ist die Summenformel der geometrischen Reihe sowie die Näherung $1 – 2^{–2N } ≈ 1$ verwendet.
- Für $N = 8$ ⇒ $M = 256$ beträgt der damit verbundene relative Fehler beispielsweise etwa $\rm 10^{–5}$.
Ohne Berücksichtigung von Übertragungsfehlern hat sich für das Signal–zu–Rausch–Leistungsverhältnis $ρ_v = P_{\rm S}/P_{\rm Q}$ ergeben, wobei bei einem gleichverteilten Quellensignal (zum Beispiel sägezahnförmig) die Signalleistung und die Quantisierungsrauschleistung wie folgt zu berechnen ist:
- $$P_{\rm S}={A^2}/{3}\hspace{0.05cm},\hspace{0.3cm}P_{\rm Q}= {A^2}/{3} \cdot 2^{-2N } \hspace{0.05cm}.$$
Unter Berücksichtigung der Übertragungsfehler erhält man mit obigem Ergebnis:
- $$\rho_{\upsilon}= \frac{P_{\rm S}}{P_{\rm Q}+P_{\rm F}} = \frac{A^2/3}{A^2/3 \cdot 2^{-2N } + A^2/3 \cdot 4 \cdot p_{\rm B}} = \frac{1}{ 2^{-2N } + 4 \cdot p_{\rm B}} \hspace{0.05cm}.$$
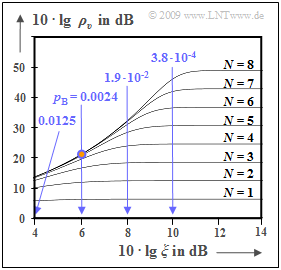
Die Grafik zeigt $10 · \lg ρ_v$ in Abhängigkeit der (logarithmierten) Leistungskenngröße $ξ = P_{\rm S}/(N_0 · B_{\rm NF})$, wobei $B_{\rm NF}$ die Signalbandbreite angibt. Der konstante Kanalübertragungsfaktor sei idealerweise $α_{\rm K} = 1$.
- Beim optimalen Binärsystem und AWGN–Rauschen gilt aber für die Leistungskenngröße auch $ξ = E_{\rm B}/N_0$ (Energie pro Bit bezogen auf die Rauschleistungsdichte).
- Die Bitfehlerwahrscheinlichkeit ist dann mit der Gaußschen Fehlerfunktion ${\rm Q}(x)$ wie folgt gegeben:
- $$p_{\rm B}= {\rm Q} \left ( \sqrt{{2E_{\rm B}}/{N_0} }\right ) \hspace{0.05cm}.$$
- Für $N = 8$ ⇒ $ 2^{–2{\it N} } = 1.5 · 10^{–5}$ sowie $10 · \lg \ ξ = 6 \ \rm dB$ ⇒ $p_{\rm B} = 0.0024$ (rot markierter Punkt) ergibt sich:
- $$\rho_{\upsilon}= \frac{1}{ 1.5 \cdot 10^{-5} + 4 \cdot 0.0024} \approx 100 \hspace{0.3cm} \Rightarrow \hspace{0.3cm}10 \cdot {\rm lg} \hspace{0.15cm}\rho_{\upsilon}\approx 20\,{\rm dB} \hspace{0.05cm}.$$
- Dieser kleine $ρ_v$–Wert geht auf den Term $4 · 0.0024$ im Nenner (Einfluss des Übertragungsfehlers) zurück, während im horizontalen Kurvenabschnitt für jedes $N$ (Bitanzahl pro Abtastwert) der Term $\rm 2^{–2{\it N} }$ dominiert – also das Quantisierungsrauschen.
Nichtlineare Quantisierung
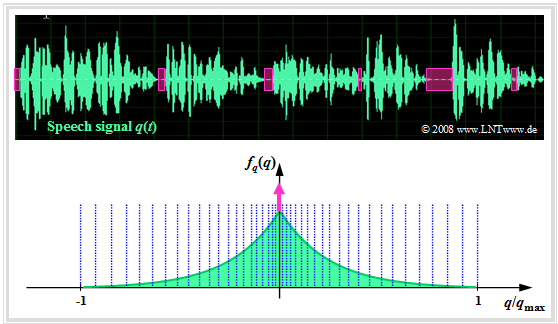
Häufig werden die Quantisierungsintervalle nicht gleich groß gewählt, sondern man verwendet für den inneren Amplitudenbereich eine feinere Quantisierung als für große Amplituden. Dafür gibt es mehrere Gründe:
- Bei Audiosignalen werden Verfälschungen der leisen Signalanteile (also Werte in der Nähe der Nulllinie) subjektiv als störender empfunden als eine Beeinträchtigung großer Amplitudenwerte.
- Eine solche ungleichmäßige Quantisierung führt bei einem solchen Musik– oder Sprachsignal auch zu einem größeren Sinkenstörabstand, da hier die Signalamplitude nicht gleichverteilt ist.
Die Grafik zeigt ein Sprachsignal $q(t)$ und dessen Amplitudenverteilung $f_q(q)$ ⇒ Wahrscheinlichkeitsdichtefunktion.
Es handelt sich um die Laplaceverteilung, die man wie folgt annähern kann:
- durch eine kontinuierliche, zweiseitige Exponentialverteilung, und
- durch eine Diracfunktion $δ(q)$ zur Berücksichtigung der Sprachpausen (magentafarben).
In der Grafik ist die nichtlineare Quantisierung nur angedeutet, zum Beispiel mittels der 13–Segment–Kennlinie, die in der Aufgabe 4.5 genauer beschrieben ist:
- Die Quantisierungsintervalle werden hierbei zu den Rändern hin abschnittsweise immer breiter.
- Die häufigeren kleinen Amplituden werden dagegen sehr fein quantisiert.
Kompression und Expandierung
Eine ungleichmäßige Quantisierung kann zum Beispiel dadurch realisiert werden, in dem
- die abgetasteten Werte $q_{\rm A}(ν · T_{\rm A})$ zunächst durch eine nichtlineare Kennlinie $q_{\rm K}(q_{\rm A})$ verformt und
- anschließend die entstehenden Ausgangswerte $q_{\rm K}(ν · T_{\rm A})$ gleichmäßig quantisiert werden.
Damit ergibt sich die nebenstehend skizzierte Signalkette.
$\text{Fazit:}$ Eine solche ungleichmäßige Quantisierung bedeutet:
- Durch die nichtlineare Kennlinie $q_{\rm K}(q_{\rm A})$ werden kleine Signalwerte verstärkt und große Werte abgeschwächt ⇒ Kompression.
- Diese bewusste Signalverzerrung macht man beim Empfänger durch die Umkehrfunktion $v_{\rm E}(υ_{\rm Q})$ rückgängig ⇒ Expandierung.
- Den Gesamtvorgang von sendeseitiger Kompression und empfängerseitiger Expansion nennt man auch Kompandierung.
Für das PCM–System 30/32 wurde von der Comité Consultatif International des Télégraphique et Téléphonique (CCITT) die so genannte A–Kennlinie empfohlen:
- $$y(x) = \left\{ \begin{array}{l} \frac{1 + {\rm ln}(A \cdot x)}{1 + {\rm ln}(A)} \\ \frac{A \cdot x}{1 + {\rm ln}(A)} \\ - \frac{1 + {\rm ln}( - A \cdot x)}{1 + {\rm ln}(A)} \\ \end{array} \right.\quad\begin{array}{*{5}c}{\rm{f\ddot{u}r}}\\{\rm{f\ddot{u}r}}\\{\rm{f\ddot{u}r}} \\ \end{array}\begin{array}{*{10}c}1/A \le x \le 1\hspace{0.05cm}, \\ - 1/A \le x \le 1/A\hspace{0.05cm}, \\ - 1 \le x \le - 1/A\hspace{0.05cm}. \\ \end{array}$$
- Hierbei ist zur Abkürzung $x = q_{\rm A}(ν · T_{\rm A})$ und $y = q_{\rm K}(ν · T_{\rm A})$ verwendet.
- Diese Kennlinie mit dem in der Praxis eingeführten Wert $A = 87.56$ hat eine sich ständig ändernde Steigung.
- Nähere Angaben zu dieser Art der ungleichmäßigen Quantisierung finden Sie in der Aufgabe 4.5.
Hinweis: Im dritten Teil des Lernvideos Pulscodemodulation werden behandelt:
- die Definition des Signal–zu–Rausch–Leistungsverhältnisses (SNR),
- der Einfluss von Quantisierungsrauschen und Übertragungsfehlern,
- die Unterschiede zwischen linearer und nichtlinearer Quantisierung.
Aufgaben zum Kapitel
Aufgabe 4.2: Tiefpass zur Signalrekonstruktion
Aufgabe 4.2Z: Zum Abtasttheorem
Aufgabe 4.3: Natürliche und diskrete Abtastung
Aufgabe 4.4: Zum Quantisierungsrauschen
Aufgabe 4.4Z: Störabstand bei PCM
Aufgabe 4.5: Nichtlineare Quantisierung
Aufgabe 4.6: Quantisierungskennlinien
