Contents
- 1 Properties of nonlinear modulation methods
- 2 FSK – Frequency Shift Keying
- 3 Coherent demodulation of FSK
- 4 Error probability of orthogonal FSK
- 5 Binäre FSK mit kontinuierlicher Phasenanpassung
- 6 MSK – Minimum Shift Keying
- 7 Realisierung der MSK als Offset–QPSK
- 8 General Description of Continuous Phase Modulation
- 9 GMSK – Gaussian Minimum Shift Keying
- 10 Aufgaben zum Kapitel
- 11 Quellenverzeichnis
Properties of nonlinear modulation methods
All modulation methods can be alternatively classified as:
- amplitude, phase and frequency modulation,
- analog and digital modulation methods,
- linear and non-linear modulation methods.
Considering this last distinction, the following definition applies:
$\text{Definition:}$ A linear modulation method is present if any linear combination of signals at modulator input leads to a corresponding linear combination at its output. Otherwise, it is non-linear modulation.
At the beginning of the book it was already pointed out that the main difference between an analog and a digital modulation method is that in the first one an analog source signal $q(t)$ is present and in the second one a digital signal. However, a closer look will reveal that there are a few more differences between these methods. This will be discussed in more detail below.
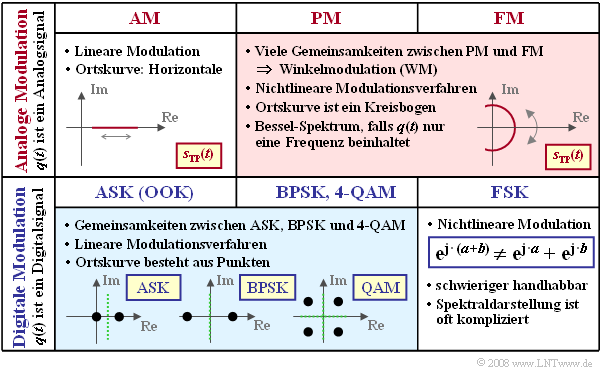
The following diagram shows some of the differences with respect to the classifications given above.
- Analog amplitude modulation $\rm (AM)$ is a linear method. The locus curve - that is, the equivalent low-pass signal $s_{\rm TP}(t)$ represented in the complex plane - is a straight line.
- There are many similarities between analog phase modulation $\rm (PM)$ and analog frequency modulation $\rm (FM)$ ⇒ common description as angle modulation $\rm (WM)$. In that case, the locus curve is the arc of a circle. In harmonic oscillation, there is a line spectrum $S(f)$ at multiples of the message frequency $f_{\rm N}$ around the carrier frequency $f_{\rm T}$.
- Digital amplitude modulation, referred to as either Amplitude Shift Keying $\rm (ASK)$ or as On–Off–Keying $\rm (OOK)$ , is also linear. In the binary case, the locus curve consists of only two points.
- Since binary phase modulation $($Binary Phase Shift Keying, $\rm BPSK)$ can be represented as $\rm ASK$ with bipolar amplitude coefficients, it is also linear. The shape of the BPSK power-spectral density is essentially determined by the magnitude square spectrum $|G_s(f)|^2$ of the fundamental transmission pulse.
- However, this also means:
- The BPSK spectral function is continuous in $f$, unlike the analog phase modulation of a harmonic oscillation (which only has one frequency!).
- If one were to consider BPSK as (analog) phase modulation with digital source signal $q(t)$ , then an infinite number of Bessel line spectra would have to be convolved together to calculate ${\it Φ}_s(f)$ when $Q(f)$ is represented as an infinite sum of individual frequencies.
- Since quadrature amplitude modulation with four signal space points $\rm (4–QAM)$ can also be described as the sum of two mutually orthogonal, quasi-independent BPSK systems, it too represents a linear modulation scheme. The same applies to the higher-level QAM methods such as $\rm 16–QAM$, $\rm 64–QAM$, ...
- Higher-level Phase Shift Keying, such as $\rm 8–PSK$, is linear only in special cases, see [Klo01][1]. Digital frequency modulation $($Frequency Shift Keying, $\rm FSK)$ is always nonlinear. This method is described below, where we restrict our focus to the binary case $\rm (2-FSK)$ beschränken.
FSK – Frequency Shift Keying
Now we assume
- the transmitted signal of the analog frequency modulation,
- $$s(t) = s_0 \cdot \cos\hspace{-0.05cm}\big [\psi(t)\big ] \hspace{0.2cm} {\rm with} \hspace{0.2cm} \psi(t) = 2\pi f_{\rm T} \hspace{0.05cm}t + K_{\rm FM} \cdot \int q(t)\hspace{0.1cm} {\rm d}t,$$
- the rectangular binary signal with $a_ν ∈ \{+1, –1\}$ ⇒ bipolar signaling:
- $$q(t) = \sum_{\nu = - \infty}^{+\infty}a_{ \nu} \cdot g_s (t - \nu \cdot T) \hspace{0.2cm} {\rm with} \hspace{0.2cm} g_s(t) = \left\{ \begin{array}{l} A \\ 0 \\ \end{array} \right.\quad \begin{array}{*{5}c}{\rm{for}} \\{\rm{for}} \\ \end{array}\begin{array}{*{10}c} 0 < t < T\hspace{0.05cm}, \\ {\rm otherwise} \hspace{0.05cm}. \\ \end{array}$$
Summarizing the amplitude $A$ and the modulator constant $K_{\rm FM}$ into the frequency deviation (see below for definition)
- $${\rm \Delta}f_{\rm A} = \frac{A \cdot K_{\rm FM}}{2 \pi}$$
then the das FSK transmit signal in the $ν$–th time interval is:
- $$s(t) = s_0 \cdot \cos\hspace{-0.05cm}\big [2 \pi \cdot t \cdot (f_{\rm T}+a_{ \nu} \cdot {\rm \Delta}f_{\rm A} ) \big ]\hspace{0.05cm}.$$
This can be calculated with the two possible signal frequencies
- $$f_{\rm +1} = f_{\rm T} +{\rm \Delta}f_{\rm A} \hspace{0.05cm}, \hspace{0.2cm}f_{\rm -1} = f_{\rm T} -{\rm \Delta}f_{\rm A}$$
and written as:
- $$s(t) = \left\{ \begin{array}{l} s_0 \cdot \cos (2 \pi \cdot f_{\rm +1} \cdot t ) \\ s_0 \cdot \cos (2 \pi \cdot f_{\rm -1} \cdot t ) \\ \end{array} \right.\quad \begin{array}{*{5}c}{\rm{f\ddot{u}r}} \\{\rm{f\ddot{u}r}} \\ \end{array}\begin{array}{*{10}c} a_{ \nu} = +1 \hspace{0.05cm}, \\ a_{ \nu} = -1\hspace{0.05cm}. \\ \end{array}$$
- Thus, at any given time, only one of the two frequencies $f_{+1}$ and $f_{–1}$ arises.
- The carrier frequency $f_{\rm T}$ itself does not occur in the signal.
$\text{Definition:}$ The frequency deviation $Δf_{\rm A}$ is defined in the same way as for analog frequency modulation, namely as the maximum deviation of the instantaneous frequency $f_{\rm A}(t)$ from the carrier frequency $f_{\rm T}$. Sometimes the frequency deviation is also referred to as $Δf$ or $F$ in the literature.
Another important descriptive quantity in this context is the "modulation index", which was also already defined for analog frequency modulation as $η = Δf_{\rm A}/f_{\rm N}$ . For FSK, a slightly different definition is required, which is taken into account here with a different variable symbol: $η ⇒ h$.
$\text{Definition:}$ For digital frequency modulation (FSK), the modulation index $h$ denotes the ratio of the total frequency deviation and the symbol rate $1/T$:
- $$h = \frac{2 \cdot {\rm \Delta}f_{\rm A} }{1/T} = 2 \cdot {\rm \Delta}f_{\rm A}\cdot T \hspace{0.05cm}.$$
Sometimes $h$ is also referred to as phase deviation in the literature.
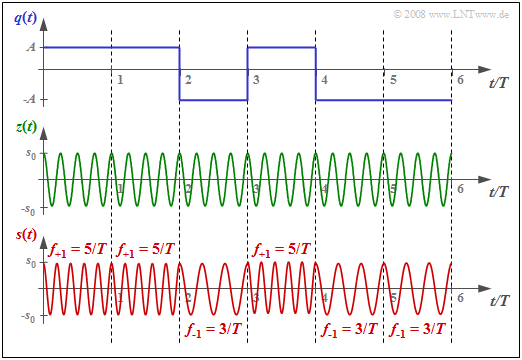
$\text{Example 1:}$ The graph below shows the FSK transmitted signal $s(t)$ for
- the binary source signal $q(t)$ sketched above with amplitude values $\pm A =\pm 1 \ \rm V$, and
- the carrier signal $z(t)$ drawn below with four oscillations per symbol duration $(f_{\rm T} · T = 4)$.
The underlying frequency deviation is $Δf_{\rm A} = 1/T$ ⇒ modulation index $h = 2$. The two possible frequencies are $f_{\rm +1} = 5/T \hspace{0.05cm},\hspace{0.2cm}f_{\rm -1} = 3/T \hspace{0.05cm}.$
Thus, for an FSK transmission system with bit rate $1 \ {\rm Mbit/s} \ \ (T = 1 \ \rm µ s)$ , the following FM constant would have to be used:
- $$K_{\rm FM} = \frac{2 \pi \cdot {\rm \Delta}f_{\rm A} }{A } = \frac{2 \pi }{A \cdot T } \approx 6.28 \cdot 10^{6}\,\,{\rm V^{-1}s^{-1} }\hspace{0.05cm}.$$
Coherent demodulation of FSK
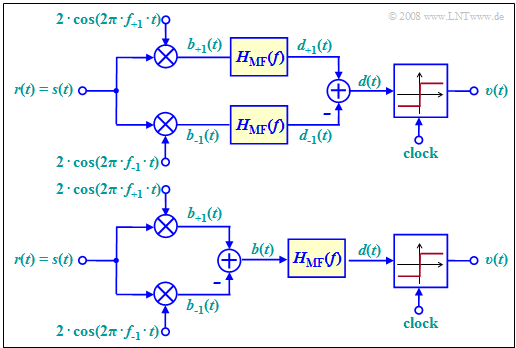
The diagram shows the best possible demodulator for binary FSK that operates coherently and thus requires knowledge of the phase of the FSK signal. This is accounted for in the block diagram by assuming that the received signal $r(t)$ is equal to the transmitted signal $s(t)$ - see signal waveforms in the previous section.
This demodulator operates according to the following principle (see upper arrangement):
- We are dealing with a maximum–likelihood receiver $\rm (ML)$ with a Matched-Filter realization. This filter with frequency response $H_{\rm MF}(f)$ an also be realized as an integrator with the assumed rectangular fundamental transmit pulse $g_s(t)$ .
- Both signals $b_{+1}(t)$ and $b_{–1}(t)$ before their corresponding matched–filters ergeben are obtained by phase-appropriate multiplication with the oscillations of the frequencies $f_{+1}$ and $f_{–1}$, respectively.
- The maximum likelihood receiver is known to decide on the branch (symbol) with the larger "metric", taking into account the downstream matched filter.
This means:
- $a_ν = +1$ was probably sent if the following condition is satisfied:
- $$d_{\rm +1}(\nu \cdot T) > d_{\rm -1}(\nu \cdot T) $$
- $$\Rightarrow \hspace{0.3cm} d(\nu \cdot T) = d_{\rm +1}(\nu \cdot T) - d_{\rm -1}(\nu \cdot T) > 0\hspace{0.05cm}.$$
The upper block diagram has been drawn according to this description for better understanding.
- Of course, matched filtering could instead also be moved to the right of the discrimination, as shown in the lower model .
- Then only one filter has to be implemented.
In Exercise 4.13 , this FSK demodulator is discussed in detail. On the exercise page you can also see the corresponding signal waveforms.
Error probability of orthogonal FSK
$\text{Definition:}$ One speaks of orthogonal FSK,
- if the modulation index $h$ is an integer multiple of $0.5$ , and thus
- the frequency deviation $Δf_{\rm A}$ is an integer multiple of $0.25/T$.
For the coherent demodulator, the correlation coefficient between $d_{+1}(T_{\rm D})$ and $d_{–1}(T_{\rm D})$ is zero at all detection times. Thus, the magnitude $|d(T_{\rm D})|$ - the distance of the detection samples from the threshold - is constant. No pulse interference occurs.
If one assumes
- orthogonal FSK,
- an AWGN channel $($captured by the quotient $E_{\rm B}/N_0)$, and
- the coherent demodulation described here
then the bit error probability is given by:
- $$p_{\rm B} = {\rm Q}\left ( \sqrt{{E_{\rm B}}/{N_0 }} \hspace{0.1cm}\right ) = {1}/{2}\cdot {\rm erfc}\left ( \sqrt{{E_{\rm B}}/(2 N_0 }) \hspace{0.1cm}\right ).$$
This corresponds to a degradation of $3 \ \rm dB$ compared to
BSPK because
- although the coherent FSK demodulator gives the same result with respect to the useful signal,
- and the noise powers in the two branches are also exactly the same as with BPSK,
- due tothe subtraction, the total noise power is doubled.
However, while non-coherent demodulation is not possible under any circumstances in binary phase modulation (BPSK), there is also a non-coherent FSK demodulator, but with a somewhat increased probability of error:
- $$p_{\rm B} = {1}/{2} \cdot {\rm e}^{- E_{\rm B}/{(2N_0) }}\hspace{0.05cm}.$$
The derivation of this equation is given in the chapter Carrier Frequency Systems with Non-Coherent Demodulation of the book "Digital Signal Transmission".
Binäre FSK mit kontinuierlicher Phasenanpassung
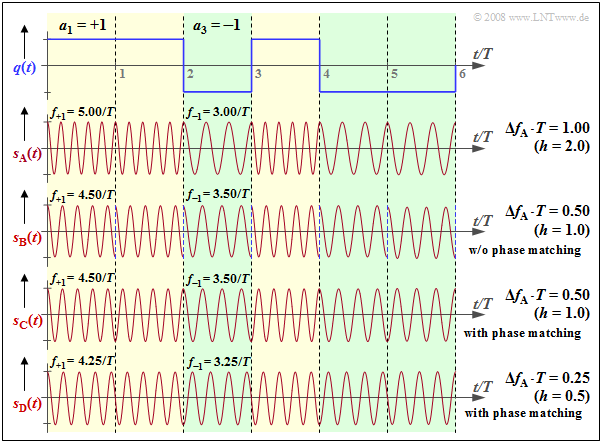
Wir betrachten weiter die orthogonale FSK. Die Grafik zeigt oben das Quellensignal $q(t)$ und und darunter gezeichnet das FSK–Signal $s_{\rm A}(t)$ mit dem Frequenzhub $Δf_{\rm A} = 1/T$ ⇒ Modulationsindex $h = 2 · Δf_{\rm A} · T = 2$. Zu den weiteren Signalverläufen ist Folgendes anzumerken:
- Das FSK–Signal $s_{\rm B}(t)$ verwendet die Momentanfrequenzen $f_{+1} = 4.5/T$, $f_{–1} = 3.5/T$ ⇒ $Δf_{\rm A} ·T = 0.5$ ⇒ $h = 1.$ Diese FSK ist wegen $h = 1$ $($Vielfaches von $0.5)$ ebenfalls orthogonal. Bei kleinerem $h$ ist aber die Bandbreiteneffizienz besser ⇒ das Spektrum $S_{\rm B}(f)$ ist schmäler als $S_{\rm A}(f)$.
- Allerdings erkennt man im Signal $s_{\rm B}(t)$ an jeder Symbolgrenze einen Phasensprung um $π$, wodurch sich wieder eine Verbreiterung des Spektrums ergibt. Solche Phasensprünge lassen sich durch Phasenanpassung vermeiden. Man spricht dann von Continuous Phase Modulation $\rm (CPM)$.
- Auch beim CPM–Signal $s_{\rm C}(t)$ gilt $f_{+1} = 4.5/T, f_{–1} = 3.5/T$ und $h = 1$. Im Bereich $0$ ... $T$ wird der Koeffizient $a_1 = +1$ mit $\cos (2π·f_{+1}·t)$ repräsentiert, im Bereich $T$ ... $2T$ wird dagegen der ebenfalls positive Koeffizient $a_2 = +1$ durch die um $π$ verschobene Funktion $\ –\cos (2π·f_{+1}·t)$ dargestellt.
- Der Modulationsindex $h = 0.5$ von Signal $s_{\rm D}(t)$ ist der kleinste Wert, der eine orthogonale FSK ermöglicht ⇒ Bezeichnung Minimum Shift Keying $\rm (MSK)$. Bei MSK sind bei jeder Symbolgrenze – je nach den vorherigen Symbolen – vier unterschiedliche Anfangsphasen möglich.
Zur Verdeutlichung des hier dargelegten Sachverhaltens gibt es das interaktive Applet Frequency Shift Keying & Continuous Phase Modulation (CPM).
MSK – Minimum Shift Keying
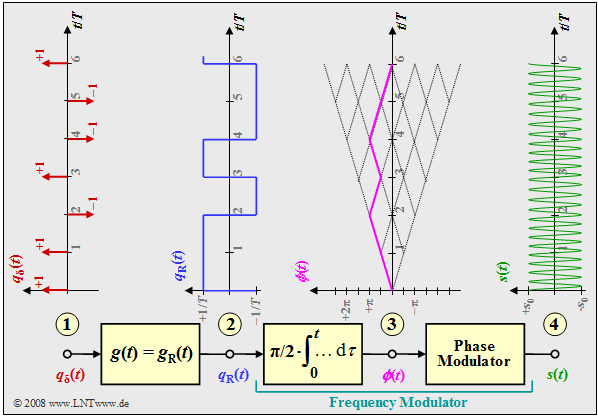
Die Grafik zeigt das Blockschaltbild zur Erzeugung einer MSK–Modulation und typische Signalverläufe an verschiedenen Punkten des MSK–Senders. Man erkennt
- das digitale Quellensignal am Punkt (1), eine Folge von Diracimpulsen im Abstand $T$, gewichtet mit den Koeffizienten $a_ν ∈ \{–1, +1\}$:
- $$q_\delta(t) = \sum_{\nu = - \infty}^{+\infty}a_{ \nu} \cdot \delta (t - \nu \cdot T)\hspace{0.05cm},$$
- das Rechtecksignal $q_{\rm R}(t)$ am Punkt (2) nach Faltung mit dem Rechteckimpuls $g(t)$ der Dauer $T$ und der Höhe $1/T$:
- $$q_{\rm R}(t) = \sum_{\nu = - \infty}^{+\infty}a_{ \nu} \cdot g (t - \nu \cdot T)\hspace{0.05cm},$$
- den Frequenzmodulator (Integrator und nachgeschalteter Phasenmodulator). Für das Signal am Punkt (3) gilt:
- $$\phi(t) = {\pi}/{2}\cdot \int_{0}^{t} q_{\rm R}(\tau)\hspace{0.1cm} {\rm d}\tau \hspace{0.05cm}.$$
Die Phasenwerte bei Vielfachen der Symboldauer $T$ sind Vielfache von $π/2$, wobei der für das MSK–Verfahren gültige Modulationsindex $h = 0.5$ berücksichtigt ist. Der Phasenverlauf ist linear. Daraus ergibt sich das MSK–Signal am Punkt (4) des Blockschaltbildes zu
- $$s(t) = s_0 \cdot \cos (2 \pi f_{\rm T} \hspace{0.05cm}t + \phi(t)) = s_0 \cdot \cos (2 \pi \cdot t \cdot (f_{\rm T}+a_{ \nu} \cdot {\rm \Delta}f_{\rm A} )) \hspace{0.05cm}.$$
Realisierung der MSK als Offset–QPSK
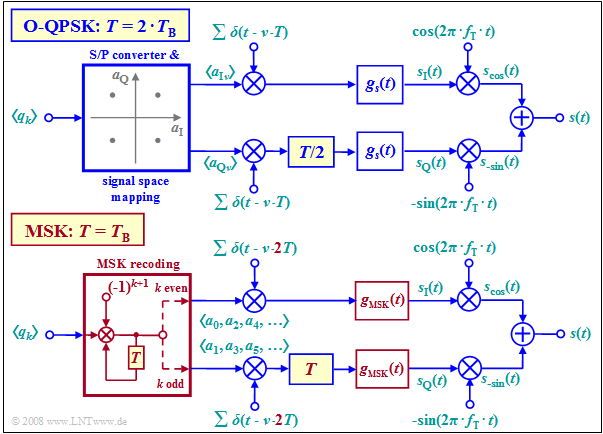
Durch einen modifizierten Betrieb von Offset–QPSK $\rm (O–QPSK)$ lässt sich auch Minimum Shift Keying $\rm (MSK)$ realisieren.
Gegenüber dem herkömmlichen Offset–QPSK–Betrieb (obere Grafik) sind folgende Modifikationen zu berücksichtigen, die in der unteren Grafik rot hervorgehoben sind:
- Die Symboldauer $T$ der MSK ist gleich der Bitdauer $T_{\rm B}$ des binären Eingangssignals, während bei der originären O–QPSK $T = 2 \cdot T_{\rm B}$ gilt.
- Anstelle der Seriell–Parallel–Wandlung und Signalraumzuordnung müssen nun die Quellensymbole umcodiert werden:
- $$a_k = (–1)^{k+1} · a_{k–1} · q_k.$$
- Alle Amplitudenkoeffizienten $a_k$ mit geradzahligem Index $(a_0,\ a_2$, ...$)$ werden dem Diracpuls im oberen Zweig eingeprägt, während $a_1,\ a_3$, ... im unteren Zweig übertragen werden.
- Der Abstand der einzelnen Diracimpulse beträgt nun $2T$ anstelle von $T$ und der Versatz ("Offset") im Quadraturzweig ist nicht mehr $T/2$, sondern $T$. In beiden Fällen ist der Offset gleich $T_{\rm B}$.
- Während beim herkömmlichen O–QPSK–Betrieb jeder beliebige Grundimpuls $g_s(t)$ möglich ist, zum Beispiel ein Rechteck– oder ein Wurzel–Nyquist–Impuls, gibt es für den MSK–Betrieb nur einen einzigen geeigneten Grundimpuls. Dieser erstreckt sich über zwei Symboldauern:
- $$g_{\rm MSK}(t) = \left\{ \begin{array}{l} s_0 \cdot \cos \big ({\pi/2 \cdot t}/T \big ) \\ 0 \\ \end{array} \right.\quad \begin{array}{*{5}c}{\rm{f\ddot{u}r}} \\{\rm{f\ddot{u}r}} \\ \end{array}\begin{array}{*{10}c} -T \le t \le +T \hspace{0.05cm}, \\ {\rm sonst}\hspace{0.05cm}. \\ \end{array}$$
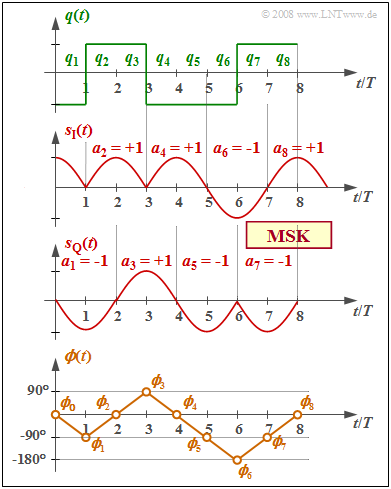
$\text{Beispiel 2:}$
- Die Grafik zeigt oben das binäre bipolare Quellensignal $q(t)$,
- in der Mitte die äquivalenten TP–Signale $s_{\rm I}(t)$ und $s_{\rm Q}(t)$ im $\rm I$– und $\rm Q$–Zweig,
- unten den Phasenverlauf $ϕ(t)$ des gesamten MSK–Sendesignals $s(t)$.
Die Umcodierung $a_k = (–1)^{k+1} · a_{k–1} · q_k$ ist bereits berücksichtigt, ebenso der MSK–Grundimpuls:
- $$g_{\rm MSK}(t) = \left\{ \begin{array} {l} s_0 \cdot \cos ({\pi \cdot t}/{2 \cdot T}) \\ 0 \\ \end{array} \right.\quad \begin{array}{*{5}c}{\rm{f\ddot{u}r} } \\{\rm{f\ddot{u}r} } \\ \end{array}\begin{array}{*{10}c} -T \le t \le +T \hspace{0.05cm}, \\ {\rm sonst}\hspace{0.05cm}. \\ \end{array}$$
Man erkennt aus dem Vergleich des obersten und des untersten Diagramms:
- Der MSK–Phasenverlauf $ϕ(t)$ ist abschnittsweise linear und steigt bzw. fällt innerhalb einer jeden Symboldauer um $90^\circ \ (π/2)$, je nachdem, ob gerade $q_k = +1$ oder $q_k = -1$ anliegt.
- Das Sendesignal $s(t)$ beinhaltet abschnittsweise die beiden Frequenzen $f_{\rm T} ± 1/(4T)$. Es hat prinzipiell den gleichen Verlauf wie das Signal $s_{\rm D}(t)$ im Abschnitt Binäre FSK mit kontinuierlicher Phasenanpassung.
Diese Form der MSK–Realisierung können Sie mit dem interaktiven Applet
bei folgenden Einstellungen darstellen:
- Offset–QPSK,
- MSK–Zuordnung,
- Cosinusimpuls.
General Description of Continuous Phase Modulation
Wir gehen weiter davon aus, dass die Quelle durch die Amplitudenkoeffizienten $a_ν$ charakterisiert wird. Diese können sowohl binär als auch $M$–stufig sein. Sie sind aber stets bipolar zu betrachten, zum Beispiel $a_ν\in \{+1, -1\}$.
- Die Phasenfunktion $ϕ(t)$ kann bei Continuous Phase Modulation $\rm (CPM)$ allgemein in folgender Form dargestellt werden $(h$ bezeichnet den Modulationsindex$)$:
- $$\phi(t) = {\pi}\cdot h \cdot\int_{-\infty}^{t} \sum_{\nu = - \infty}^{+\infty}a_{ \nu} \cdot g (\tau - \nu \cdot T)\hspace{0.1cm} {\rm d}\tau \hspace{0.05cm}.$$
- In dieser Darstellung bezeichnet $g(t)$ den Frequenzimpuls, der folgende Bedingung erfüllen muss:
- $$\int_{-\infty}^{+\infty} g (t)\hspace{0.1cm} {\rm d}t = 1 \hspace{0.05cm}.$$
- Mit dem Phasenimpuls $g_ϕ(t)$ gilt aber auch der folgende Zusammenhang:
- $$\phi(t) = {\pi}\cdot h \cdot \sum_{\nu = - \infty}^{+\infty}a_{ \nu} \cdot g_\phi (t - \nu \cdot T),\hspace{0.2cm}{\rm wobei}\hspace{0.2cm}g_\phi(t) = \int_{-\infty}^{t} g (\tau )\hspace{0.1cm} {\rm d}\tau\hspace{0.05cm}.$$
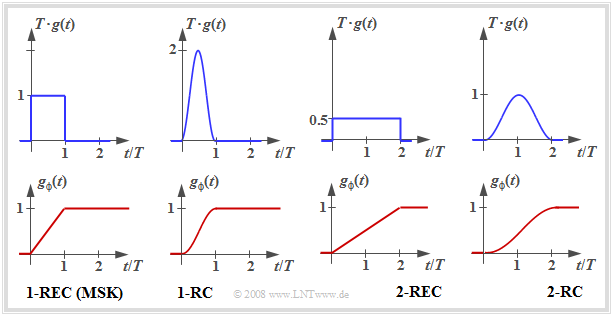
Durch geeignete Wahl der Impulse $g(t)$ bzw. $g_ϕ(t)$ lassen sich viele CPM–Varianten realisieren. Einige davon sind nachfolgend dargestellt.
- Die Grafik zeigt jeweils oben den CPM–Frequenzimpuls $g(t)$ und unten den CPM–Phasenimpuls $g_ϕ(t)$.
- Die beiden linken Grafiken beschreiben die $\rm MSK$.
- Die Bezeichnung $\rm 1–REC$ gibt an, dass $g(t)$ sich über eine einzige Symboldauer $(T)$ erstreckt und rechteckförmig ist.
Die weiteren CPM–Varianten wurden mit dem Ziel entworfen, die bereits kleine Bandbreite des MSK–Signals weiter zu verringern:
- Bei $\rm 1–RC$ ergibt sich allein durch den „weicheren” Raised–Cosine–Impuls $g(t)$ gegenüber dem Rechteck ein schmaleres Leistungsdichtespektrum.
- Bei $\rm 2–RC$ und $\rm 2–REC$ handelt es sich um "Partial–Response"–Impulse, jeweils über $2T$. Dadurch wird der Phasenverlauf weicher. Es wird aber auch die Demodulation erschwert, da in das Datensignal gezielte Pseudomehrstufigkeiten eingebracht werden.
Die Berechnung der CPM–Verfahren im Spektralbereich ist im allgemeinen kompliziert. Nur der Sonderfall „MSK” führt zu einfach handhabbaren Gleichungen, wie in der Aufgabe A4.14 gezeigt wird.
$\text{Fazit:}$ Die Continuous Phase Modulation $\rm (CPM)$ ist keine Phasenmodulation, sondern ist eine nichtlineare digitale Frequenzmodulation $\rm (FSK)$, mit dem Ziel
- eine konstante Betragseinhüllende zu garantieren (Einbrüche der Hüllkurve führen schon bei geringen Nichtlinearitäten zu Problemen),
- einen stetigen Phasenverlauf zu ermöglichen (Phasensprünge verbreitern das Spektrum).
Für genauere Informationen verweisen wir auf die Fachliteratur, zum Beispiel auf das empfehlenswerte Buch [Kam04][2].
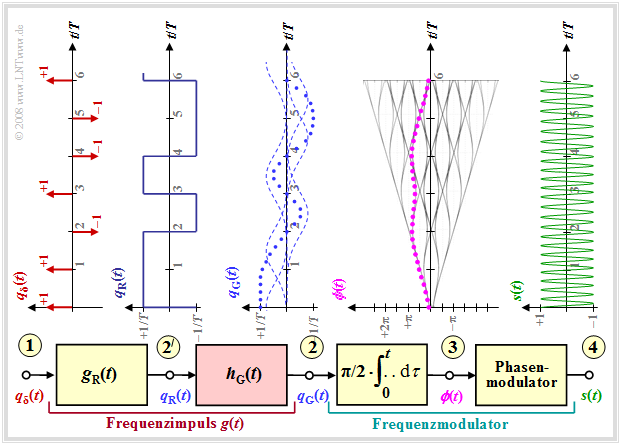
GMSK – Gaussian Minimum Shift Keying
Ein Vorteil der MSK ist der geringe Bandbreitenbedarf, weil: Bandbreite ist stets teuer.
- Durch eine geringfügige Modifikation hin zum Gaussian Minimum Shift Keying $\rm (GMSK)$ wird das Spektrum weiter verschmälert.
- Diese Modulationsart wird zum Beispiel beim Mobilfunkstandard GSM angewendet.
Aus der Grafik erkennt man:
- Der Frequenzimpuls $g(t)= g_{\rm G}(t)$ ist nun nicht mehr rechteckförmig wie $g_{\rm R}(t)$, sondern weist flachere Flanken auf.
- Dadurch ergibt sich ein weicherer Phasenverlauf am Punkt (3) als bei MSK, bei dem $ϕ(t)$ symbolweise linear ansteigt / abfällt.
- Man erreicht die sanfteren GMSK–Phasenübergänge durch einen Gaußtiefpass. Dessen Frequenzgang und Impulsantwort lauten mit der systemtheoretischen Grenzfrequenz $f_{\rm G}$:
- $$H_{\rm G}(f) = {\rm e}^{-\pi\cdot (\frac{f}{2 \cdot f_{\rm G}})^2} \hspace{0.2cm}\bullet\!\!-\!\!\!-\!\!\!-\!\!\circ\, \hspace{0.2cm} h_{\rm G}(t) = 2 f_{\rm G} \cdot {\rm e}^{-\pi\cdot (2 \cdot f_{\rm G}\cdot t)^2}\hspace{0.05cm}.$$
- Der resultierende Frequenzimpuls $g(t)$ am Punkt (2) ergibt sich aus der Faltung von $g_{\rm R}(t)$ und $h_{\rm G}(t)$.
- Das Signal $s(t)$ am Punkt (4) weist bei GMSK nun nicht mehr abschnittsweise (je Symboldauer) eine konstante Frequenz auf wie bei MSK, auch wenn dies aus obiger Grafik mit bloßem Auge schwer zu erkennen ist.
$\text{Beispiel 3:}$ Beim GSM–Verfahren ist die 3dB–Grenzfrequenz mit $f_{\rm 3dB} = 0.3/T$ spezifiziert, wobei zwischen der systemtheoretischen und der 3dB–Grenzfrequenz folgender Zusammenhang besteht:
- $$H_{\rm G}(f= f_{\rm 3 \hspace{0.03cm}dB}) = {\rm e}^{-\pi\cdot ({f_{\rm 3 \hspace{0.03cm}{dB} } }/{2 f_{\rm G} })^2} = {1}/{\sqrt{2} }$$
- $$\Rightarrow\hspace{0.15cm} f_{\rm 3 dB} = f_{\rm G} \cdot \sqrt { {4}/{\pi}\cdot {\rm ln }\sqrt{2} }\approx {2}/{3}\cdot f_{\rm G} \hspace{0.05cm}.$$
Aus $f_{\rm 3dB} = 0.3/T$ folgt damit auch $f_{\rm G} · T ≈ 0.45$.
Aufgaben zum Kapitel
Aufgabe 4.13: FSK–Demodulation
Aufgabe 4.14: Phasenverlauf der MSK
Aufgabe 4.14Z: Offset–QPSK vs. MSK
Aufgabe 4.15: MSK im Vergleich mit BPSK und QPSK
Aufgabe 4.15Z: MSK–Grundimpuls und MSK-Spektrum
Aufgabe 4.16: Vergleich zwischen binärer PSK und binärer FSK
Quellenverzeichnis
