Difference between revisions of "Modulation Methods/Quadrature Amplitude Modulation"
| (64 intermediate revisions by 4 users not shown) | |||
| Line 1: | Line 1: | ||
{{Header | {{Header | ||
| − | |Untermenü= | + | |Untermenü=Digital Modulation Methods |
| − | |Vorherige Seite= | + | |Vorherige Seite=Linear_Digital_Modulation |
| − | |Nächste Seite= | + | |Nächste Seite=Non-Linear_Digital_Modulation |
}} | }} | ||
| − | == | + | ==General description and signal space allocation== |
<br> | <br> | ||
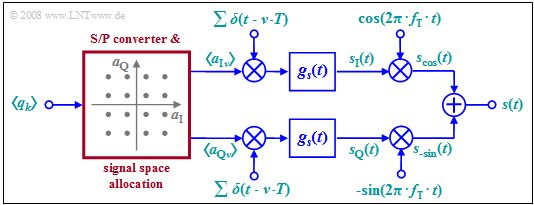
| − | + | Due to the orthogonality of cosine and (minus) sine, two data streams can be transmitted independently via the same transmission channel. The diagram shows the general circuit schematic. | |
| + | [[File: EN_Mod_T_4_3_S1.png|right|frame| Linear modulator with $\rm I$ and $\rm Q$–components; signal space for $\text{16-QAM}$]] | ||
| − | + | This very general model can be described as follows: | |
| − | + | *The binary source symbol sequence $〈q_k〉$ with bit rate $R_{\rm B}$ is applied to the input. Thus, the time interval between two symbols is $T_{\rm B} = 1/R_{\rm B}$. | |
| − | + | *Two multi-level amplitude coefficients $a_{{\rm I}ν}$ and $a_{{\rm Q}ν}$ are derived from each $b$ binary input symbols $q_k$, where $\rm I$ stands for "inphase component" and $\rm Q$ stands for "quadrature component". | |
| − | * | + | *If $b$ is even and the signal space allocation is quadratic, then the coefficients $a_{{\rm I}ν}$ and $a_{{\rm Q}ν}$ can each take on one of the $M = 2^{b/2}$ amplitude values with equal probability. This is then referred to as »'''quadrature amplitude modulation'''« $\rm (QAM)$. |
| − | * | + | *The example considered in the graph is for the $\text{16-QAM}$ with $b = M = 4$ and correspondingly $M^2 =16$ signal space points. For a $\text{256-QAM}$, $b = 8$ and $M = 16$ would apply: $2^b = M^2 = 256$. |
| − | * | + | *Next, the coefficients $a_{{\rm I}ν}$ and $a_{{\rm Q}ν}$ are each applied to a [[Signal_Representation/Discrete-Time_Signal_Representation#Dirac_comb_in_time_and_frequency_domain|$\text{Dirac comb}$]] as pulse weights. Thus, after pulse shaping with the basic transmission pulse $g_s(t)$, the following holds for both branches of the circuit diagram: |
| − | * | ||
| − | * | ||
:$$s_{\rm I}(t) = \sum_{\nu = - \infty}^{+\infty}a_{\rm I\hspace{0.03cm}\it \nu} \cdot g_s (t - \nu \cdot T)\hspace{0.05cm},\hspace{1cm}s_{\rm Q}(t) = \sum_{\nu = - \infty}^{+\infty}a_{\rm | :$$s_{\rm I}(t) = \sum_{\nu = - \infty}^{+\infty}a_{\rm I\hspace{0.03cm}\it \nu} \cdot g_s (t - \nu \cdot T)\hspace{0.05cm},\hspace{1cm}s_{\rm Q}(t) = \sum_{\nu = - \infty}^{+\infty}a_{\rm | ||
Q\hspace{0.03cm}\it \nu} \cdot g_s (t - \nu \cdot T)\hspace{0.05cm}.$$ | Q\hspace{0.03cm}\it \nu} \cdot g_s (t - \nu \cdot T)\hspace{0.05cm}.$$ | ||
| − | * | + | *Note that because of the redundancy–free conversion, the symbol duration $T$ of these signals is larger by a factor of $b$ than the bit duration $T_{\rm B}$ of the binary source signal. In the illustrated $\text{16-QAM}$ example, $T = 4 · T_{\rm B}$ holds. |
| − | * | + | *The QAM transmitted signal $s(t)$ is then the sum of the two signals multiplied by cosine and minus-sine, respectively: |
:$$s_{\rm cos}(t) = s_{\rm I}(t) \cdot \cos(2 \pi f_{\rm T} t), \hspace{1cm} s_{\rm -sin}(t) = -s_{\rm Q}(t) \cdot \sin(2 \pi f_{\rm T} t)$$ | :$$s_{\rm cos}(t) = s_{\rm I}(t) \cdot \cos(2 \pi f_{\rm T} t), \hspace{1cm} s_{\rm -sin}(t) = -s_{\rm Q}(t) \cdot \sin(2 \pi f_{\rm T} t)$$ | ||
:$$\Rightarrow \hspace{0.3cm}s(t) = s_{\rm cos}(t)+ s_{\rm -sin}(t) = | :$$\Rightarrow \hspace{0.3cm}s(t) = s_{\rm cos}(t)+ s_{\rm -sin}(t) = | ||
| Line 27: | Line 26: | ||
{{BlaueBox|TEXT= | {{BlaueBox|TEXT= | ||
| − | $\text{ | + | $\text{Conclusion:}$ These statements can be summarized as follows: |
| − | * | + | *The two transmission branches $\rm (I,\ Q)$ can be thought of as two completely separate $M$-level ASK systems <br>that do not interfere with each other as long as all components are optimally designed. |
| − | * | + | *Quadrature amplitude modulation thus makes it (ideally) possible to double the data rate while maintaining the same quality. }} |
| − | == | + | ==System description using the equivalent low-pass signal== |
<br> | <br> | ||
| − | + | Since the multiplication of $s_{\rm I}(t)$ and $s_{\rm Q}(t)$ with a cosine or a minus-sine oscillation only causes a shift in the frequency domain and such a shift is a linear operation, the system description can be greatly simplified using equivalent low-pass signals. | |
| − | + | [[File:P_ID1708__Mod_T_4_3_S2_Ganz_neu.png |right|frame| Linear modulator $(\rm I$ and $\rm Q$ components$)$ in the equivalent low-pass range]] | |
| − | + | #The graph shows the simplified model in the baseband. This is equivalent to the block diagram considered so far. | |
| − | + | #The serial-parallel conversion and the signal space allocation drawn in red in [[Modulation_Methods/Quadrature_Amplitude_Modulation#General_description_and_signal_space_allocation|"the block diagram in the last section"]] are retained. This block is no longer drawn here. | |
| − | + | #We also initially disregard the band-pass $H_{\rm BP}(f)$, which is often introduced for technical reasons. | |
| − | + | <br clear=all> | |
| − | + | Please note the following: | |
| − | + | *All double arrows in the baseband model denote complex quantities. The operations associated with them should also be understood as complex. For example, the complex amplitude coefficient $a_ν$ combines one inphase and one quadrature coefficient: | |
| − | * | ||
:$$a_\nu = a_{\rm I\hspace{0.03cm}\it \nu} + {\rm j} \cdot a_{\rm | :$$a_\nu = a_{\rm I\hspace{0.03cm}\it \nu} + {\rm j} \cdot a_{\rm | ||
Q\hspace{0.03cm}\it \nu} \hspace{0.05cm}.$$ | Q\hspace{0.03cm}\it \nu} \hspace{0.05cm}.$$ | ||
| − | * | + | *The equivalent low–pass representation of the actual, physical and thus per se real transmitted QAM signal $s(t)$ is always complex and with the partial signals $s_{\rm I}(t)$ and $s_{\rm Q}(t)$ it holds for the equivalent low-pass signal $($German: "äquivalentes Tiefpass–Signal" ⇒ subscript: "TP"$)$: |
:$$s_{\rm TP}(t) = s_{\rm I}(t) + {\rm j} \cdot s_{\rm Q}(t) = \sum_{\nu = - \infty}^{+\infty} a_\nu \cdot g_s (t - \nu \cdot T)\hspace{0.05cm}.$$ | :$$s_{\rm TP}(t) = s_{\rm I}(t) + {\rm j} \cdot s_{\rm Q}(t) = \sum_{\nu = - \infty}^{+\infty} a_\nu \cdot g_s (t - \nu \cdot T)\hspace{0.05cm}.$$ | ||
| − | * | + | *The analytical signal $s_+(t)$ is obtained from the equivalent low-pass signal $s_{\rm TP}(t)$ by multiplying by the complex exponential function. The physical signal $s(t)$ is then obtained as the real part of $s_+(t)$. |
| − | * | + | *In order for the signs in the block diagram in the previous section and the sketched baseband model here to match, multiplication by the negative sine wave is required in the quadrature branch, as shown in the following calculation: |
:$$s(t) = {\rm Re}[s_{\rm +}(t)] = {\rm Re}[s_{\rm TP}(t) \cdot{\rm e}^{{\rm j}2\pi f_{\rm T} t}] $$ | :$$s(t) = {\rm Re}[s_{\rm +}(t)] = {\rm Re}[s_{\rm TP}(t) \cdot{\rm e}^{{\rm j}2\pi f_{\rm T} t}] $$ | ||
:$$\Rightarrow \hspace{0.3cm} s(t) = {\rm Re} \left[\left ( \sum (a_{\rm I\hspace{0.03cm}\it \nu} + {\rm j} \cdot a_{\rm Q\hspace{0.03cm}\it \nu} ) \cdot g_s (t - \nu \cdot T)\right )\left ( \cos(2 \pi f_{\rm T} t) + {\rm j} \cdot \sin(2 \pi f_{\rm T} t) \right )\right]= s_{\rm I}(t) \cdot \cos(2\pi f_{\rm T} t) - s_{\rm Q}(t) \cdot \sin(2 \pi f_{\rm T} t) \hspace{0.05cm}.$$ | :$$\Rightarrow \hspace{0.3cm} s(t) = {\rm Re} \left[\left ( \sum (a_{\rm I\hspace{0.03cm}\it \nu} + {\rm j} \cdot a_{\rm Q\hspace{0.03cm}\it \nu} ) \cdot g_s (t - \nu \cdot T)\right )\left ( \cos(2 \pi f_{\rm T} t) + {\rm j} \cdot \sin(2 \pi f_{\rm T} t) \right )\right]= s_{\rm I}(t) \cdot \cos(2\pi f_{\rm T} t) - s_{\rm Q}(t) \cdot \sin(2 \pi f_{\rm T} t) \hspace{0.05cm}.$$ | ||
| − | * | + | *The influence of the band-pass $H_{\rm BP}(f)$, which in practice often has to be considered at the output of the QAM modulator, can be assigned to the pulse shape filter $g_s(t)$. If the passband of the band-pass filter is symmetric about $f_{\rm T}$, its low-pass equivalent (in the time domain) $h_{\rm BP\ →\ TP}(t)$ is purely real and one can replace $g_s(t)$ with $g_s(t) \star h_{\rm BP\ →\ TP}(t)$ in the model. |
| − | == | + | ==Power and energy of QAM signals== |
<br> | <br> | ||
| − | + | As shown in the chapter [[Signal_Representation/Equivalent_Low-Pass_Signal_and_its_Spectral_Function|"Equivalent Low-Pass Signal and its Spectral Function"]] in the book "Signal Representation", the »'''power'''« of the transmitted QAM signal $s(t)$ can also be calculated from the equivalent low-pass signal $s_{\rm TP}(t)$, which is always complex. Thus, it is equally valid to write: | |
:$$P = \lim_{T_{\rm M} \rightarrow \infty} \frac{\rm 1}{T_{\rm M}}\cdot \int_{-T_{\rm M}/2}^{+T_{\rm M}/2} s^2(t)\,{\rm d} t = {\rm 1}/{2} \cdot \lim_{T_{\rm M} \rightarrow \infty} \frac{\rm 1}{T_{\rm M}}\cdot \int_{-T_{\rm M}/2}^{+T_{\rm M}/2} |s_{\rm TP}(t)|^2\,{\rm d} t \hspace{0.05cm}.$$ | :$$P = \lim_{T_{\rm M} \rightarrow \infty} \frac{\rm 1}{T_{\rm M}}\cdot \int_{-T_{\rm M}/2}^{+T_{\rm M}/2} s^2(t)\,{\rm d} t = {\rm 1}/{2} \cdot \lim_{T_{\rm M} \rightarrow \infty} \frac{\rm 1}{T_{\rm M}}\cdot \int_{-T_{\rm M}/2}^{+T_{\rm M}/2} |s_{\rm TP}(t)|^2\,{\rm d} t \hspace{0.05cm}.$$ | ||
| − | + | In contrast, the energy of the unbounded signals $s(t)$ and $s_{\rm TP}(t)$ is infinite. | |
| − | + | However, if we restrict ourselves to a symbol duration $T$, we obtain the »'''energy per symbol'''«: | |
:$$E_{\rm S} = \frac{{\rm E}[\hspace{0.05cm}|a_{\nu} |^2\hspace{0.05cm}]}{2}\cdot \int_{-\infty}^{+\infty} |g_s(t)|^2\,{\rm d} t = \frac{{\rm E}[|a_{\nu} |^2]}{2}\cdot \int_{-\infty}^{+\infty} |G_s(f)|^2\,{\rm d} f \hspace{0.05cm}.$$ | :$$E_{\rm S} = \frac{{\rm E}[\hspace{0.05cm}|a_{\nu} |^2\hspace{0.05cm}]}{2}\cdot \int_{-\infty}^{+\infty} |g_s(t)|^2\,{\rm d} t = \frac{{\rm E}[|a_{\nu} |^2]}{2}\cdot \int_{-\infty}^{+\infty} |G_s(f)|^2\,{\rm d} f \hspace{0.05cm}.$$ | ||
| − | + | On the other hand, $E_{\rm B} = E_{\rm S}/b$ gives the »'''energy per bit'''« if according to the signal space assignment, $b$ binary symbols are combined to the complex coefficient $a_\nu$. | |
| − | |||
{{GraueBox|TEXT= | {{GraueBox|TEXT= | ||
| − | $\text{ | + | [[File:P_ID1710__Mod_T_4_3_S3a.png |right|frame| Allocation for $\text{16-QAM}$]] |
| + | |||
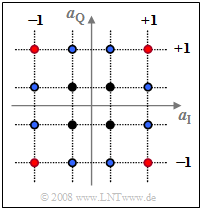
| + | $\text{Example 1:}$ The upper graph shows the signal space allocation for $\text{16-QAM}$, where both the real and imaginary parts of the complex amplitude coefficients $a_ν$ can take one of four values $±1$ as well as $±1/3$ , respectively. | ||
| − | + | Averaging over the $16$ squared distances to the origin yields: | |
| − | :$${\rm E}\big[\hspace{0.05cm} \vert a_{\nu}\vert^2 \hspace{0.05cm}\big] \hspace{0.18cm} = \hspace{0.18cm} \frac{4}{16} \cdot | + | :$${\rm E}\big[\hspace{0.05cm} \vert a_{\nu}\vert^2 \hspace{0.05cm}\big] \hspace{0.18cm} = \hspace{0.18cm} \frac{4}{16} \cdot \left [1^2 + 1^2\right ]+ \frac{4}{16} \cdot \left[(1/3 )^2 +(1/3)^2 \right ] |
+ \frac{8}{16} \cdot \left [1^2 + (1/3)^2\right ] $$ | + \frac{8}{16} \cdot \left [1^2 + (1/3)^2\right ] $$ | ||
:$$\Rightarrow \hspace{0.3cm}{\rm E}\big[\hspace{0.05cm} \vert a_{\nu}\vert^2 \hspace{0.05cm}\big] = {10}/{9}\approx 1.11 \hspace{0.05cm}.$$ | :$$\Rightarrow \hspace{0.3cm}{\rm E}\big[\hspace{0.05cm} \vert a_{\nu}\vert^2 \hspace{0.05cm}\big] = {10}/{9}\approx 1.11 \hspace{0.05cm}.$$ | ||
| − | + | In this order, the summands belong to | |
| − | * | + | *the four red, |
| − | * | + | *the four black, and |
| − | * | + | *the eight blue dots. |
| − | + | [[File:P_ID2964__Mod_T_4_3_S3b_Ganz_neu.png |right|frame| NRZ rectangular basic pulse]] | |
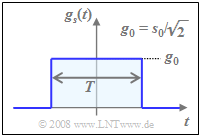
| − | + | For a NRZ rectangular basic transmission pulse $g_s(t)$ with amplitude $g_0$ and symbol duration $T$, the spectrum $G_s(f)$ is $\rm sinc$–shaped. In this case, the following holds for | |
| − | In | ||
| − | * | + | *the average energy per symbol: |
:$$E_{\rm S} = 1/2 \cdot {\rm E}\big[\hspace{0.05cm}\vert a_{\nu} \vert ^2 \big]\hspace{0.05cm}\cdot | :$$E_{\rm S} = 1/2 \cdot {\rm E}\big[\hspace{0.05cm}\vert a_{\nu} \vert ^2 \big]\hspace{0.05cm}\cdot | ||
g_0^2 \cdot T = {5}/{9}\cdot g_0^2 \cdot T \hspace{0.05cm}\approx 0.555 \cdot g_0^2 \cdot T \hspace{0.05cm},$$ | g_0^2 \cdot T = {5}/{9}\cdot g_0^2 \cdot T \hspace{0.05cm}\approx 0.555 \cdot g_0^2 \cdot T \hspace{0.05cm},$$ | ||
| − | * | + | *the average energy per bit: |
:$$E_{\rm B} ={E_{\rm S} }/{4}= {5}/{36}\cdot g_0^2 \cdot T \approx 0.139 \cdot g_0^2 \cdot T \hspace{0.05cm}.$$ | :$$E_{\rm B} ={E_{\rm S} }/{4}= {5}/{36}\cdot g_0^2 \cdot T \approx 0.139 \cdot g_0^2 \cdot T \hspace{0.05cm}.$$ | ||
| − | + | The "maximum envelope" $s_0$ of the transmitted signal $s(t)$ is larger than the amplitude $g_0$ of the rectangular pulse by a factor of $\sqrt{2}$ (see bottom sketch) and occurs at one of the four red amplitude coefficients, i.e., whenever $\vert a_{\rm I \it ν}\vert = \vert a_{\rm Q \it ν}\vert =1$.}} | |
| − | == | + | ==Signal waveforms for 4–QAM== |
<br> | <br> | ||
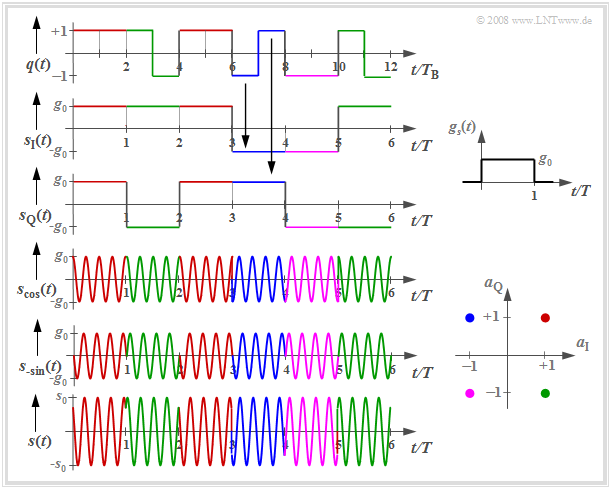
| − | + | The following graph shows the signal waveforms of $\rm 4-QAM$, where the coloring corresponds to the signal space allocation defined above. | |
| − | [[File:P_ID1711__Mod_T_4_3_S4_neu.png|right|frame| | + | [[File:P_ID1711__Mod_T_4_3_S4_neu.png|right|frame| Signal waveforms for $\text{4-QAM}$]] |
| − | + | One can see from these plots: | |
| − | * | + | *The serial-to-parallel $\rm (S/P)$ conversion of the source signal $q(t)$ into the two component signals $s_{\rm I}(t)$ and $s_{\rm Q}(t)$, each with symbol duration $T = 2T_{\rm B}$ and signal values $±g_0$. Here, $T_{\rm B}$ denotes the "bit duration". |
| − | * | + | *The two phase modulated signals $s_{\rm cos}(t)$ and $s_{\rm –sin}(t)$ with phase jumps around $±π$: |
:$$s_{\rm cos} (t) = s_{\rm I} (t) \cdot \cos(2\pi f_{\rm T}t)\hspace{0.05cm},$$ | :$$s_{\rm cos} (t) = s_{\rm I} (t) \cdot \cos(2\pi f_{\rm T}t)\hspace{0.05cm},$$ | ||
| − | :$$s_{\rm -sin} (t) = -s_{\rm Q} (t) \cdot \sin(2\pi f_{\rm T}t)\hspace{0.05cm} | + | :$$s_{\rm -sin} (t) = -s_{\rm Q} (t) \cdot \sin(2\pi f_{\rm T}t)\hspace{0.05cm}. $$ |
| − | * | + | *The QAM signal $s(t) = s_{\rm cos}(t) \ – \ s_{\rm –sin}(t)$ with phase jumps by multiples of $±π/2$; their envelope is larger than the two component signals by a factor of $\sqrt{2}$: |
:$$s_0 = \sqrt{2} \cdot g_0 \hspace{0.05cm}.$$ | :$$s_0 = \sqrt{2} \cdot g_0 \hspace{0.05cm}.$$ | ||
| − | + | *Here, the basic transmission pulse $g_s(t)$ is assumed to be rectangular between $0$ and $T$, i.e., asymmetric with respect to $t = 0$, for simplicity of representation. The associated spectral function $G_s(f)$ of this causal pulse $g_s(t)$ is complex, though this has no implications in this context. | |
| − | * | ||
| − | |||
<br clear=all> | <br clear=all> | ||
| − | == | + | ==Error probabilities of 4–QAM== |
<br> | <br> | ||
| − | + | In the earlier section [[Modulation_Methods/Linear_Digital_Modulation#Error_probabilities_-_a_brief_overview|"Error probabilities – a brief overview"]], the bit error probability of "binary phase shift keying" $\rm (BPSK)$ was given. Now the results are transferred to $\text{4-QAM}$, where the following conditions still apply: | |
| − | [[File:P_ID1717__Mod_T_4_3_S5a_ganz_neu.png|right|frame| | + | [[File:P_ID1717__Mod_T_4_3_S5a_ganz_neu.png|right|frame|Phase diagram of $\rm BPSK$]] |
| − | * | + | *a transmitted signal with the average energy $E_{\rm B}$ per bit, |
| − | * | + | *AWGN noise with the (single-sided) noise power density $N_0$, |
| − | * | + | *the best possible receiver realization using the matched-filter principle. |
| − | + | The upper graph shows the BPSK phase diagram of the detection signal $d(t)$, i.e., including the matched filter. The distance of the useful signal from the threshold $(d_{\rm Q}$–axis$)$ is $s_0$ at each of the detection times. | |
| − | + | Using the additional equations | |
:$$p_{\rm B} = {\rm Q}\left ( {s_0}/{\sigma_d } \right ), \hspace{0.2cm} E_{\rm B} = {1}/{2} \cdot s_0^2 \cdot T_{\rm B} ,\hspace{0.2cm} \sigma_d^2 = {N_0}/{T_{\rm B} }$$ | :$$p_{\rm B} = {\rm Q}\left ( {s_0}/{\sigma_d } \right ), \hspace{0.2cm} E_{\rm B} = {1}/{2} \cdot s_0^2 \cdot T_{\rm B} ,\hspace{0.2cm} \sigma_d^2 = {N_0}/{T_{\rm B} }$$ | ||
| − | + | the »'''BPSK error probability'''« is given by: | |
$$p_{\rm B, \hspace{0.1cm}BPSK} = {\rm Q}\left ( \sqrt{{2 \cdot E_{\rm B}}/{N_0 }} \hspace{0.1cm}\right ) = {1}/{2}\cdot {\rm erfc}\left ( \sqrt{{E_{\rm B}}/{N_0 }} \hspace{0.1cm}\right ).$$ | $$p_{\rm B, \hspace{0.1cm}BPSK} = {\rm Q}\left ( \sqrt{{2 \cdot E_{\rm B}}/{N_0 }} \hspace{0.1cm}\right ) = {1}/{2}\cdot {\rm erfc}\left ( \sqrt{{E_{\rm B}}/{N_0 }} \hspace{0.1cm}\right ).$$ | ||
| − | [[File: P_ID2965__Mod_T_4_3_S5b_neu.png|right|frame| | + | [[File: P_ID2965__Mod_T_4_3_S5b_neu.png|right|frame|Phase diagram of $\text{4-QAM}$]] |
| − | + | In the $\text{4-QAM}$ corresponding to the graph below | |
| − | + | #there are two thresholds between the areas with lighter/darker background (blue line) and between the dotted/dashed areas (red line), but | |
| − | + | #the distance from each threshold is only $g_0$ instead of $s_0$, | |
| − | + | #the noise power $\sigma_d^2$ is also only half as large compared to BPSK because of the halved symbol rate in each sub-branch. | |
| − | + | Thus, with the equations | |
:$$p_{\rm B} = {\rm Q}\left ( {g_0}/{\sigma_d } \right ), \hspace{0.2cm}g_{0} = {s_0}/{\sqrt{2}}, \hspace{0.2cm}E_{\rm B} = {1}/{2} \cdot s_0^2 \cdot T_{\rm B} ,\hspace{0.2cm} | :$$p_{\rm B} = {\rm Q}\left ( {g_0}/{\sigma_d } \right ), \hspace{0.2cm}g_{0} = {s_0}/{\sqrt{2}}, \hspace{0.2cm}E_{\rm B} = {1}/{2} \cdot s_0^2 \cdot T_{\rm B} ,\hspace{0.2cm} | ||
\sigma_d^2 = {N_0}(2 \cdot T_{\rm B} )$$ | \sigma_d^2 = {N_0}(2 \cdot T_{\rm B} )$$ | ||
| − | + | one obtains the exact same result for the »'''4-QAM error probability'''« as for BPSK: | |
:$$p_{\rm B, \hspace{0.1cm}4-QAM} = {\rm Q}\left ( \sqrt{{2 \cdot E_{\rm B}}/{N_0 }} \hspace{0.1cm}\right ) = {1}/{2}\cdot {\rm erfc}\left ( \sqrt{{E_{\rm B}}/{N_0 }} \hspace{0.1cm}\right ).$$ | :$$p_{\rm B, \hspace{0.1cm}4-QAM} = {\rm Q}\left ( \sqrt{{2 \cdot E_{\rm B}}/{N_0 }} \hspace{0.1cm}\right ) = {1}/{2}\cdot {\rm erfc}\left ( \sqrt{{E_{\rm B}}/{N_0 }} \hspace{0.1cm}\right ).$$ | ||
{{BlaueBox|TEXT= | {{BlaueBox|TEXT= | ||
| − | $\text{ | + | $\text{Conclusion:}$ |
| − | * | + | *Under ideal conditions, $\text{4-QAM}$ '''has the same error probability as''' $\text{BPSK}$, although twice the amount of information can be transmitted. |
| − | * | + | *However, '''if the conditions are no longer ideal''' – for example, if there is an unwanted phase offset between transmitter and receiver – '''there is much more degradation with 4-QAM than with BPSK'''. |
| − | * | + | *This case is considered in more detail in the section [[Digital_Signal_Transmission/Linear_Digital_Modulation_-_Coherent_Demodulation#Error_probabilities_for_4.E2.80.93QAM_and_4.E2.80.93PSK|"Error probabilities for 4–QAM and 4–PSK"]] of the book "Digital Signal Transmission". }} |
| − | == | + | ==Quadratic QAM signal space constellations== |
<br> | <br> | ||
| − | + | The following figure shows the signal space constellations of $\text{4-QAM}$, $\text{16-QAM}$ and $\text{64-QAM}$. | |
| − | * | + | [[File:P_ID1713__Mod_T_4_3_S6a_Ganz_neu.png |right|frame| Signal space constellation and decision regions for $M = 4$, $M = 16$, $M = 64$;<br>Note: The figures refer only to the detection time points. The transitions between the individual points outside the detection times are not shown here.]] |
| − | * | + | *With the axis labels chosen here, the figures also describe the useful detection signal (at detection times) in the equivalent low-pass range. |
| − | * | + | *Also plotted are the various decision regions assigned to the noisy detection signal. |
| + | *The arrows indicate when decision regions are extended to infinity. | ||
| − | |||
| − | |||
| − | |||
| − | |||
| + | The figures apply to all Nyquist systems | ||
| + | *such as the "rectangular-rectangular" configuration (basic transmission pulse and receiver filter impulse response are both rectangular) | ||
| + | *or a [[Digital_Signal_Transmission/Optimization_of_Baseband_Transmission_Systems#Root_Nyquist_systems|$\text{root cosine rolloff Nyquist system}$]]. | ||
| − | + | ||
| − | + | However, the transitions between the individual points outside the detection times depend very much on the selected Nyquist system. | |
| − | + | ||
| − | + | Further things to note about these representations: | |
| − | + | #With a "true QAM structure" ⇒ a square or at least rectangular signal space configuration: <br>The "two-dimensional detection process" can be solved in a simplified way by two "one-dimensional detection processes". | |
| − | + | #$\text{16-QAM}$ is thus nothing more than the parallel transmission of two digital signals with $M = 4$ amplitude levels each. | |
| − | + | #For $\text{64-QAM}$ ⇒ $M = 8$ would apply analogously. For $\text{256-QAM}$: the "one-dimensional" number of levels is $M = 16$. | |
| + | #All the properties for redundancy-free multi-level signals mentioned in the later chapter [[Digital_Signal_Transmission/Redundancy-Free_Coding|"Redundancy-free Coding"]] also apply here. | ||
| − | == | + | ==Other signal space constellations== |
<br> | <br> | ||
| − | + | The graphic shows further signal space constellations. On the left, 4-QAM is shown according to the previous description. The next constellation to the right indicates a four-level phase modulation, which we call "4-PSK" or "QPSK". A comparison of these two diagrams on the left shows: | |
| − | [[File:P_ID1714__Mod_T_4_3_S7_neu.png |right|frame| | + | [[File:P_ID1714__Mod_T_4_3_S7_neu.png |right|frame|Further signal space constellations of ASK and PSK<br><br>]] |
| − | * | + | *The variant referred to here as $\rm QPSK$ ("Quaternary Phase Shift Keying") uses the phase positions $0^\circ$, $90^\circ$, $180^\circ$, $270^\circ$. From the plotted decision regions, it can be seen that the detection cannot be attributed to two binary decisions here. |
| − | |||
| − | |||
| − | |||
| − | |||
| − | |||
| + | |||
| + | *$\rm 4–QAM$ (left diagram) can also be understood as a four-level phase modulation $($positions $±45^\circ$, $±135^\circ)$. Compared to QPSK, there is a rotation of $±45^\circ$ $(π/4)$ ⇒ 4–QAM is also called ${\rm π/4}\text{–QPSK}$. | ||
| − | + | ||
| − | * | + | *Similarly to how one arrives at DPSK by pre-coding BPSK, "4-PSK" can also be extended to $\rm 4-DPSK$, thereby facilitating demodulation. This was used e.g. for data transmission over telephone channels ⇒ CCITT recommendation "V26" $($carrier frequency $\text{1800 Hz}$, data rate $\text{2400 bit/s)}$. |
| − | |||
| − | == | + | |
| + | The two diagrams on the right show higher-level modulation methods: | ||
| + | *The "8–PSK" (or "8–DPSK") allows a data rate of up to $\text{4800 bit/s}$ for the telephone channel according to CCITT recommendation "V27". | ||
| + | *Recommendation "V29" enables a hybrid modulation in the form of "16-ASK/PSK", which enables data rates of up to $\text{9600 bit/s}$ for permanently connected lines. | ||
| + | |||
| + | ==Nyquist and Root-Nyquist QAM systems== | ||
<br> | <br> | ||
| − | + | So far in this chapter, for reasons of easy representation, the rectangular basic transmission pulse has always been assumed. In practice, however, a »'''root-Nyquist characteristic'''« is usually used according to the [[Digital_Signal_Transmission/Optimization_of_Baseband_Transmission_Systems#Root_Nyquist_systems|$\text{description}$]] in the book "Digital Signal Transmission". Briefly, these systems can be characterized as follows: | |
| − | |||
| − | |||
| − | |||
| − | |||
| − | |||
| + | #The receiver (German: "Empfänger" ⇒ subscript; "E") frequency response $H_{\rm E}(f)$ is chosen here to be equal in shape to the (normalized) transmission pulse (German: "Sendeimpuls" ⇒ subscript; "S") spectrum $H_{\rm S}(f)$, which leads to the smallest possible error probability under the constraints of power limitation. | ||
| + | #The overall frequency response $H_{\rm Nyq}(f) = H_{\rm S}(f) · H_{\rm E}(f)$ satisfies the [[Digital_Signal_Transmission/Properties_of_Nyquist_Systems#First_Nyquist_criterion_in_the_time_domain|$\text{first Nyquist criterion}$]], so there is no intersymbol interference $\text{(ISI)}$ at the receiver. Thus, $H_{\rm S}(f)$ and $H_{\rm E}(f)$ each have a root-Nyquist characteristic. | ||
| + | #For the frequency response $H_{\rm Nyq}(f)$, one often uses a [[Linear_and_Time_Invariant_Systems/Some_Low-Pass_Functions_in_Systems_Theory#Cosine.E2.80.93square_low-pass_filter|$\text{cosine rolloff low-pass}$]] $H_{\rm CRO}(f)$ with equivalent bandwidth $Δf_{\rm CRO} = 1/T$ and freely chosen rolloff factor $ (0 ≤ r ≤ 1)$. The interactive applet [[Applets:Frequency_%26_Impulse_Responses|"Frequency and Impulse Responses"]] illustrates frequency response and impulse response of this low-pass filter. | ||
| + | #The advantage of these root-Nyquist systems is the much smaller bandwidth $(1 + r)/T$ compared to the previously considered configuration with rectangular $g_s(t)$ and rectangular $h_{\rm E}(t)$, whose spectrum is (theoretically) infinitely extended. | ||
| + | #In terms of error probability, nothing changes compared to the "rectangular-rectangular" configuration because the basic detection pulse $g_d(t)$ before the decision has equidistant zero crossings, thus avoiding intersymbol interference. | ||
| − | |||
| − | |||
| − | + | The graph shows phase diagrams for this case, taken from the book [Kam04]<ref name="Kam04">Kammeyer, K.D.: Nachrichtenübertragung. Stuttgart: B.G. Teubner, 4. Auflage, 2004.</ref>. The rolloff factor is $r = 0.5$. From these plots, one can see: | |
| − | + | [[File:EN_Mod_T_4_3_S8.png|right|frame|Phase diagram of 4-QAM with a root-Nyquist configuration]] | |
| − | |||
| − | |||
| + | *The right plot shows the detection signals in the $\rm I$ and $\rm Q$ branches after the root-Nyquist receiver filters in a two-dimensional representation. The corresponding spectra each have cosine-shaped slopes around the Nyquist frequency $f_{\rm Nyq} = 1/(2T)$. | ||
| + | *At the detection times, only the four yellow points are possible in the phase diagram. The transitions in between are diverse. It should be noted that only a few lines pass through the coordinate null point. | ||
| + | *Shown on the left are the two transmitted signals in the equivalent low-pass region, $s_{\rm I}(t) = {\rm Re}\big[s_{\rm TP}(t)\big]$ and $s_{\rm Q}(t) = {\rm Im}\big[s_{\rm TP}(t)\big]$. Due to the root-Nyquist spectral shaping, there is intersymbol interference at the transmitter, which means that the equivalent low-pass signal $s_{\rm TP}(t) = s_{\rm I}(t) + {\rm j} · s_{\rm Q}(t)$ is also not limited to four points at the detection times. | ||
| + | *The magnitude $|s_{\rm TP}(t)|$ – that is, the distance from zero – indicates the envelope of the 4-QAM signal. It can be clearly seen from the left diagram that there are strong amplitude dips especially with phase changes around $π$, since then $s_{\rm TP}(t)$ also often assumes (complex) values close to zero. | ||
| − | == | + | |
| + | ==Offset–Quadrature amplitude modulation== | ||
<br> | <br> | ||
| − | + | Taking the equations for the "$\text{4–QAM}$" $($or "$π/4\text{–QPSK}$"$)$ as our starting point, we arrive at the "$\text{Offset–4–QAM}$", which we simplify by calling "$\text{Offset–QPSK}$". Here the transmitted signal is given by: | |
:$$s(t) =s_{\rm I}(t) \cdot \cos(2 \pi f_{\rm T} t) - s_{\rm Q}(t) | :$$s(t) =s_{\rm I}(t) \cdot \cos(2 \pi f_{\rm T} t) - s_{\rm Q}(t) | ||
\cdot \sin(2 \pi f_{\rm T} t),$$ | \cdot \sin(2 \pi f_{\rm T} t),$$ | ||
:$$\hspace{0.3cm}\Rightarrow \hspace{0.3cm}s_{\rm I}(t) = \sum_{\nu = - \infty}^{+\infty}a_{\rm I\hspace{0.03cm}\it \nu} \cdot g_s (t - \nu \cdot T)\hspace{0.05cm},\hspace{0.5cm} s_{\rm Q}(t) = \sum_{\nu = - \infty}^{+\infty}a_{\rm Q\hspace{0.03cm}\it \nu} \cdot g_s (t -{T}/{2} - \nu \cdot T)\hspace{0.05cm}.$$ | :$$\hspace{0.3cm}\Rightarrow \hspace{0.3cm}s_{\rm I}(t) = \sum_{\nu = - \infty}^{+\infty}a_{\rm I\hspace{0.03cm}\it \nu} \cdot g_s (t - \nu \cdot T)\hspace{0.05cm},\hspace{0.5cm} s_{\rm Q}(t) = \sum_{\nu = - \infty}^{+\infty}a_{\rm Q\hspace{0.03cm}\it \nu} \cdot g_s (t -{T}/{2} - \nu \cdot T)\hspace{0.05cm}.$$ | ||
| − | + | The sole but decisive difference is the time shift of the quadrature component with respect to the in-phase component by half a symbol duration $(T/2)$. This has the advantage that | |
| − | * | + | *the phase function does not pass through zero, and |
| − | * | + | *the envelope $|s_{\rm TP}(t)|$ therefore fluctuates much less. |
| − | |||
{{GraueBox|TEXT= | {{GraueBox|TEXT= | ||
| − | $\text{ | + | [[File:EN_Mod_T_4_3_S9_neu.png|right|frame|Transmitter phase diagram and envelope at "$π/4$–QPSK" (above) and "Offset–QPSK" (below)]] |
| − | * | + | $\text{Example 2:}$ The upper graph shows |
| − | * | + | * the phase diagram for $π/4\hspace{-0.05cm}-\hspace{-0.05cm}\text{QPSK}$ on the left, |
| − | + | * on the right, a typical envelope curve, based on a root Nyquist spectrum with rolloff factor $r = 0.5$, as in the last section. | |
| − | + | <br><br><br> | |
| − | + | The lower graphic shows that the $\text{Offset – QPSK}$ has significantly better properties with respect to the envelope (less severe signal dips). | |
| − | + | <br><br><br> | |
| − | |||
| − | |||
| − | |||
| − | |||
| − | + | ⇒ Essential properties of "4-QAM/QPSK" and "Offset-QPSK" can be illustrated with the interactive (German language) SWF applet [[Applets:QPSK_und_Offset-QPSK_(Applet)|"QPSK and Offset-QPSK"]], where the basic pulse can be alternatively chosen as | |
| − | * | + | *a rectangular pulse, |
| − | * | + | *a cosine pulse, |
| − | * | + | *a Nyquist pulse, |
| − | * | + | *a root Nyquist pulse.}} |
| − | == | + | ==Exercises for the chapter== |
<br> | <br> | ||
| − | [[Aufgaben:Aufgabe_4.10:_Signalverläufe_der_16–QAM| | + | [[Aufgaben:Aufgabe_4.10:_Signalverläufe_der_16–QAM|Exercise 4.10: Signal Waveforms of the 16-QAM]] |
| − | [[Aufgaben:Aufgabe_4.10Z:_Signalraumkonstellation_der_16–QAM| | + | [[Aufgaben:Aufgabe_4.10Z:_Signalraumkonstellation_der_16–QAM|Exercise 4.10Z: Signal Space Constellation of the 16-QAM]] |
| − | [[Aufgaben:Aufgabe_4.11:_Frequenzbereichsbetrachtung_der_4–QAM| | + | [[Aufgaben:Aufgabe_4.11:_Frequenzbereichsbetrachtung_der_4–QAM|Exercise 4.11: Frequency Domain Consideration of the 4-QAM]] |
| − | [[Aufgaben:Aufgabe_4.11Z:_Fehlerwahrscheinlichkeit_bei_QAM| | + | [[Aufgaben:Aufgabe_4.11Z:_Fehlerwahrscheinlichkeit_bei_QAM|Exercise 4.11Z: Error Probability with QAM]] |
| − | [[Aufgaben: | + | [[Aufgaben:Exercise_4.12:_Root-Nyquist_Systems|Exercise 4.12: Root-Nyquist Systems]] |
| − | [[Aufgaben: | + | [[Aufgaben:Exercise_4.12Z:_4-QAM_Systems_again|Exercise 4.12Z: 4-QAM Systems again]] |
| − | == | + | ==References== |
<references/> | <references/> | ||
{{Display}} | {{Display}} | ||
Latest revision as of 14:50, 13 January 2023
Contents
- 1 General description and signal space allocation
- 2 System description using the equivalent low-pass signal
- 3 Power and energy of QAM signals
- 4 Signal waveforms for 4–QAM
- 5 Error probabilities of 4–QAM
- 6 Quadratic QAM signal space constellations
- 7 Other signal space constellations
- 8 Nyquist and Root-Nyquist QAM systems
- 9 Offset–Quadrature amplitude modulation
- 10 Exercises for the chapter
- 11 References
General description and signal space allocation
Due to the orthogonality of cosine and (minus) sine, two data streams can be transmitted independently via the same transmission channel. The diagram shows the general circuit schematic.
This very general model can be described as follows:
- The binary source symbol sequence $〈q_k〉$ with bit rate $R_{\rm B}$ is applied to the input. Thus, the time interval between two symbols is $T_{\rm B} = 1/R_{\rm B}$.
- Two multi-level amplitude coefficients $a_{{\rm I}ν}$ and $a_{{\rm Q}ν}$ are derived from each $b$ binary input symbols $q_k$, where $\rm I$ stands for "inphase component" and $\rm Q$ stands for "quadrature component".
- If $b$ is even and the signal space allocation is quadratic, then the coefficients $a_{{\rm I}ν}$ and $a_{{\rm Q}ν}$ can each take on one of the $M = 2^{b/2}$ amplitude values with equal probability. This is then referred to as »quadrature amplitude modulation« $\rm (QAM)$.
- The example considered in the graph is for the $\text{16-QAM}$ with $b = M = 4$ and correspondingly $M^2 =16$ signal space points. For a $\text{256-QAM}$, $b = 8$ and $M = 16$ would apply: $2^b = M^2 = 256$.
- Next, the coefficients $a_{{\rm I}ν}$ and $a_{{\rm Q}ν}$ are each applied to a $\text{Dirac comb}$ as pulse weights. Thus, after pulse shaping with the basic transmission pulse $g_s(t)$, the following holds for both branches of the circuit diagram:
- $$s_{\rm I}(t) = \sum_{\nu = - \infty}^{+\infty}a_{\rm I\hspace{0.03cm}\it \nu} \cdot g_s (t - \nu \cdot T)\hspace{0.05cm},\hspace{1cm}s_{\rm Q}(t) = \sum_{\nu = - \infty}^{+\infty}a_{\rm Q\hspace{0.03cm}\it \nu} \cdot g_s (t - \nu \cdot T)\hspace{0.05cm}.$$
- Note that because of the redundancy–free conversion, the symbol duration $T$ of these signals is larger by a factor of $b$ than the bit duration $T_{\rm B}$ of the binary source signal. In the illustrated $\text{16-QAM}$ example, $T = 4 · T_{\rm B}$ holds.
- The QAM transmitted signal $s(t)$ is then the sum of the two signals multiplied by cosine and minus-sine, respectively:
- $$s_{\rm cos}(t) = s_{\rm I}(t) \cdot \cos(2 \pi f_{\rm T} t), \hspace{1cm} s_{\rm -sin}(t) = -s_{\rm Q}(t) \cdot \sin(2 \pi f_{\rm T} t)$$
- $$\Rightarrow \hspace{0.3cm}s(t) = s_{\rm cos}(t)+ s_{\rm -sin}(t) = s_{\rm I}(t) \cdot \cos(2 \pi f_{\rm T} t) - s_{\rm Q}(t) \cdot \sin(2 \pi f_{\rm T} t) \hspace{0.05cm}.$$
$\text{Conclusion:}$ These statements can be summarized as follows:
- The two transmission branches $\rm (I,\ Q)$ can be thought of as two completely separate $M$-level ASK systems
that do not interfere with each other as long as all components are optimally designed. - Quadrature amplitude modulation thus makes it (ideally) possible to double the data rate while maintaining the same quality.
System description using the equivalent low-pass signal
Since the multiplication of $s_{\rm I}(t)$ and $s_{\rm Q}(t)$ with a cosine or a minus-sine oscillation only causes a shift in the frequency domain and such a shift is a linear operation, the system description can be greatly simplified using equivalent low-pass signals.
- The graph shows the simplified model in the baseband. This is equivalent to the block diagram considered so far.
- The serial-parallel conversion and the signal space allocation drawn in red in "the block diagram in the last section" are retained. This block is no longer drawn here.
- We also initially disregard the band-pass $H_{\rm BP}(f)$, which is often introduced for technical reasons.
Please note the following:
- All double arrows in the baseband model denote complex quantities. The operations associated with them should also be understood as complex. For example, the complex amplitude coefficient $a_ν$ combines one inphase and one quadrature coefficient:
- $$a_\nu = a_{\rm I\hspace{0.03cm}\it \nu} + {\rm j} \cdot a_{\rm Q\hspace{0.03cm}\it \nu} \hspace{0.05cm}.$$
- The equivalent low–pass representation of the actual, physical and thus per se real transmitted QAM signal $s(t)$ is always complex and with the partial signals $s_{\rm I}(t)$ and $s_{\rm Q}(t)$ it holds for the equivalent low-pass signal $($German: "äquivalentes Tiefpass–Signal" ⇒ subscript: "TP"$)$:
- $$s_{\rm TP}(t) = s_{\rm I}(t) + {\rm j} \cdot s_{\rm Q}(t) = \sum_{\nu = - \infty}^{+\infty} a_\nu \cdot g_s (t - \nu \cdot T)\hspace{0.05cm}.$$
- The analytical signal $s_+(t)$ is obtained from the equivalent low-pass signal $s_{\rm TP}(t)$ by multiplying by the complex exponential function. The physical signal $s(t)$ is then obtained as the real part of $s_+(t)$.
- In order for the signs in the block diagram in the previous section and the sketched baseband model here to match, multiplication by the negative sine wave is required in the quadrature branch, as shown in the following calculation:
- $$s(t) = {\rm Re}[s_{\rm +}(t)] = {\rm Re}[s_{\rm TP}(t) \cdot{\rm e}^{{\rm j}2\pi f_{\rm T} t}] $$
- $$\Rightarrow \hspace{0.3cm} s(t) = {\rm Re} \left[\left ( \sum (a_{\rm I\hspace{0.03cm}\it \nu} + {\rm j} \cdot a_{\rm Q\hspace{0.03cm}\it \nu} ) \cdot g_s (t - \nu \cdot T)\right )\left ( \cos(2 \pi f_{\rm T} t) + {\rm j} \cdot \sin(2 \pi f_{\rm T} t) \right )\right]= s_{\rm I}(t) \cdot \cos(2\pi f_{\rm T} t) - s_{\rm Q}(t) \cdot \sin(2 \pi f_{\rm T} t) \hspace{0.05cm}.$$
- The influence of the band-pass $H_{\rm BP}(f)$, which in practice often has to be considered at the output of the QAM modulator, can be assigned to the pulse shape filter $g_s(t)$. If the passband of the band-pass filter is symmetric about $f_{\rm T}$, its low-pass equivalent (in the time domain) $h_{\rm BP\ →\ TP}(t)$ is purely real and one can replace $g_s(t)$ with $g_s(t) \star h_{\rm BP\ →\ TP}(t)$ in the model.
Power and energy of QAM signals
As shown in the chapter "Equivalent Low-Pass Signal and its Spectral Function" in the book "Signal Representation", the »power« of the transmitted QAM signal $s(t)$ can also be calculated from the equivalent low-pass signal $s_{\rm TP}(t)$, which is always complex. Thus, it is equally valid to write:
- $$P = \lim_{T_{\rm M} \rightarrow \infty} \frac{\rm 1}{T_{\rm M}}\cdot \int_{-T_{\rm M}/2}^{+T_{\rm M}/2} s^2(t)\,{\rm d} t = {\rm 1}/{2} \cdot \lim_{T_{\rm M} \rightarrow \infty} \frac{\rm 1}{T_{\rm M}}\cdot \int_{-T_{\rm M}/2}^{+T_{\rm M}/2} |s_{\rm TP}(t)|^2\,{\rm d} t \hspace{0.05cm}.$$
In contrast, the energy of the unbounded signals $s(t)$ and $s_{\rm TP}(t)$ is infinite.
However, if we restrict ourselves to a symbol duration $T$, we obtain the »energy per symbol«:
- $$E_{\rm S} = \frac{{\rm E}[\hspace{0.05cm}|a_{\nu} |^2\hspace{0.05cm}]}{2}\cdot \int_{-\infty}^{+\infty} |g_s(t)|^2\,{\rm d} t = \frac{{\rm E}[|a_{\nu} |^2]}{2}\cdot \int_{-\infty}^{+\infty} |G_s(f)|^2\,{\rm d} f \hspace{0.05cm}.$$
On the other hand, $E_{\rm B} = E_{\rm S}/b$ gives the »energy per bit« if according to the signal space assignment, $b$ binary symbols are combined to the complex coefficient $a_\nu$.
$\text{Example 1:}$ The upper graph shows the signal space allocation for $\text{16-QAM}$, where both the real and imaginary parts of the complex amplitude coefficients $a_ν$ can take one of four values $±1$ as well as $±1/3$ , respectively.
Averaging over the $16$ squared distances to the origin yields:
- $${\rm E}\big[\hspace{0.05cm} \vert a_{\nu}\vert^2 \hspace{0.05cm}\big] \hspace{0.18cm} = \hspace{0.18cm} \frac{4}{16} \cdot \left [1^2 + 1^2\right ]+ \frac{4}{16} \cdot \left[(1/3 )^2 +(1/3)^2 \right ] + \frac{8}{16} \cdot \left [1^2 + (1/3)^2\right ] $$
- $$\Rightarrow \hspace{0.3cm}{\rm E}\big[\hspace{0.05cm} \vert a_{\nu}\vert^2 \hspace{0.05cm}\big] = {10}/{9}\approx 1.11 \hspace{0.05cm}.$$
In this order, the summands belong to
- the four red,
- the four black, and
- the eight blue dots.
For a NRZ rectangular basic transmission pulse $g_s(t)$ with amplitude $g_0$ and symbol duration $T$, the spectrum $G_s(f)$ is $\rm sinc$–shaped. In this case, the following holds for
- the average energy per symbol:
- $$E_{\rm S} = 1/2 \cdot {\rm E}\big[\hspace{0.05cm}\vert a_{\nu} \vert ^2 \big]\hspace{0.05cm}\cdot g_0^2 \cdot T = {5}/{9}\cdot g_0^2 \cdot T \hspace{0.05cm}\approx 0.555 \cdot g_0^2 \cdot T \hspace{0.05cm},$$
- the average energy per bit:
- $$E_{\rm B} ={E_{\rm S} }/{4}= {5}/{36}\cdot g_0^2 \cdot T \approx 0.139 \cdot g_0^2 \cdot T \hspace{0.05cm}.$$
The "maximum envelope" $s_0$ of the transmitted signal $s(t)$ is larger than the amplitude $g_0$ of the rectangular pulse by a factor of $\sqrt{2}$ (see bottom sketch) and occurs at one of the four red amplitude coefficients, i.e., whenever $\vert a_{\rm I \it ν}\vert = \vert a_{\rm Q \it ν}\vert =1$.
Signal waveforms for 4–QAM
The following graph shows the signal waveforms of $\rm 4-QAM$, where the coloring corresponds to the signal space allocation defined above.
One can see from these plots:
- The serial-to-parallel $\rm (S/P)$ conversion of the source signal $q(t)$ into the two component signals $s_{\rm I}(t)$ and $s_{\rm Q}(t)$, each with symbol duration $T = 2T_{\rm B}$ and signal values $±g_0$. Here, $T_{\rm B}$ denotes the "bit duration".
- The two phase modulated signals $s_{\rm cos}(t)$ and $s_{\rm –sin}(t)$ with phase jumps around $±π$:
- $$s_{\rm cos} (t) = s_{\rm I} (t) \cdot \cos(2\pi f_{\rm T}t)\hspace{0.05cm},$$
- $$s_{\rm -sin} (t) = -s_{\rm Q} (t) \cdot \sin(2\pi f_{\rm T}t)\hspace{0.05cm}. $$
- The QAM signal $s(t) = s_{\rm cos}(t) \ – \ s_{\rm –sin}(t)$ with phase jumps by multiples of $±π/2$; their envelope is larger than the two component signals by a factor of $\sqrt{2}$:
- $$s_0 = \sqrt{2} \cdot g_0 \hspace{0.05cm}.$$
- Here, the basic transmission pulse $g_s(t)$ is assumed to be rectangular between $0$ and $T$, i.e., asymmetric with respect to $t = 0$, for simplicity of representation. The associated spectral function $G_s(f)$ of this causal pulse $g_s(t)$ is complex, though this has no implications in this context.
Error probabilities of 4–QAM
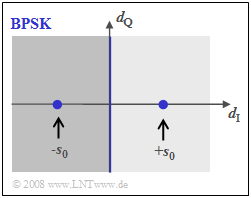
In the earlier section "Error probabilities – a brief overview", the bit error probability of "binary phase shift keying" $\rm (BPSK)$ was given. Now the results are transferred to $\text{4-QAM}$, where the following conditions still apply:
- a transmitted signal with the average energy $E_{\rm B}$ per bit,
- AWGN noise with the (single-sided) noise power density $N_0$,
- the best possible receiver realization using the matched-filter principle.
The upper graph shows the BPSK phase diagram of the detection signal $d(t)$, i.e., including the matched filter. The distance of the useful signal from the threshold $(d_{\rm Q}$–axis$)$ is $s_0$ at each of the detection times.
Using the additional equations
- $$p_{\rm B} = {\rm Q}\left ( {s_0}/{\sigma_d } \right ), \hspace{0.2cm} E_{\rm B} = {1}/{2} \cdot s_0^2 \cdot T_{\rm B} ,\hspace{0.2cm} \sigma_d^2 = {N_0}/{T_{\rm B} }$$
the »BPSK error probability« is given by: $$p_{\rm B, \hspace{0.1cm}BPSK} = {\rm Q}\left ( \sqrt{{2 \cdot E_{\rm B}}/{N_0 }} \hspace{0.1cm}\right ) = {1}/{2}\cdot {\rm erfc}\left ( \sqrt{{E_{\rm B}}/{N_0 }} \hspace{0.1cm}\right ).$$
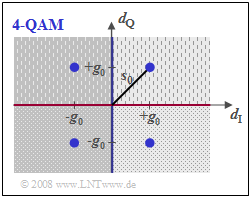
In the $\text{4-QAM}$ corresponding to the graph below
- there are two thresholds between the areas with lighter/darker background (blue line) and between the dotted/dashed areas (red line), but
- the distance from each threshold is only $g_0$ instead of $s_0$,
- the noise power $\sigma_d^2$ is also only half as large compared to BPSK because of the halved symbol rate in each sub-branch.
Thus, with the equations
- $$p_{\rm B} = {\rm Q}\left ( {g_0}/{\sigma_d } \right ), \hspace{0.2cm}g_{0} = {s_0}/{\sqrt{2}}, \hspace{0.2cm}E_{\rm B} = {1}/{2} \cdot s_0^2 \cdot T_{\rm B} ,\hspace{0.2cm} \sigma_d^2 = {N_0}(2 \cdot T_{\rm B} )$$
one obtains the exact same result for the »4-QAM error probability« as for BPSK:
- $$p_{\rm B, \hspace{0.1cm}4-QAM} = {\rm Q}\left ( \sqrt{{2 \cdot E_{\rm B}}/{N_0 }} \hspace{0.1cm}\right ) = {1}/{2}\cdot {\rm erfc}\left ( \sqrt{{E_{\rm B}}/{N_0 }} \hspace{0.1cm}\right ).$$
$\text{Conclusion:}$
- Under ideal conditions, $\text{4-QAM}$ has the same error probability as $\text{BPSK}$, although twice the amount of information can be transmitted.
- However, if the conditions are no longer ideal – for example, if there is an unwanted phase offset between transmitter and receiver – there is much more degradation with 4-QAM than with BPSK.
- This case is considered in more detail in the section "Error probabilities for 4–QAM and 4–PSK" of the book "Digital Signal Transmission".
Quadratic QAM signal space constellations
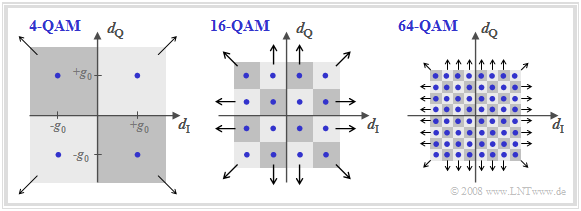
The following figure shows the signal space constellations of $\text{4-QAM}$, $\text{16-QAM}$ and $\text{64-QAM}$.
- With the axis labels chosen here, the figures also describe the useful detection signal (at detection times) in the equivalent low-pass range.
- Also plotted are the various decision regions assigned to the noisy detection signal.
- The arrows indicate when decision regions are extended to infinity.
The figures apply to all Nyquist systems
- such as the "rectangular-rectangular" configuration (basic transmission pulse and receiver filter impulse response are both rectangular)
- or a $\text{root cosine rolloff Nyquist system}$.
However, the transitions between the individual points outside the detection times depend very much on the selected Nyquist system.
Further things to note about these representations:
- With a "true QAM structure" ⇒ a square or at least rectangular signal space configuration:
The "two-dimensional detection process" can be solved in a simplified way by two "one-dimensional detection processes". - $\text{16-QAM}$ is thus nothing more than the parallel transmission of two digital signals with $M = 4$ amplitude levels each.
- For $\text{64-QAM}$ ⇒ $M = 8$ would apply analogously. For $\text{256-QAM}$: the "one-dimensional" number of levels is $M = 16$.
- All the properties for redundancy-free multi-level signals mentioned in the later chapter "Redundancy-free Coding" also apply here.
Other signal space constellations
The graphic shows further signal space constellations. On the left, 4-QAM is shown according to the previous description. The next constellation to the right indicates a four-level phase modulation, which we call "4-PSK" or "QPSK". A comparison of these two diagrams on the left shows:
- The variant referred to here as $\rm QPSK$ ("Quaternary Phase Shift Keying") uses the phase positions $0^\circ$, $90^\circ$, $180^\circ$, $270^\circ$. From the plotted decision regions, it can be seen that the detection cannot be attributed to two binary decisions here.
- $\rm 4–QAM$ (left diagram) can also be understood as a four-level phase modulation $($positions $±45^\circ$, $±135^\circ)$. Compared to QPSK, there is a rotation of $±45^\circ$ $(π/4)$ ⇒ 4–QAM is also called ${\rm π/4}\text{–QPSK}$.
- Similarly to how one arrives at DPSK by pre-coding BPSK, "4-PSK" can also be extended to $\rm 4-DPSK$, thereby facilitating demodulation. This was used e.g. for data transmission over telephone channels ⇒ CCITT recommendation "V26" $($carrier frequency $\text{1800 Hz}$, data rate $\text{2400 bit/s)}$.
The two diagrams on the right show higher-level modulation methods:
- The "8–PSK" (or "8–DPSK") allows a data rate of up to $\text{4800 bit/s}$ for the telephone channel according to CCITT recommendation "V27".
- Recommendation "V29" enables a hybrid modulation in the form of "16-ASK/PSK", which enables data rates of up to $\text{9600 bit/s}$ for permanently connected lines.
Nyquist and Root-Nyquist QAM systems
So far in this chapter, for reasons of easy representation, the rectangular basic transmission pulse has always been assumed. In practice, however, a »root-Nyquist characteristic« is usually used according to the $\text{description}$ in the book "Digital Signal Transmission". Briefly, these systems can be characterized as follows:
- The receiver (German: "Empfänger" ⇒ subscript; "E") frequency response $H_{\rm E}(f)$ is chosen here to be equal in shape to the (normalized) transmission pulse (German: "Sendeimpuls" ⇒ subscript; "S") spectrum $H_{\rm S}(f)$, which leads to the smallest possible error probability under the constraints of power limitation.
- The overall frequency response $H_{\rm Nyq}(f) = H_{\rm S}(f) · H_{\rm E}(f)$ satisfies the $\text{first Nyquist criterion}$, so there is no intersymbol interference $\text{(ISI)}$ at the receiver. Thus, $H_{\rm S}(f)$ and $H_{\rm E}(f)$ each have a root-Nyquist characteristic.
- For the frequency response $H_{\rm Nyq}(f)$, one often uses a $\text{cosine rolloff low-pass}$ $H_{\rm CRO}(f)$ with equivalent bandwidth $Δf_{\rm CRO} = 1/T$ and freely chosen rolloff factor $ (0 ≤ r ≤ 1)$. The interactive applet "Frequency and Impulse Responses" illustrates frequency response and impulse response of this low-pass filter.
- The advantage of these root-Nyquist systems is the much smaller bandwidth $(1 + r)/T$ compared to the previously considered configuration with rectangular $g_s(t)$ and rectangular $h_{\rm E}(t)$, whose spectrum is (theoretically) infinitely extended.
- In terms of error probability, nothing changes compared to the "rectangular-rectangular" configuration because the basic detection pulse $g_d(t)$ before the decision has equidistant zero crossings, thus avoiding intersymbol interference.
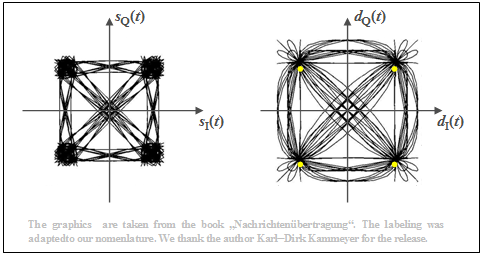
The graph shows phase diagrams for this case, taken from the book [Kam04][1]. The rolloff factor is $r = 0.5$. From these plots, one can see:
- The right plot shows the detection signals in the $\rm I$ and $\rm Q$ branches after the root-Nyquist receiver filters in a two-dimensional representation. The corresponding spectra each have cosine-shaped slopes around the Nyquist frequency $f_{\rm Nyq} = 1/(2T)$.
- At the detection times, only the four yellow points are possible in the phase diagram. The transitions in between are diverse. It should be noted that only a few lines pass through the coordinate null point.
- Shown on the left are the two transmitted signals in the equivalent low-pass region, $s_{\rm I}(t) = {\rm Re}\big[s_{\rm TP}(t)\big]$ and $s_{\rm Q}(t) = {\rm Im}\big[s_{\rm TP}(t)\big]$. Due to the root-Nyquist spectral shaping, there is intersymbol interference at the transmitter, which means that the equivalent low-pass signal $s_{\rm TP}(t) = s_{\rm I}(t) + {\rm j} · s_{\rm Q}(t)$ is also not limited to four points at the detection times.
- The magnitude $|s_{\rm TP}(t)|$ – that is, the distance from zero – indicates the envelope of the 4-QAM signal. It can be clearly seen from the left diagram that there are strong amplitude dips especially with phase changes around $π$, since then $s_{\rm TP}(t)$ also often assumes (complex) values close to zero.
Offset–Quadrature amplitude modulation
Taking the equations for the "$\text{4–QAM}$" $($or "$π/4\text{–QPSK}$"$)$ as our starting point, we arrive at the "$\text{Offset–4–QAM}$", which we simplify by calling "$\text{Offset–QPSK}$". Here the transmitted signal is given by:
- $$s(t) =s_{\rm I}(t) \cdot \cos(2 \pi f_{\rm T} t) - s_{\rm Q}(t) \cdot \sin(2 \pi f_{\rm T} t),$$
- $$\hspace{0.3cm}\Rightarrow \hspace{0.3cm}s_{\rm I}(t) = \sum_{\nu = - \infty}^{+\infty}a_{\rm I\hspace{0.03cm}\it \nu} \cdot g_s (t - \nu \cdot T)\hspace{0.05cm},\hspace{0.5cm} s_{\rm Q}(t) = \sum_{\nu = - \infty}^{+\infty}a_{\rm Q\hspace{0.03cm}\it \nu} \cdot g_s (t -{T}/{2} - \nu \cdot T)\hspace{0.05cm}.$$
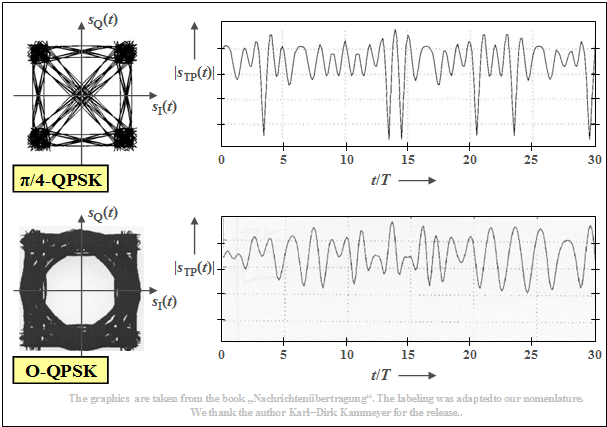
The sole but decisive difference is the time shift of the quadrature component with respect to the in-phase component by half a symbol duration $(T/2)$. This has the advantage that
- the phase function does not pass through zero, and
- the envelope $|s_{\rm TP}(t)|$ therefore fluctuates much less.
$\text{Example 2:}$ The upper graph shows
- the phase diagram for $π/4\hspace{-0.05cm}-\hspace{-0.05cm}\text{QPSK}$ on the left,
- on the right, a typical envelope curve, based on a root Nyquist spectrum with rolloff factor $r = 0.5$, as in the last section.
The lower graphic shows that the $\text{Offset – QPSK}$ has significantly better properties with respect to the envelope (less severe signal dips).
⇒ Essential properties of "4-QAM/QPSK" and "Offset-QPSK" can be illustrated with the interactive (German language) SWF applet "QPSK and Offset-QPSK", where the basic pulse can be alternatively chosen as
- a rectangular pulse,
- a cosine pulse,
- a Nyquist pulse,
- a root Nyquist pulse.
Exercises for the chapter
Exercise 4.10: Signal Waveforms of the 16-QAM
Exercise 4.10Z: Signal Space Constellation of the 16-QAM
Exercise 4.11: Frequency Domain Consideration of the 4-QAM
Exercise 4.11Z: Error Probability with QAM
Exercise 4.12: Root-Nyquist Systems
Exercise 4.12Z: 4-QAM Systems again
References
- ↑ Kammeyer, K.D.: Nachrichtenübertragung. Stuttgart: B.G. Teubner, 4. Auflage, 2004.
