Contents
- 1 Signal space representation of linear modulation
- 2 Coherent demodulation and optimal receiver
- 3 On–off keying (2–ASK)
- 4 Binary phase shift keying (BPSK)
- 5 M–level amplitude shift keying (M–ASK)
- 6 Quadrature amplitude modulation (M-QAM)
- 7 Multi-level phase–shift keying (M–PSK)
- 8 Binary frequency shift keying (2–FSK)
- 9 Minimum Shift Keying (MSK)
- 10 Aufgaben zum Kapitel
- 11 Quellenverzeichnis
Signal space representation of linear modulation
In the first three chapters of this "fourth main chapter" "Generalized Description of Digital Modulation Methods" the structure of the optimal receiver and the signal representation by means of basis functions were treated by the example of baseband transmission.
With the same systematics and the same uniformity, band–pass systems will now also be considered which have already been described in earlier books or chapters, namely
- in the main chapter 4: "Digital Modulation Methods" of the book "Modulation Methods",
- in the chapter "Linear Digital Modulation - Coherent Demodulation" of the present book.
In the following, we restrict ourselves to linear modulation methods and coherent demodulation. This means that the receiver must know exactly the frequency and phase of the carrier signal added to the transmitter. In the following chapter, "Carrier Frequency Systems with Non-Coherent Demodulation" are discussed.
In the case of coherent demodulation, the entire transmission system can be described in the "equivalent low-pass domain", and the relationship to baseband transmission is even more obvious than when band-pass signals are considered.
This results in the sketched model. Complex quantities are marked by a yellow filled double arrow. It should be noted with regard to this graph:
- From the incoming bit stream $\langle q_k \rangle \in \{\rm 0, \ L \}$, $b$ data bits each are converted serially/parallel. These output bits result in the message $m \in \{m_0, \hspace{0.05cm}\text{...} \hspace{0.05cm}, m_{M-1} \}$, where $M = 2^b$ indicates the level number. For the following, the message $m = m_i$ is assumed.
- In the signal space allocation, a complex amplitude coefficient $a_i = a_{{\rm I}i} + {\rm j} \cdot a_{{\rm Q}i}$ is assigned to each message $m_i$, whose real part will form the in-phase component and whose imaginary part will form the quadrature component of the later transmitted signal.
- At the output of the blue marked block generation of the TP signal the (in general) complex-valued "equivalent low-pass signal" is present, where $g_s(t)$ shall be limited for the time being to the range $ 0 \le t \le T$ just like $s_{\rm TP}(t)$. The index $i$ again provides an indication of the message $m_i$ sent:
- \[s_{\rm TP}(t) \big {|}_{m \hspace{0.05cm}= \hspace{0.05cm} m_i} = a_i \cdot g_s(t) = a_{{\rm I}i} \cdot g_s(t) + {\rm j} \cdot a_{{\rm Q}i} \cdot g_s(t)\]
- By energy normalization one gets from the basic transmission pulse $g_s(t)$ to the basis function
- \[\varphi_1(t) = { g_s(t)}/{\sqrt{E_{gs}}} \hspace{0.4cm} {\rm with} \hspace{0.4cm} E_{gs} = \int_{0}^{T} g_s(t)^2 \,{\rm d} t \hspace{0.3cm} \Rightarrow \hspace{0.3cm} s_{\rm TP}(t) \big {|}_{m\hspace{0.05cm} =\hspace{0.05cm} m_i} = s_{{\rm I}i} \cdot \varphi_1(t) + s_{{\rm Q}i} \cdot {\rm j} \cdot \varphi_1(t) \hspace{0.05cm}.\]
- While the coefficients $a_{{\rm I}i}$ and $a_{{\rm Q}i}$ are dimensionless, the new coefficients $s_{{\rm I}i}$ and $s_{{\rm Q}i}$ have the unit "root of energy" ⇒ see page "Nomenclature in the fourth chapter":
- \[s_{{\rm I}i} = {\sqrt{E_{gs}}} \cdot a_{{\rm I}i}\hspace{0.05cm}, \hspace{0.2cm} s_{{\rm Q}i} = {\sqrt{E_{gs}}} \cdot a_{{\rm Q}i}\hspace{0.05cm}. \]
- The equations show that the system considered here is completely described in the equivalent TP domain by one real basis function $\varphi_1(t)$ and one purely imaginary basis function $\psi_1(t) = {\rm j} \cdot \varphi_1(t)$ each, or by a single complex basis function $\xi_1(t)$.
- The gray shaded part of the block diagram shows the model for generating the band-pass signal $s_{\rm BP}(t)$, first the generation of the "analytical signal" $s_{\rm +}(t) = s_{\rm TP}(t) \cdot {\rm e}^{{\rm j}2\pi \cdot f_{\rm T} \cdot T}$ and then the real part formation.
- The two basis functions of the band-pass signal $s_{\rm BP}(t)$ result here as energy-normalized and time-limited to the range $0 \le t \le T$ cosine and minus-sine oscillations, respectively.
Coherent demodulation and optimal receiver
In the following, we always assume the equivalent low-pass signal unless explicitly stated otherwise. In particular, the signals $s(t) = s_{\rm TP}(t)$ and $r(t) = r_{\rm TP}(t)$ in the graph are low-pass signals and thus generally complex. The suffix "TP" is omitted in the remainder of this paper.
To this figure is to be noted:
- The phase delay of the channel (i.e. a phase function increasing linearly with frequency) is expressed in the low-pass range by the time-independent rotation factor ${\rm e}^{{\rm j}\hspace{0.05cm} \phi}$.
- The signal $n\hspace{0.05cm}'(t)$ describes a complex white Gaussian random process in the TP domain, as given in the section "N-dimensional Gaussian noise". The apostrophe was added in order to be able to work with $n(t)$ later in the overall system.
- The receiver knows the channel phase $\phi$ and corrects it by the conjugate-complex rotation factor ${\rm e}^{-{\rm j}\hspace{0.05cm}\phi}$. Thus the received signal in the equivalent low-pass range is:
- \[r(t) = s(t) + n\hspace{0.05cm}'(t) \cdot {\rm e}^{\hspace{0.05cm}{\rm j}\hspace{0.05cm}\phi}= s(t) + n(t) \hspace{0.05cm}.\]
- The phase rotation does not change the properties of the circular symmetric noise ⇒ $n(t) = n\hspace{0.05cm}'(t) \cdot {\rm e}^{-{\rm j}\hspace{0.05cm}\phi}$ has exactly the same statistical properties as $n\hspace{0.05cm}'(t)$.
The left graphic in the figure above illustrates the facts just described.
- The right graph shows the overall system as used for the rest of the fourth main chapter.
- The AWGN channel is followed by an optimal receiver according to the section "N-dimensional Gaussian noise".
$\text{Definition:}$ A symbol error occurs whenever $\hat{m}$ does not match the message $m$ sent:
- \[m = m_i \hspace{0.2cm} \cap \hspace{0.2cm} \hat{m} \ne m_i \hspace{0.05cm}.\]
On–off keying (2–ASK)
The simplest digital modulation method is On–off keying (OOK), which has already been described in detail in the book "Modulation Methods" on the basis of its band-pass signals. There this method was partly also called Amplitude Shift Keying (2–ASK).
This method can be characterized as follows:
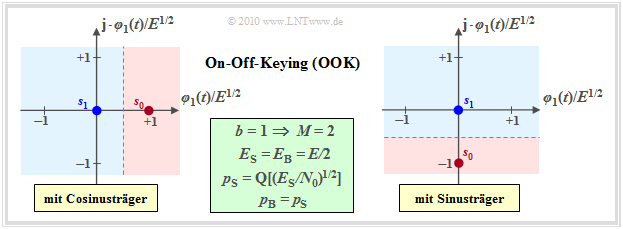
- OOK is a one-dimensional modulation method $(N = 1)$ with $s_{{\rm I}i} = \{0, E^{1/2}\}$ and $s_{{\rm Q}i} \equiv 0$ or $s_{{\rm I}i} \equiv 0$ and $s_{{\rm Q}i} = \{0, -E^{1/2}\}$. As an abbreviation, $E = E_{g_s}$. The first combination describes a cosinusoidal carrier signal, the second combination a sinusoidal carrier.
- Each bit is assigned to a binary symbol $(b = 1, \ M = 2)$; thus, no serial/parallel converter is needed. For equally probable symbols, which is always assumed for what follows, both the mean energy per symbol $(E_{\rm S})$ and the mean energy per bit $(E_{\rm B})$ are equal to $E/2$.
- The optimal OOK receiver virtually projects the complex-valued received signal $r(t)$ onto the basis function $\varphi_1(t)$, if one starts from the left sketch (cosine carrier).
- Because of $N = 1$, the noise can be one-dimensional with the variance $\sigma_n^2 = N_0/2$. Using the statements in the section "Error probability for symbols with equal probability", we obtain for the mean symbol error probability:
- \[p_{\rm S} = {\rm Pr}({\cal{E}}) = {\rm Q} \left ( \frac{d/2}{\sigma_n}\right ) = {\rm Q} \left ( \sqrt{\frac{E}{2 N_0}}\right ) = {\rm Q} \left ( \sqrt{{E_{\rm S}}/{N_0}}\right ) \hspace{0.05cm}.\]
- Since each bit is mapped to exactly one symbol, the average bit error probability $p_{\rm B}$ is exactly:
- \[p_{\rm B} = {\rm Q} \left ( \sqrt{{E_{\rm S}}/{N_0}}\right ) = {\rm Q} \left ( \sqrt{{E_{\rm B}}/{N_0}}\right ) \hspace{0.05cm}.\]
Binary phase shift keying (BPSK)
The very often used method Binary Phase Shift Keying (BPSK), which was already described in detail in the chapter "Linear Digital Modulation" of the book "Modulation Methods" using the band–pass signals (typical: phase jumps), differs from On–off keying by a constant envelope.
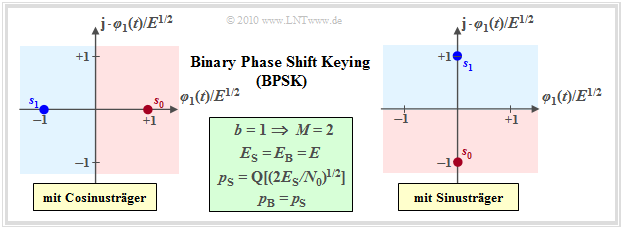
For the signal space points, $\boldsymbol{s}_1 = -\boldsymbol{s}_0$ always holds. For example, they are:
- $s_{{\rm I}i} = \{\pm E^{1/2}\}$ and $s_{{\rm Q}i} \equiv 0$ with a cosine carrier,
- $s_{{\rm I}i} \equiv 0$ and $s_{{\rm Q}i} = \{\pm E^{1/2}\}$ with a sinusoidal carrier.
The improvements compared to on–off keying can be seen from the equations given in the graphic (in the field with a green background):
- For a given normalization energy $E$, the distance between $\boldsymbol{s}_0$ and $\boldsymbol{s}_1$ is twice as large. This gives the error probability (both related to symbols and bits):
- \[p_{\rm S} = p_{\rm B} = {\rm Pr}({\cal{E}}) = {\rm Q} \left ( \frac{d/2}{\sigma_n}\right ) = {\rm Q} \left ( \sqrt{{2 E}/{N_0}}\right ) = {\rm Q} \left ( \sqrt{{2 E_{\rm S}}/{N_0}}\right ) \hspace{0.05cm}.\]
- This equation also takes into account that $E_{\rm S} = E_{\rm B} = E$ now applies, which means that the average energies per symbol or per bit are now twice as large as with OOK.
- Because of the factor $2$ under the square root in the argument of the Q function, the BPSK error probability is noticeably lower than with on–off keying if $E_{\rm S}$ and $N_0$ are not changed.
- In other words: With the same $N_0$, BPSK only requires half the symbol energy $E_{\rm S}$ in order to achieve the same error probability as on–off keying. The logarithmic gain is $3 \ \rm dB$.
M–level amplitude shift keying (M–ASK)
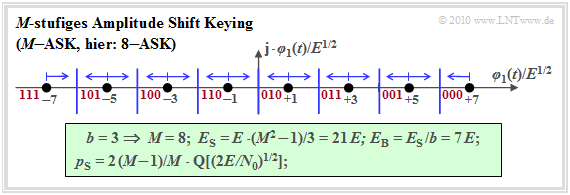
In analogy to "M–level baseband transmission", we now consider $M$–level Amplitude Shift Keying ($M$–ASK), whose low-pass signal space constellation for the parameters $b = 3$ ⇒ $M = 8$ ⇒ $8$–ASK looks as follows.
The name $M$–ASK is not entirely accurate. Rather, it is a combined ASK/PSK method, since, for example, the two innermost signal space points $(\pm 1)$ do not differ in terms of amplitude (envelope), but only in terms of phase ($0^\circ$ or $180^\circ$).
It should also be noted:
- The average energy per symbol can be calculated as follows for this one-dimensional method using symmetry:
- \[E_{\rm S} = \frac{2}{M} \cdot \sum_{k = 1}^{M/2} (2k -1)^2 \cdot E = \frac{M^2 -1}{3} \cdot E \hspace{0.05cm}.\]
- Since each of the $M$ symbols represents $b = \log_2 (M)$ bits, the average energy per bit is:
- \[E_{\rm B} = \frac{E_{\rm S}}{b} = \frac{E_{\rm S}}{{\rm log_2}\, (M)} =\frac{M^2 -1}{3 \cdot {\rm log_2}\, (M)} \cdot E \hspace{0.3cm}\Rightarrow\hspace{0.3cm}M= 8\hspace{-0.1cm}: E_{\rm S}/E = 21 \hspace{0.05cm}, \hspace{0.1cm}E_{\rm B}/E = 7\hspace{0.05cm}.\]
- The probability that one of the two outer symbols is falsified due to AWGN noise is therefore the same
- \[{\rm Pr}({\cal{E}} \hspace{0.05cm}|\hspace{0.05cm} \text{outer symbol)} = {\rm Q} \left ( \sqrt{{2 E}/{N_0}}\right )\hspace{0.05cm}.\]
- The falsification probability of the $M-2$ inner symbols is twice as large, since other decision regions border on both the right and the left. By averaging one obtains for the (mean) symbol error probability:
- \[p_{\rm S} = {\rm Pr}({\cal{E}}) = \frac{1}{M} \cdot \left [ 2 \cdot 1 \cdot {\rm Q} \left ( \sqrt{{2 E}/{N_0}}\right ) + (M-2) \cdot 2 \cdot {\rm Q} \left ( \sqrt{{2 E}/{N_0}}\right ) \right ] \]
- \[\Rightarrow \hspace{0.3cm} p_{\rm S} = \frac{2 \cdot (M-1)}{M} \cdot {\rm Q} \left ( \sqrt{{2 E}/{N_0}}\right ) =\frac{2 \cdot (M-1)}{M} \cdot {\rm Q} \left ( \sqrt{\frac{6 \cdot E_{\rm S}}{(M^2-1) \cdot N_0}}\right ) \hspace{0.05cm}.\]
- When using the "Gray code" (neighboring symbols each differ by one bit), the bit error probability $p_{\rm B}$ is approximately the factor $b = \log_2 \ (M)$ smaller than the symbol error probability $p_{\rm S}$:
- \[p_{\rm B} \approx \frac{p_{\rm S}}{b} = \frac{2 \cdot (M-1)}{M \cdot {\rm log_2}\, (M)} \cdot {\rm Q} \left ( \sqrt{{6 \cdot {\rm log_2}\, (M)}/({M^2-1 }) \cdot { E_{\rm B}}/{ N_0}}\right ) \hspace{0.05cm}.\]
Quadrature amplitude modulation (M-QAM)
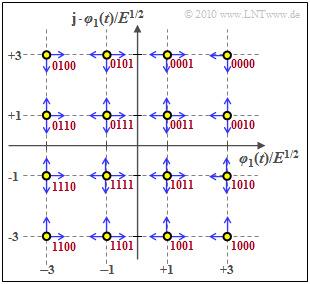
The "quadrature amplitude modulation" ($M$–QAM) results from a $M$–ASK each for in-phase and quadrature components ⇒ $M^2$ signal space points.
Each symbol now represents $b = \log_2 (M)$ binary characters (bits). The graphic shows the special case $M = 16$ ⇒ $b = 4$. The bit assignment for "Gray coding" is shown in red (neighboring symbols each differ by one bit).
The average energy per symbol $(E_{\rm S})$ or the average energy per bit $(E_{\rm B})$ can be easily derived from the result for the $M$–ASK (note the difference in the equation between an energy $E$ and the expected value $\rm E[\text{...}]$):
- \[E_{\rm S} = {\rm E} \left [ |s_{i}|^2 \right ] = {\rm E} \left [ |s_{{\rm I}i}|^2 \right ] + {\rm E} \left [ |s_{{\rm Q}i}|^2 \right ] = 2 \cdot {\rm E} \left [ |s_{{\rm I}i}|^2 \right ]\]
- \[\Rightarrow \hspace{0.3cm} E_{\rm S} = 2 \cdot \frac{M_{\rm I}^2-1}{3} \cdot E = \frac{2}{3} \cdot (M-1) \cdot E\hspace{0.01cm},\hspace{0.3cm}E_{\rm B} =\frac{2 \cdot (M-1)}{3 \cdot {\rm log_2}\, (M)} \cdot E \hspace{0.01cm}.\]
In addition, the M–level quadrature amplitude modulation shows the following properties:
- The "Union Bound" can be used as an upper bound for the symbol error probability, whereby it should be noted that an inner symbol can be falsified in four directions:
- \[p_{\rm S} = {\rm Pr}({\cal{E}}) \le \left\{ \begin{array}{c} 4 \cdot p \\ 2 \cdot p \end{array} \right.\quad \begin{array}{*{1}c} {\rm for}} \hspace{0.15cm} M \ge 16 \hspace{0.05cm}, \\ {\rm for}} \hspace{0.15cm} M = 4 \hspace{0.05cm},\\ \end{array} \hspace{0.4cm} {\rm mit} \hspace{0.4cm} p = {\rm Q} \left ( \sqrt{{2 E}/{N_0}}\right ) \hspace{0.05cm}.\]
- Berücksichtigt man, dass nur die $(b-2)^2$ inneren Punkte in vier Richtungen verfälscht werden, die vier Eckpunkte dagegen nur in zwei und die restlichen in drei Richtungen (blaue Pfeile in der Grafik), so erhält man mit $M = b^2$ die bessere Näherung
- \[p_{\rm S} \approx {1}/{M} \cdot \big [(b - 2)^2 \cdot 4p + 4 \cdot 2p + 4 \cdot (b - 2) \cdot 3p \big ] = {p}/{M} \cdot \big [ 4 \cdot M - 16 \cdot \sqrt{M} + 16 + 8 + 12 \cdot \sqrt{M} - 24\big ] \]
- \[\Rightarrow \hspace{0.3cm} p_{\rm S} \approx {4 \cdot p}/{M} \cdot \big [ M - \sqrt{M} \big ] = 4p \cdot \big [ 1 - {1}/{\sqrt{M}} \big ] \]
- \[\Rightarrow\hspace{0.3cm} M = 16\hspace{-0.1cm}: \hspace{0.1cm} p_{\rm S} \approx 3 \cdot p = 3 \cdot {\rm Q} \big ( \sqrt{{2 E}/{N_0}}\big ) = 3 \cdot {\rm Q} \big ( \sqrt{{1/5 \cdot E_{\rm S}}/{ N_0}}\big ) \hspace{0.05cm}.\]
$\text{Fazit:}$ Bei der $M$–QAM gilt allgemein $E_{\rm B} = E_{\rm S}/\log_2 \hspace{0.05cm} (M)$ und bei Graycodierung zusätzlich $p_{\rm B} = p_{\rm S}/\log_2 \hspace{0.05cm} (M)$.
Damit erhält man für die mittlere Bitfehlerwahrscheinlichkeit:
- \[p_{\rm B} \approx \frac{4 \cdot (1 - 1/\sqrt{M})}{ {\rm log_2}\hspace{0.05cm} (M)} \cdot {\rm Q} \left ( \sqrt{ \frac{3 \cdot {\rm log_2}\, (M)}{M-1 } \cdot { E_{\rm B} }/{ N_0} }\right ) \hspace{0.05cm}.\]
- Die Näherung gilt für $M \le 16$ exakt, wenn – wie für die obere Grafik vorausgesetzt – keine "diagonalen Verfälschungen" auftreten.
- Der Sonderfall "4–QAM" (ohne innere Symbole) wird in der Aufgabe 4.13 behandelt.
Multi-level phase–shift keying (M–PSK)
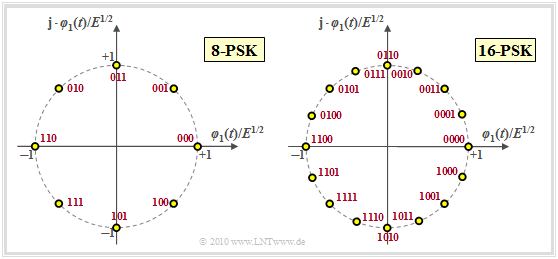
Bei mehrstufiger Phasenmodulation, wobei die Stufenzahl $M$ in der Praxis meist eine Zweierpotenz ist, liegen alle Signalraumpunkte auf einem Kreis mit Radius $E^{1/2}$ gleichmäßig verteilt. Damit gilt für die mittlere Symbolenergie $E_{\rm S} = E$ und für die mittlere Energie pro Bit $E_{\rm B} = E_{\rm S}/b = E/\hspace{-0.05cm}\log_2 \hspace{0.05cm} (M)$.
Für die Inphase– und die Quadraturkomponente der Signalraumpunkte $\boldsymbol{s}_i$ gilt allgemein $(i = 0, \hspace{0.05cm}\text{...} \hspace{0.05cm}, \hspace{0.05cm}M-1)$:
- \[s_{{\rm I}i} = \cos \left ( { 2\pi i}/{ M} + \phi_{\rm off} \right ) \hspace{0.05cm},\hspace{0.2cm} s_{{\rm Q}i} = \sin \left ( { 2\pi i}/{ M} + \phi_{\rm off} \right ) \hspace{0.2cm}\Rightarrow \hspace{0.2cm} || \boldsymbol{ s}_i || = \sqrt{ s_{{\rm I}i}^2 + s_{{\rm Q}i}^2} = 1 \hspace{0.05cm}.\]
Der Phasenoffset ist in obiger Grafik jeweils zu $\phi_{\rm off} = 0$ gesetzt. Die 4–PSK mit $\phi_{\rm off} = \pi/4 \ (45^\circ)$ ist identisch mit der 4–QAM. Der Abstand zwischen zwei benachbarten Punkten ist in allen Fällen gleich:
- \[d_{\rm min} = d_{\rm 0, \hspace{0.05cm}1} = d_{\rm 1, \hspace{0.05cm}2} = \hspace{0.05cm}\text{...} \hspace{0.05cm} = d_{M-1, \hspace{0.05cm}0} = 2 \cdot \sqrt{E} \cdot \sin (\pi/M)\]
- \[\Rightarrow\hspace{0.3cm} M = 4\hspace{-0.1cm}:\hspace{0.1cm}d_{\rm min}/E^{1/2} = \sqrt{2} \approx 1.414 \hspace{0.05cm}, \hspace{0.8cm} M = 8\hspace{-0.1cm}:\hspace{0.1cm}d_{\rm min}/E^{1/2} \approx 0.765 \hspace{0.05cm},\hspace{0.8cm} M = 16\hspace{-0.1cm}:\hspace{0.1cm}d_{\rm min}/E^{1/2} \approx 0.390 \hspace{0.05cm}.\]
Die obere Schranke $p_{\rm UB}$ für die AWGN–Symbolfehlerwahrscheinlichkeit nach der Union Bound liefert:
- \[p_{\rm S} = {\rm Pr}({\cal{E}}) \le 2 \cdot {\rm Q} \left ( \sin ({ \pi}/{ M}) \cdot \sqrt{ { {2E_{\rm S}}}/{ N_0} }\right ) = p_{\rm UB} \hspace{0.05cm}.\]
Man erkennt:
- Für $M = 2$ (BPSK) erhält man daraus die Abschätzung $p_{\rm S} \le p_{\rm UB} =2 \cdot {\rm Q} \left ( \sqrt{ 2E_{\rm S}/{ N_0} }\right )$. Ein Vergleich mit der auf der BPSK–Seite angegebenen Gleichung $p_{\rm S} ={\rm Q} \left ( \sqrt{ 2E_{\rm S}/{ N_0} }\right )$ zeigt, dass in diesem Sonderfall die "Union Bound" als obere Schranke den doppelten Wert liefert.
- Je größer $M$ ist, umso genauer nähert $p_{\rm UB}$ die exakte Symbolfehlerwahrscheinlichkeit $p_{\rm S}$ an. Das interaktive Applet Mehrstufige PSK & Union Bound gibt auch die genauere, durch Simulation gewonnene Fehlerwahrscheinlichkeit an.
$\text{Fazit:}$ Die Schranke für die M–PSK–Bitfehlerwahrscheinlichkeit lautet (Graycode ⇒ rote Beschriftung vorausgesetzt):
- \[p_{\rm B} \le \frac{2}{ {\rm log_2} \hspace{0.05cm}(M)} \cdot {\rm Q} \left ( \sqrt{ {\rm log_2} \hspace{0.05cm}(M)} \cdot \sin ({ \pi}/{ M}) \cdot \sqrt{ { {2E_{\rm B} } }/{ N_0} }\right ) \hspace{0.05cm}.\]
- Diese Schranke muss man allerdings nur für $M > 4$ anwenden.
- Für $M = 2$ (BPSK) und $M = 4$ (Identität zwischen 4–PSK und 4–QAM) kann man die Bitfehlerwahrscheinlichkeit exakt angeben:
- $$p_{\rm B} = {\rm Q} \left ( \sqrt{ { {2E_{\rm B} } }/{ N_0} }\right ) \hspace{0.05cm}.$$
Binary frequency shift keying (2–FSK)
Auch diese Modulationsart mit Parameter $b = 1$ ⇒ $M = 2$ wurde bereits im Abschnitt FSK – Frequency Shift Keying des Buches "Modulationsverfahren" anhand der Bandpass–Signale ausführlich beschrieben.
Die beiden möglichen Signalformen werden im Bereich $0 \le t \le T$ durch zwei unterschiedliche Frequenzen dargestellt:
- \[s_{\rm BP0}(t) \hspace{-0.1cm} = \hspace{-0.1cm} A \cdot \cos( 2\pi \cdot( f_{\rm T} + \Delta f_{\rm A})\cdot t)\hspace{0.05cm},\]
- \[ s_{\rm BP1}(t) \hspace{-0.1cm} = \hspace{-0.1cm} A \cdot \cos( 2\pi \cdot( f_{\rm T} - \Delta f_{\rm A})\cdot t)\hspace{0.05cm}.\]
$f_{\rm T}$ bezeichnet die Trägerfrequenz und $\Delta f_{\rm A}$ den (einseitigen) Frequenzhub. Die mittlere Energie pro Symbol bzw. pro Bit ist jeweils gleich:
- \[E_{\rm S} = E_{\rm B} = E = \frac{A^2 \cdot T}{2} \hspace{0.05cm}.\]
Hier soll nun die FSK im äquivalenten Tiefpass–Signalraum betrachtet werden. Dann gilt:
- \[s_{\rm TP0}(t) \hspace{-0.1cm} = \hspace{-0.1cm} \sqrt{E/T} \cdot {\rm e}^{\hspace{0.05cm}+{\rm j} \hspace{0.03cm}\cdot \hspace{0.03cm} 2\pi \hspace{0.03cm}\cdot \hspace{0.03cm} \Delta f_{\rm A} \hspace{0.03cm}\cdot t}\hspace{0.05cm},\hspace{0.2cm} 0 \le t \le T\hspace{0.05cm},\]
- \[ s_{\rm TP1}(t) \hspace{-0.1cm} = \hspace{-0.1cm} \sqrt{E/T} \cdot {\rm e}^{\hspace{0.05cm}-{\rm j} \hspace{0.03cm}\cdot \hspace{0.03cm} 2\pi \hspace{0.03cm}\cdot \hspace{0.03cm} \Delta f_{\rm A} \hspace{0.03cm}\cdot t}\hspace{0.05cm},\hspace{0.2cm} 0 \le t \le T\hspace{0.05cm},\]
und für das innere Produkt erhält man
- \[< \hspace{0.02cm} s_{\rm TP0}(t) \cdot s_{\rm TP1}(t) \hspace{0.02cm}> \hspace{0.1cm} = \hspace{-0.1cm} \int_{0}^{T} s_{\rm TP0}(t) \cdot s_{\rm TP1}^{\star}(t) \,{\rm d} t = A^2 \cdot \int_{0}^{T} {\rm e}^{\hspace{0.05cm}{\rm j} \hspace{0.03cm}\cdot \hspace{0.03cm} 4\pi \hspace{0.03cm}\cdot \hspace{0.03cm} \Delta f_{\rm A} \hspace{0.03cm}\cdot t} \,{\rm d} t = \frac{A^2}{{\rm j} \cdot 4\pi \cdot \Delta f_{\rm A}} \cdot \big [ {\rm e}^{\hspace{0.05cm}{\rm j} \hspace{0.03cm}\cdot \hspace{0.03cm} 4\pi \hspace{0.03cm}\cdot \hspace{0.03cm} \Delta f_{\rm A} \hspace{0.03cm}\cdot T} - 1 \big ] \hspace{0.05cm}.\]
$\text{Definition:}$ Der Modulationsindex $h = 2 \cdot \Delta f_{\rm A}\hspace{0.03cm}\cdot T$ ist das Verhältnis zwischen dem gesamten (beideseitigen) Frequenzhub $(2 \cdot \Delta f_{\rm A})$ und der Symbolrate $(1/T)$.
Die beiden Signale sind dann orthogonal, wenn dieses innere Produkt gleich Null ist:
- \[< \hspace{0.02cm} s_{\rm TP0}(t) \cdot s_{\rm TP1}(t) \hspace{0.02cm}> \hspace{0.1cm} = \frac{A^2\cdot T}{{\rm j} \cdot 2\pi \cdot h} \cdot \left [ {\rm e}^{\hspace{0.05cm}{\rm j} \hspace{0.03cm}\cdot \hspace{0.03cm} 2h} - 1 \right ] = 0 \hspace{0.3cm} \Rightarrow \hspace{0.3cm} h = 2 \cdot \Delta f_{\rm A} \cdot T = 1,\hspace{0.1cm} 2, \hspace{0.1cm}3,\ \text{ ... }\hspace{0.05cm}.\]
Setzt man den Modulationsindex $h$ als ganzzahlig voraus, so lassen sich die Tiefpass–Signale in der Form
- \[s_{\rm TP0}(t) = \sqrt{E} \cdot \xi_1(t) \hspace{0.05cm},\]
- \[s_{\rm TP1}(t) = \sqrt{E} \cdot \xi_2(t)\]
mit komplexen Basisfunktionen darstellen:
- \[\xi_1(t) = \sqrt{1/T} \cdot {\rm e}^{\hspace{0.05cm}+{\rm j} \hspace{0.03cm}\cdot \hspace{0.03cm} \pi \hspace{0.03cm}\cdot \hspace{0.03cm} h \hspace{0.03cm}\cdot \hspace{0.03cm}t/T}\hspace{0.05cm},\hspace{0.2cm} 0 \le t \le T\hspace{0.05cm},\]
- \[ \xi_2(t)= \sqrt{1/T} \cdot {\rm e}^{\hspace{0.05cm}-{\rm j} \hspace{0.03cm}\cdot \hspace{0.03cm} \pi \hspace{0.03cm}\cdot \hspace{0.03cm} h \hspace{0.03cm}\cdot \hspace{0.03cm}t/T}\hspace{0.05cm},\hspace{0.2cm} 0 \le t \le T \hspace{0.05cm}.\]
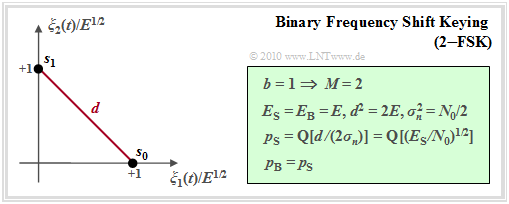
Es ergibt sich die hier skizzierte Signalraumdarstellung der binären FSK.
$\text{Fazit:}$
- Bei ganzzahligem Modulationsindex $h$ sind die Tiefpass-Signale $s_{\rm TP0}(t)$ und $s_{\rm TP1}(t)$ der binären FSK zueinander orthogonal.
- Damit ergibt sich für die Symbolfehlerwahrscheinlichkeit (Herleitung in der Grafik):
- \[p_{\rm S} = {\rm Pr}({\cal{E} }) = {\rm Q} \left ( \sqrt{ { {E_{\rm S} } }/{ N_0} }\right ) \hspace{0.05cm}.\]
- Die Bitfehlerwahrscheinlichkeit hat den gleichen Wert: $p_{\rm B} = p_{\rm S}$.
Hinweis: Im Gegensatz zur Darstellung in [KöZ08][1] ist hier der Frequenzhub $\Delta f_{\rm A}$ einseitig definiert. Deshalb unterscheiden sich die Gleichungen teilweise um den Faktor $2$. Arbeitet man jedoch mit dem Modulationsindex $h$, so gibt es keine Unterschiede.
Minimum Shift Keying (MSK)
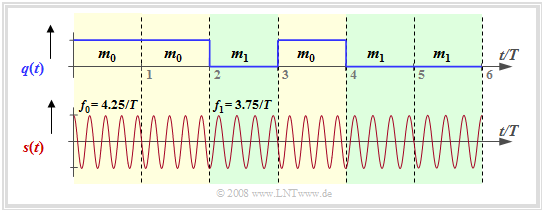
Unter Minimum Shift Keying (MSK) versteht man ein binäres FSK–System mit dem Modulationsindex $h = 0.5$ ⇒ Frequenzhub $\Delta f_{\rm A} = 1/(2T)$. Die Grafik zeigt ein MSK–Signal für die Trägerfrequenz $ f_{\rm T} = 4/T$:
- Die beiden Frequenzen innerhalb des Sendsignals sind $ f_{\rm 0} = f_{\rm T} + 1/(4T)$ zur Darstellung der Nachricht $m_0$ (gelbe Hinterlegung) sowie $ f_{\rm 1} = f_{\rm T} -1/(4T)$ ⇒ Nachricht $m_1$ (grüne Hinterlegung).
- In der Grafik ist auch eine kontinuierliche Phasenanpassung bei den Übergängen berücksichtigt, um die Signalbandbreite weiter zu verringern. Man spricht dann von Continuous Phase Modulation (CPM).
Ohne diese Phasenanpassung lauten die beiden Bandpass–Signalformen:
- \[s_{\rm BP0}(t) = \sqrt{2E/T} \cdot \cos( 2\pi f_0 t)\hspace{0.05cm},\hspace{0.2cm} 0 \le t \le T\hspace{0.05cm},\]
- \[ s_{\rm BP1}(t) = \sqrt{2E/T} \cdot \cos( 2\pi f_1 t)\hspace{0.05cm},\hspace{0.2cm} 0 \le t \le T\hspace{0.05cm}.\]
Bildet man das innere Produkt der Bandpass–Signale, so erhält man mit $f_{\rm \Delta} = f_0 - f_1$ und $f_{\rm \Sigma} = f_0 + f_1$:
- \[< \hspace{0.02cm} s_{\rm BP0}(t) \hspace{0.2cm} \cdot \hspace{0.2cm} s_{\rm BP1}(t) \hspace{0.02cm}> \hspace{0.2cm} = {2E}/{T} \cdot \int_{0}^{T} \cos( 2\pi f_0 t) \cdot \cos( 2\pi f_1 t)\,{\rm d} t = {E}/{T} \cdot \int_{0}^{T} \cos( 2\pi f_{\rm \Delta} t) \,{\rm d} t + {E}/{T} \cdot \int_{0}^{T} \cos( 2\pi f_{\rm \Sigma} t) \,{\rm d} t\]
- \[ \Rightarrow \hspace{0.3cm}< \hspace{0.02cm} s_{\rm BP0}(t) \hspace{0.2cm} \cdot \hspace{0.2cm} s_{\rm BP1}(t) \hspace{0.02cm}> \hspace{0.2cm} = {E}/{T} \cdot \int_{0}^{T} \hspace{-0.1cm} \cos( \pi \cdot {t}/{T}) \,{\rm d} t + {E}/{T} \cdot \int_{0}^{T} \hspace{-0.1cm}\cos( 2\pi \cdot 2 f_{\rm T} \cdot t) \,{\rm d} t \hspace{0.05cm}.\]
Das erste Integral ist Null $($Integral über "Cosinus" von $0$ bis $\pi)$. Für $f_{\rm T} \gg 1/T$, was man in der Praxis voraussetzen kann, verschwindet auch das zweite Integral. Damit erhält man für das innere Produkt:
- $$< \hspace{0.02cm} s_{\rm BP0}(t) \cdot s_{\rm BP1}(t) \hspace{0.02cm}> \hspace{0.2cm}= 0 \hspace{0.05cm}.$$
$\text{Fazit:}$
- Damit ist gezeigt, dass für den Modulationsindex $h = 0.5$ (also MSK) und allen Vielfachen hiervon die beiden Bandpass–Signale orthogonal sind.
- Mit den neuen reellen Basisfunktionen
- \[\varphi_1(t) = \sqrt{2/T} \cdot \cos( 2\pi f_0 t)\hspace{0.05cm},\hspace{0.2cm} 0 \le t \le T\hspace{0.05cm},\]
- \[ \varphi_2(t) = \sqrt{2/T} \cdot \cos( 2\pi f_1 t)\hspace{0.05cm},\hspace{0.2cm} 0 \le t \le T\]
- erhält man die genau gleiche Signalraumkonstellation wie für geradzahliges $h = 1, 2, 3, \ \text{ ...}$.
- Es ergibt sich somit auch die gleiche Fehlerwahrscheinlichkeit:
- \[p_{\rm S} = {\rm Pr}({\cal{E} }) = {\rm Q} \left ( \sqrt{ { {E_{\rm S} } }/{ N_0} }\right ) = p_{\rm B} \hspace{0.05cm}.\]
Aufgaben zum Kapitel
Aufgabe 4.11: On-Off-Keying und Binary Phase Shift Keying
Aufgabe 4.11Z: Nochmals OOK und BPSK
Aufgabe 4.12: Berechnungen zur 16-QAM
Aufgabe 4.14: 8-PSK und 16-PSK
Aufgabe 4.14Z: 4-QAM und 4-PSK
Aufgabe 4.15: Optimale Signalraumbelegung
Aufgabe 4.16: Binary Frequency Shift Keying
Quellenverzeichnis
- ↑ Kötter, R., Zeitler, G.: Nachrichtentechnik 2. Vorlesungsmanuskript, Lehrstuhl für Nachrichtentechnik, Technische Universität München, 2008.


