Contents
- 1 # OVERVIEW OF THE THIRD MAIN CHAPTER #
- 2 Definition of the term "Intersymbol Interference"
- 3 Possible causes for intersymbol interference
- 4 Some remarks on the channel frequency response
- 5 Frequency response of a coaxial cable
- 6 Impulse response of a coaxial cable
- 7 Prerequisites for the entire third main chapter
- 8 Exercises for the chapter
# OVERVIEW OF THE THIRD MAIN CHAPTER #
The third main chapter focuses on intersymbol interference, which arises, for example, from distortions of the transmission channel or is related to a realization of the receiver filter that deviates from the Nyquist condition. zusammenhängen. Subsequently, some equalization methods are described which can be used to mitigate the system degradation due to intersymbol interference.
The description is given throughout in the baseband. However, the results can easily be applied to the carrier frequency systems discussed in the chapter "Linear Digital Modulation - Coherent Demodulation".
In detail, it deals with:
- the causes and effects of intersymbol interference,
- the eye diagram as a suitable tool for the description of intersymbol interferences,
- the error probability calculation considering channel distortions,
- the influence of intersymbol interference in multilevel and/or coded transmission,
- the optimal Nyquist equalizer as an example of linear channel equalization,
- the decision feedback loop (DFE) – an effective nonlinear decision realization,
- the correlation receiver as an example of maximum likelihood or MAP decision making,
- the Viterbi receiver, a reduced-effort MAP decision algorithm.
Further information on the topic as well as exercises, simulations and programming exercises can be found in
- Experiment 3: Intersymbol interference and equalization, program "bas"
of the practical course "Simulation of digital transmission systems". This (former) LNT course at the TU Munich is based on
- the teaching software package "LNTsim" ⇒ link refers to the ZIP version of the program and
- this "lab manual" ⇒ link refers to the PDF version (76 pages).
Definition of the term "Intersymbol Interference"
For the first two main chapters of this book, it was assumed that the basic transmitter pulse $g_d(t)$
- either is limited to the time domain $|t| \le T$, or
- has equidistant zero crossings in the symbol spacing $T$.
If we denote the samples of $g_d(t)$ at multiples of the symbol duration $T$ (spacing of the pulses) as the basic transmitter pulse values, it has been tacitly assumed so far:
- $$g_\nu = g_d(\nu T) = \left\{ \begin{array}{c} g_0 \\ 0 \\ \end{array} \right.\quad \begin{array}{*{1}c} {\rm{for}}\\ {\rm{for}} \\ \end{array} \begin{array}{*{20}c}\nu = 0, \\ \nu \ne 0. \\ \end{array}$$
As a consequence of this assumption it has resulted that in the binary case the signal component (index "S") is
- $$d_{\rm S}(t) = \sum_{\nu = -\infty}^{+\infty} a_\nu \cdot g_d ( t - \nu \cdot T) \hspace{0.3cm}{\rm with}\hspace{0.3cm}a_\nu \in \{ -1, +1\}$$
of the detection signal at the instants $\nu \cdot T$ can take only two different values, namely $\pm g_0$.
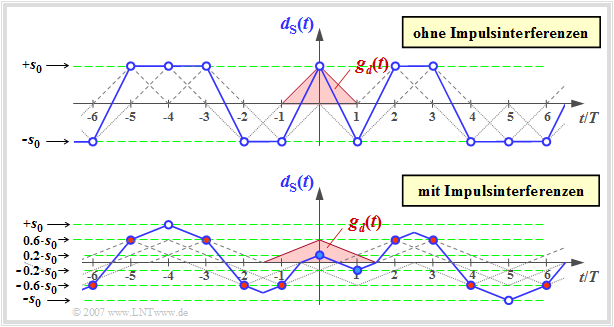
- The upper of the following two time plots shows $d_{\rm S}(t)$ for this intersymbol interference-free case with $g_{\nu \ne 0} = 0$ and $g_0 = s_0$ ⇒ the basic pulse main value $g_0$ is equal to the maximum value $s_0$ of the transmitted signal.
- Drawn below is the signal waveform for a set of basic transmitter pulse values that cause intersymbol interference:
- $$g_0 = 0.6 \cdot s_0, \hspace{0.2cm}g_{-1} = g_{+1} =0.2 \cdot s_0, \hspace{0.2cm}g_\nu =0\hspace{0.3cm}{\rm for}\hspace{0.3cm} |\nu| \ge 2 \hspace{0.05cm}.$$
In both plots, the (in each case triangular) basic transmitter pulse $g_d(t)$ is drawn in red. The detection times $\nu \cdot T$ are marked by blue circles. One can see from the lower signal plot:
- The basic transmitter pulse $g_d(t)$ is now different from zero in the range $|t| \le 1.5 \cdot T$ and thus no longer fulfills the "Nyquist condition (in the time domain)" for intersymbol interference freedom.
- As a consequence, at the detection times (marked with circles) not only two values $(\pm s_0)$ are possible as in the upper figure. Rather, the following applies here for the detection sampling values:
- $$d_{\rm S}(\nu \cdot T) \in \{ \pm s_0, \ \pm 0.6 s_0, \ \pm 0.2 s_0\}\hspace{0.05cm}.$$
- The samples that are close to the threshold due to unfavorable neighboring pulses are more often corrupted by the AWGN noise $($with noise rms value $\sigma_d)$ than the samples further out.
- Exemplarily, with $\sigma_d = 0.2 \cdot s_0$ the blue filled points close to the threshold are corrupted with high probability $p_{\rm S} ={\rm Q} (1) \approx 16 \%$ and the outer points (with white core) are corrupted only with $p_{\rm S} ={\rm Q} (5) \approx 3 \cdot 10^{-7}$. The error probability of the red filled points (all at distance $0.6 \cdot s_0$ from the zero line) is in between: $p_{\rm S} ={\rm Q} (3) \approx 0.13 \%$.
So far, the effects of intersymbol interference have been presented as vividly as possible. An exact definition is still missing.
$\text{Definition:}$ Intersymbol interference (ISI) is the impairment of a symbol decision due to pulse broadening (time dispersion) and the associated dependence of the error probability on the neighboring symbols.
In other words:
- Falling edges of preceding pulses ("trailing") and rising edges of following pulses ("leading") change the currently applied detection sample value.
- This can increase or decrease the probability of a wrong decision for the current symbol, depending on whether the distance to the threshold becomes smaller or larger.
- On statistical average – i.e. when considering an (infinitely) long symbol sequence – this always leads to a (considerable) increase of the (mean) symbol error probability $p_{\rm S} $.
Possible causes for intersymbol interference
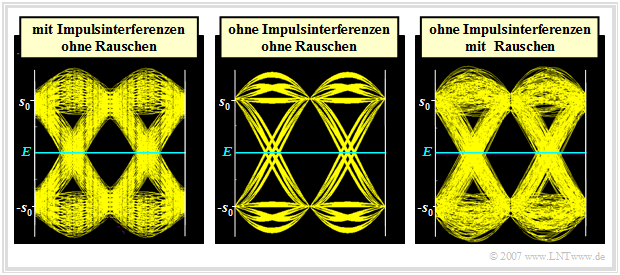
The following figure shows the "eye diagram" for a
- intersymbol interference system without noise (left),
- a intersymbol interference free system without noise (middle),
- the same intersymbol interference free system with noise (right).
The definition, meaning and calculation of the eye diagram will be discussed in detail in the chapter "Error Probability with Intersymbol Interference". The graphics were generated with the program "bas". Notes on the download of this program can be found at the beginning of this chapter.
These images can be interpreted as follows:
- The middle diagram is from a Nyquist system with cosine rolloff characteristic $($rolloff factor $r = 0.5)$. Thus, no intersymbol interference occurs.
- The right eye diagram is from the same intersymbol interference free system as the middle diagram, although here $d(t) = \pm s_0$ does not apply. The deviations from the nominal values $\pm s_0$ are here due to the AWGN noise.
- From this last point follows the important insight: The question whether there is an intersymbol interference free or an intersymbol interference affected system can only be decided on the basis of the detection signal (or the eye diagram) without noise.
- The left diagram indicates intersymbol interference, since no noise is taken into account here. The reason for this intersymbol interference could be that the overall frequency response of transmitter and receiver does not exactly fulfill the "first Nyquist criterion" due to tolerances.
- However, intersymbol interference also occurs with a channel with frequency-dependent frequency response $H_{\rm K}(f)$, if the receiver does not succeed in compensating the attenuation and phase distortions of the channel completely (i.e. one hundred percent).
- Finally, even with the middle system, intersymbol interference occurs if the decision is not made exactly in the center of the eye, but at a detection time $T_{\rm D} \ne 0$. Then the basic transmitter pulse values must be defined to $g_\nu = g_d(T_{\rm D} + \nu \cdot T)$.
Some remarks on the channel frequency response
For the further sections in this third main chapter (mostly) the following block diagram is assumed. The main difference to the "block diagram of main chapter 1" is the channel frequency response $H_{\rm K}(f)$, which was always assumed to be ideal ⇒ $H_{\rm K}(f) = 1$.
In the following, apply to the frequency response and impulse response of the channel $(\rm exp[ . ]$ denotes the exponential function$)$:
- $$H_{\rm K}(f) = {\rm exp} \left[ - a_{{\star} \hspace{0.01cm}({\rm Np})} \cdot \sqrt{\frac{f}{R_{\rm B}/2}}\hspace{0.1cm}\right] \cdot {\rm exp} \left[ - {\rm j} \cdot a_{{\star} \hspace{0.01cm}({\rm Np})} \cdot \sqrt{\frac{f}{R_{\rm B}/2}}\hspace{0.1cm}\right] \hspace{0.05cm}, $$
- $$h_{\rm K}(t) = \frac{ a_{{\star}\hspace{0.01cm}({\rm Np})}}{ \sqrt{2 \pi^2 \cdot R_{\rm B} \cdot t^3}}\hspace{0.1cm} \cdot {\rm exp} \left[ - \frac{a_{{\star} \hspace{0.01cm}({\rm Np})}^2}{2 \pi \cdot R_{\rm B} \cdot t}\hspace{0.1cm}\right] \hspace{0.05cm}.$$
Here $a_{{\star} \hspace{0.01cm}({\rm Np})}$ indicates the cable attenuation at half the bit rate. We call this quantity the characteristic cable attenuation in Neper (Np):
- $$a_{{\star} \hspace{0.01cm}({\rm Np})} = a_{\rm K}(f = {R_{\rm B}}/{2})= 0.1151 \cdot a_{{\star} \hspace{0.01cm}({\rm dB})} \hspace{0.05cm}.$$
- The corresponding dB value is larger by a factor of $1/0.1151 = 8.686$.
- In realized systems, the characteristic cable attenuation $a_{{\star} \hspace{0.01cm}({\rm dB})}$ is in the range between $40 \ \rm dB$ and $100 \ \rm dB$.
- The addition "(Np)" or "(dB)" is mostly omitted in the following.
In the main chapter 4: "Properties of electrical lines" of the book "Linear and Time Invariant Systems" it is shown that these equations reproduce the conditions with good approximation for line-bound transmission via coaxial cable. For a two-wire line, the deviation between this very simple, analytically manageable formula and the actual conditions is somewhat larger.
A short summary of these derivations follows on the next two pages. For simplicity, we will use a redundancy-free binary system. Thus, the bit rate $R_{\rm B}$ is equal to the reciprocal of the symbol duration $T$.
Frequency response of a coaxial cable
A coaxial cable with core diameter 2.6 mm, outer diameter 9.5 mm and length $l$ has the following frequency response:
- $$H_{\rm K}(f) = {\rm e}^{-\left[ a_{\rm K}(f) + {\rm j} \hspace{0.05cm}\cdot \hspace{0.05cm} b_{\rm K}(f)\right] } = {\rm e}^{- \alpha_0 \hspace{0.05cm} \cdot \hspace{0.05cm} l} \cdot {\rm e}^{- (\alpha_1 + {\rm j} \hspace{0.05cm}\cdot \hspace{0.05cm} \beta_1) \hspace{0.05cm}\cdot f \hspace{0.05cm}\cdot \hspace{0.05cm}l} \cdot {\rm e}^{- (\alpha_2 + {\rm j} \hspace{0.05cm}\cdot \hspace{0.05cm} \beta_2) \hspace{0.05cm}\cdot \sqrt{f} \hspace{0.05cm}\cdot \hspace{0.05cm}l} \hspace{0.05cm},$$
where the following parameters apply for these dimensions – referred to as normal coaxial cable:
- $$\alpha_0 = 0.00162 \hspace{0.15cm}\frac {\rm Np}{\rm km} \hspace{0.05cm},\hspace{0.2cm} \alpha_1 = 0.000435 \hspace{0.15cm}\frac {\rm Np}{{\rm km} \cdot {\rm MHz}} \hspace{0.05cm}, \hspace{0.2cm} \alpha_2 = 0.2722 \hspace{0.15cm}\frac {\rm Np}{{\rm km} \cdot \sqrt{\rm MHz}} \hspace{0.05cm},\hspace{0.2cm} \beta_1 = 21.78 \hspace{0.15cm}\frac {\rm rad}{{\rm km} \cdot {\rm MHz}} \hspace{0.05cm}, \hspace{0.2cm} \beta_2 = 0.2722 \hspace{0.15cm}\frac {\rm rad}{{\rm km} \cdot \sqrt{\rm MHz}} \hspace{0.05cm}.$$
In the above equation the attenuation parameters are to be inserted in "Np" and the phase parameters in "rad".
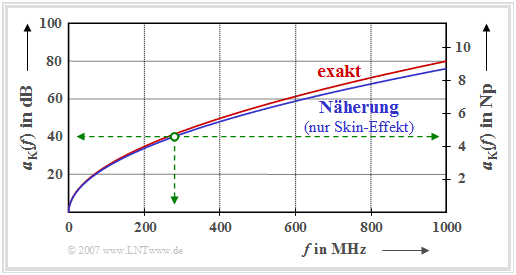
The graph shows the exact attenuation curve and an approximation
- $$a_{\rm K}(f) = \alpha_0 \cdot l \hspace{0.05cm} + \hspace{0.05cm} \alpha_1 \cdot f \cdot l + \hspace{0.05cm} \alpha_2 \cdot \sqrt{f} \cdot l \hspace{0.05cm},$$
- $$a_{\rm K}(f) \approx \alpha_2 \cdot \sqrt{f} \cdot l$$
for a standard coaxial cable of one kilometer length for frequencies up to $f = 1000\ \rm MHz$.
- The axis is labeled in $\rm dB$ on the left and $\rm Np$ on the right.
- One $\rm Np$ (Neper) corresponds to $8.686 \ \rm dB$.
At this point we refer to the interactive applet Attenuation of copper cables.
You can see from the diagram and the above numerical values:
- The first term $(\alpha_0 \cdot l)$ originating from the ohmic losses is negligible. Moreover, this term causes only frequency-independent attenuation and no signal distortion.
- The second term $(\alpha_1 \cdot f \cdot l)$, due to the transverse losses, is proportional to frequency and therefore becomes noticeable only at very high frequencies; it will be neglected in the following.
- The frequency-proportional phase $(\beta_1 \cdot f \cdot l)$ only results in a signal delay by the transit time $\beta_1/(2\pi) \cdot l$, but no distortion. This transit time will also be disregarded in the following.
- With these simplifications, the frequency response is thus determined by the skin effect alone. Since the numerical values for $\alpha_2$ (in Np) and $\beta_2$ (in rad) are the same, it follows that:
- $$H_{\rm K}(f) ={\rm e}^{- (\alpha_2 + {\rm j} \hspace{0.05cm}\cdot \hspace{0.05cm} \beta_2) \hspace{0.05cm}\cdot \sqrt{f} \hspace{0.05cm}\cdot \hspace{0.05cm}l} \cdot {\rm e}^{- \alpha_2 \hspace{0.05cm}\cdot \hspace{0.05cm}l \hspace{0.05cm}\cdot \sqrt{{\rm j} \hspace{0.05cm}\cdot \hspace{0.05cm} 2f}} \hspace{0.05cm}.$$
- Often in the literature – and also in this tutorial – the attenuation measure at half the bit rate is used, which we call the characteristic cable attenuation (in Neper):
- $$a_{\star} = a_{\rm K}(f ={R_{\rm B}}/{2})= a_{\rm K}(f = \frac{1}{2 \cdot T})\approx \frac{\alpha_2 \cdot l }{ \sqrt {2\cdot T}} \hspace{0.05cm}.$$
$\text{Example 1:}$ For a binary system with half the bit rate $R_{\rm B}/2 = 280 \ \rm Mbit/s$ and $l = 1\ \rm km$, the result is $a_{\star} \approx 4.55 \ \rm Np$ or $a_{\star} \approx 40 \ \rm dB$ (green markings in the above diagram). But if the half bit rate is only $70 \ \rm Mbit/s$, $a_{\star} = 40 \ \rm dB$ characterizes a transmission system with cable length $l = 2\ \rm km$.
- Already at this point we point out that the above approximation $a_{\rm K}(f) \approx \alpha_2 \cdot \sqrt{f} \cdot l$ is only admissible for coaxial cables, since for these the coefficients $\alpha_0$ and $\alpha_1$ can be neglected.
- For a balanced two-wire cable, the coefficients $\alpha_0$ and $\alpha_1$ are much larger and the above approximation is invalid.
Impulse response of a coaxial cable
We now consider the coaxial cable impulse response, which for a binary system $(R_{\rm B} = 1/T)$ is as follows:
- $$h_{\rm K}(t) = \frac{ a_{\rm \star \hspace{0.01cm}(Np)}/T}{ \sqrt{2 \pi^2 \cdot (t/T)^3}}\hspace{0.1cm} \cdot {\rm exp} \left[ - \frac{a_{\rm \star \hspace{0.01cm}(Np)}^2}{2 \pi \cdot t/T}\hspace{0.1cm}\right] \hspace{0.05cm}.$$
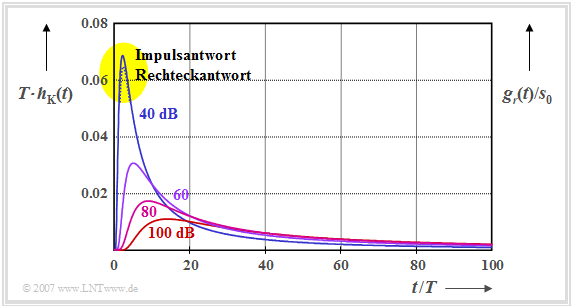
This time course is shown here for characteristic cable attenuations $(a_{\rm \star})$ between $40 \ \rm dB$ and $100 \ \rm dB$. Note the conversion $\rm 1 \ Np = 8.686 \ dB.$
One can see from this time domain plot:
- Even with the relatively small characteristic cable attenuation $a_{\rm \star} = 40 \ \rm dB$, the impulse response extends over more than $100$ symbol durations $(T)$.
- The larger $a_{\rm \star}$ is chosen, the broader and lower the impulse response becomes. The integral over $h_{\rm K}(t)$ from zero to infinity is the same for all curves, since $H_{\rm K}(f=0) = 1$ always holds.
- The basic receiver pulse $g_r(t) = g_s(t) \star h_{\rm K}(t)$ is nearly equal in shape to $h_{\rm K}(t)$. The right ordinate axis shows $g_r(t)/s_0$ when $g_s(t)$ is an NRZ rectangular pulse with height $s_0$ and duration $T$.
- For $a_{\rm \star} \ge 60 \ \rm dB$, $h_{\rm K}(t)$ and $g_r(t)$ are indistinguishable within the character accuracy when suitably normalized. For $a_{\rm \star} = 40 \ \rm dB$, one can see a small difference at the peak (yellow background); $g_r(t)/s_0$ is here minimally smaller than $T \cdot h_{\rm K}(t)$.
- However, with the characteristic attenuation $a_{\rm \star} = 40 \ \rm dB$, the pulse amplitude at the cable end is less than $7\%$ of the input amplitude. At $60 \ \rm dB$ and $100 \ \rm dB$, this value drops to $3\%$ and $2\%$.
In Exercise 3.1, the coaxial cable impulse response is analyzed in detail. We also refer here to the interactive applet Time behavior of copper cables.
Prerequisites for the entire third main chapter
Consider again the block diagram of a transmission system, assuming a highly distorting channel, such as is present in wireline transmission.
Due to the channel frequency response $H_{\rm K}(f)$, which is highlighted in red in the diagram, there are also certain limitations for the other system components:
- The basic receiver pulse $g_r(t) = g_s(t) \star h_{\rm K}(t)$ extends over hundreds of bits (see last page). Therefore, the receiver filter $H_{\rm E}(f)$ cannot be applied as a matched filter, since this would again approximately double the duration of the basic transmitter pulse $g_d(t)$ compared to $g_r(t)$.
- Rather, $H_{\rm E}(f)$ must compensate for the enormous attenuation distortions $(\alpha_2$–term$)$ and phase distortions $(\beta_2$–term$)$ of the coaxial channel $H_{\rm E}(f)$, especially if a simple threshold decision is assumed.
- Although this linear form of signal equalization can be supported by more elaborate decision strategies – for example, decision feedback, correlation receivers or Viterbi receivers. However, in the case of conducted transmission, a linear signal equalization ⇒ equalizing receiver filter $H_{\rm E}(f)$ cannot be completely dispensed with due to the very strong distortions.
- The noise $n(t)$ is further assumed to be additive, white, and Gaussian distributed (AWGN), which is justified for a coaxial cable. For a two-wire line, crosstalk from adjacent copper wires is the dominant noise, as explained in detail in the chapter ISDN (Integrated Services Digital Network) of the "Examples of Communication Systems" book.
$\text{Conclusion:}$ We consider in the following chapters the binary bipolar redundancy-free transmission ⇒ bit rate $R_{\rm B} = 1/T$. It is always assumed that:
- The basic transmission pulse $g_s(t)$ is NRZ rectangular with amplitude $s_0$ and duration $T$. Thus, the transmitted signal $s(t)$ is equal to $\pm s_0$ at all times and the spectral function is: $G_s(f) = s_0 \cdot T \cdot {\rm si}(\pi f T)$.
- Splitting the equalization between transmitter and receiver according to the root–root characteristic does not make sense for conducted transmission. There would be too much intersymbol interference already at the transmitter.
Exercises for the chapter
Exercise 3.1: Impulse response of the Coaxial Cable
Exercise 3.1Z: Frequency Response of the Coaxial Cable


